| Param | Original file | Final file |
|---|---|---|
| Filename | modeM0/AS1A10_071T18_9000004448_30792cztM0_level2.evt | modeM0/AS1A10_071T18_9000004448_30792cztM0_level2_quad_clean.evt |
| Size (bytes) | 443,540,160 | 65,105,280 |
| Size | 423.0 MB | 62.1 MB |
| Events in quadrant A | 2,004,822 | 441,207 |
| Events in quadrant B | 3,244,252 | 436,146 |
| Events in quadrant C | 3,145,628 | 407,344 |
| Events in quadrant D | 4,750,212 | 387,414 |
| Mode SS | |||
|---|---|---|---|
| Quadrant | BADHDUFLAG | Total packets | Discarded packets |
| A | 0 | 84 | 0 |
| B | 0 | 84 | 0 |
| C | 0 | 84 | 0 |
| D | 0 | 84 | 0 |
| Mode M0 | |||
|---|---|---|---|
| Quadrant | BADHDUFLAG | Total packets | Discarded packets |
| A | 0 | 8616 | 0 |
| B | 0 | 12789 | 0 |
| C | 0 | 12189 | 0 |
| D | 0 | 17089 | 0 |
| Quadrant | Total seconds | Saturated seconds | Saturation percentage |
|---|---|---|---|
| A | 4250 | 7 | 0.164706% |
| B | 4250 | 34 | 0.800000% |
| C | 4251 | 316 | 7.433545% |
| D | 4251 | 418 | 9.832980% |
Noise dominated data is calculated using 1-second bins in cleaned event files. If a bin has >2000 counts, and if more than 50% of those come from <1% of pixels, then it is considered to be noise-dominated and hence unusable.
| Quadrant | # 1 sec bins | Bins with >0 counts | Bins with >2000 counts | High rate bins dominated by noise | Noise dominated (total time) | Noise dominated (detector-on time) | Marked lightcurve |
|---|---|---|---|---|---|---|---|
| A | 4250 | 4250 | 0 | 0 | 0.00% | 0.00% | 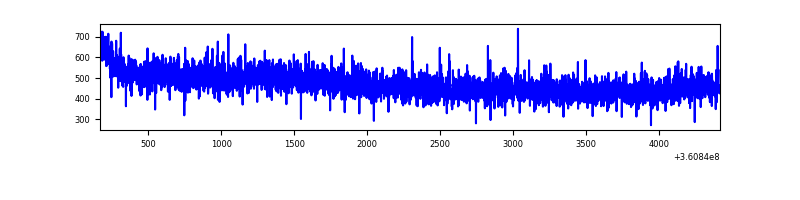 |
| B | 4250 | 4250 | 0 | 0 | 0.00% | 0.00% | 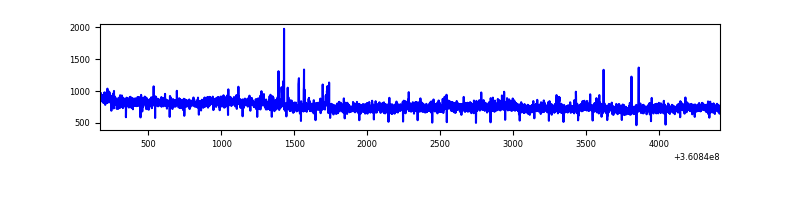 |
| C | 4251 | 4251 | 52 | 52 | 1.22% | 1.22% | 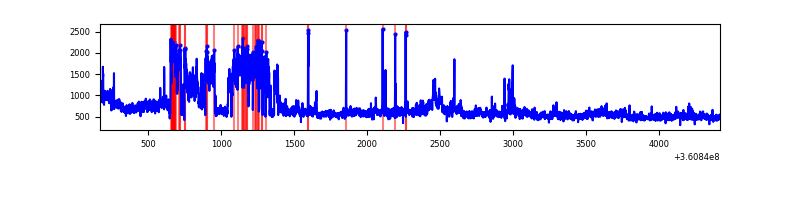 |
| D | 4251 | 4251 | 494 | 494 | 11.62% | 11.62% | 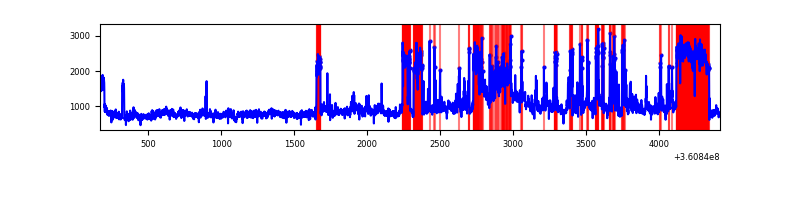 |
Top three noisy pixels from each quadrant. If the there are fewer than three noisy pixels in the level2.evt file, extra rows are filled as -1
| Pixel properties | Quadrant properties | ||||||
|---|---|---|---|---|---|---|---|
| Quadrant | DetID | PixID | Counts | Sigma | Mean | Median | Sigma |
| A | 13 | 254 | 7790 | 69.7 | 519 | 510 | 104.5 |
| A | 3 | 137 | 5075 | 43.7 | 519 | 510 | 104.5 |
| A | 0 | 226 | 4376 | 37.01 | 519 | 510 | 104.5 |
| B | 6 | 159 | 1184122 | 11920.46 | 509 | 496 | 99.3 |
| B | 0 | 190 | 34307 | 340.52 | 509 | 496 | 99.3 |
| B | 12 | 111 | 11697 | 112.81 | 509 | 496 | 99.3 |
| C | 3 | 233 | 1121048 | 9706.8 | 486 | 490 | 115.4 |
| C | 14 | 238 | 77689 | 668.73 | 486 | 490 | 115.4 |
| C | 14 | 128 | 16762 | 140.96 | 486 | 490 | 115.4 |
| D | 8 | 195 | 2290172 | 17919.57 | 483 | 474 | 127.8 |
| D | 13 | 249 | 392380 | 3067.12 | 483 | 474 | 127.8 |
| D | 12 | 227 | 175376 | 1368.81 | 483 | 474 | 127.8 |
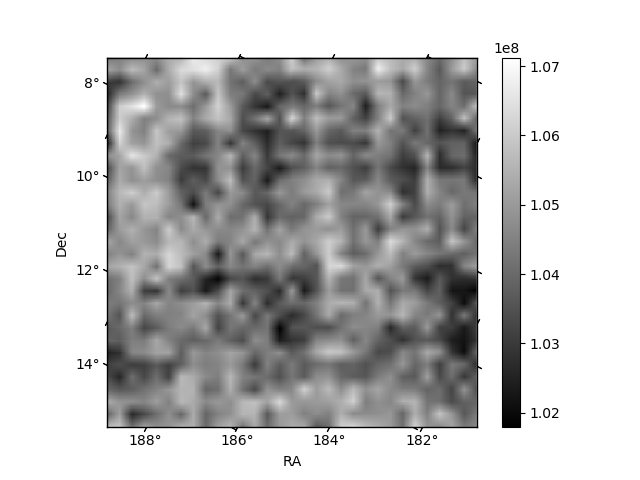
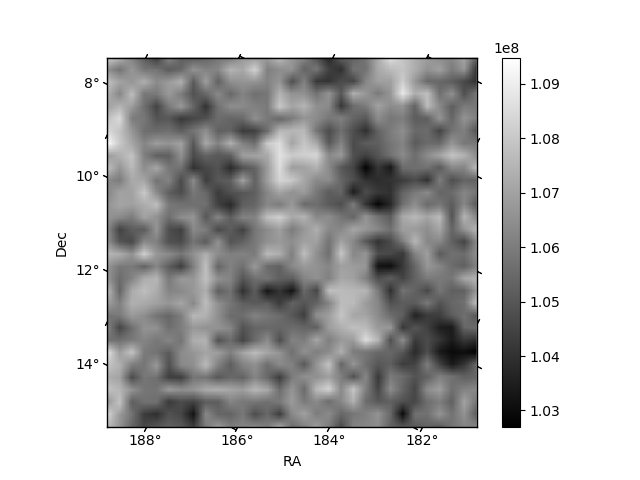
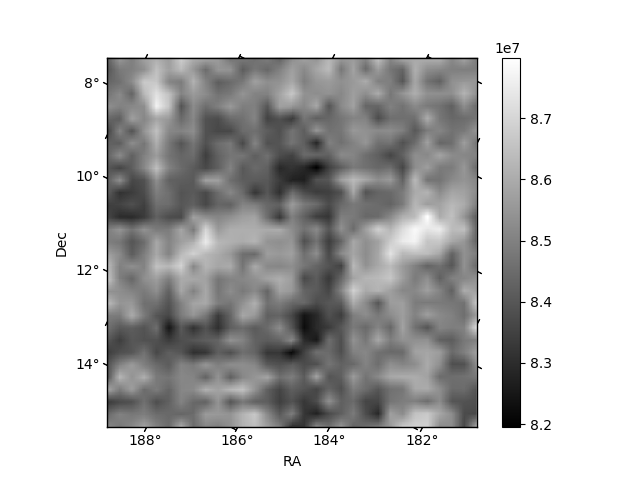
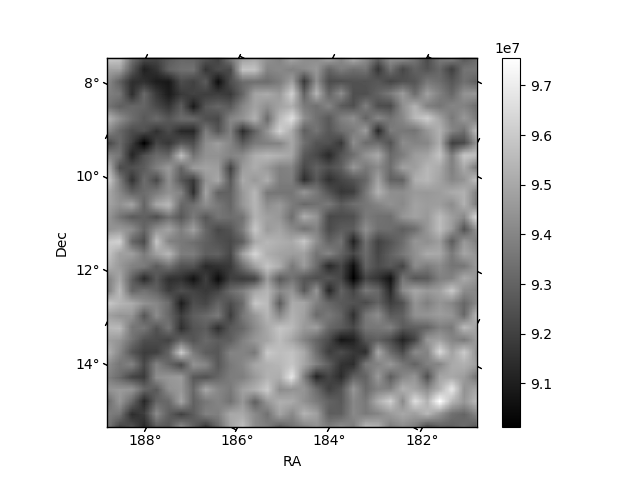
Histogram calculated using DETX and DETY for each event in the final _common_clean file
| Quadrant A | 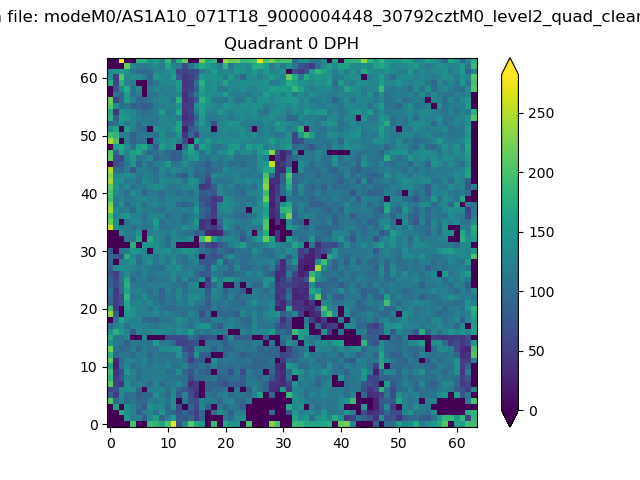 |
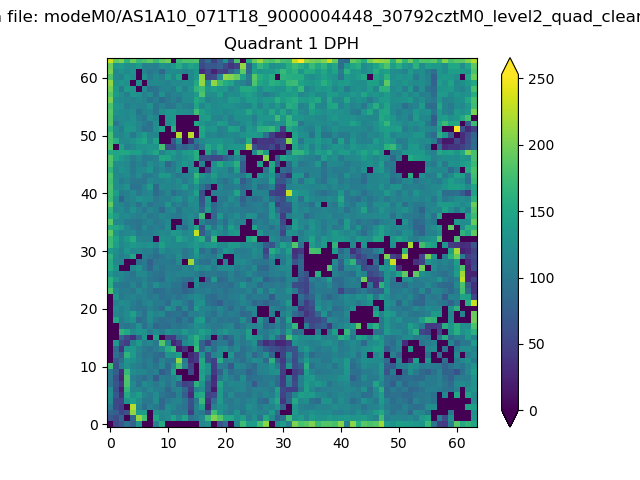 |
Quadrant B |
|---|---|---|---|
| Quadrant D | 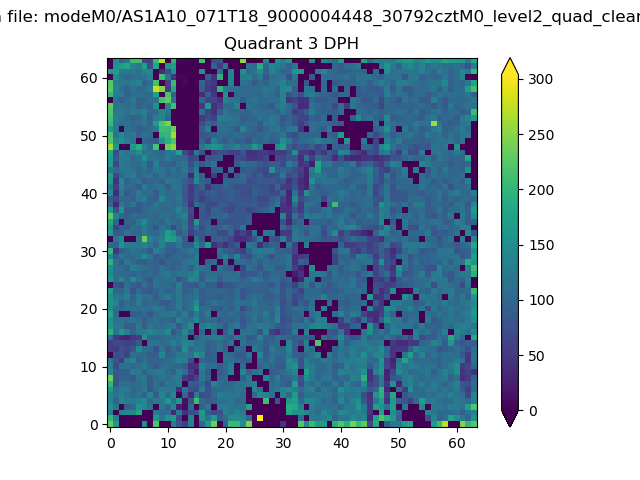 |
 |
Quadrant C |
| Plot type | Count rate plots | Images |
|---|---|---|
| Comparison with Poisson distribution Blue bars denote a histogram of data divided into 1 sec bins. Red curve is a Poisson curve with rate = median count rate of data. |
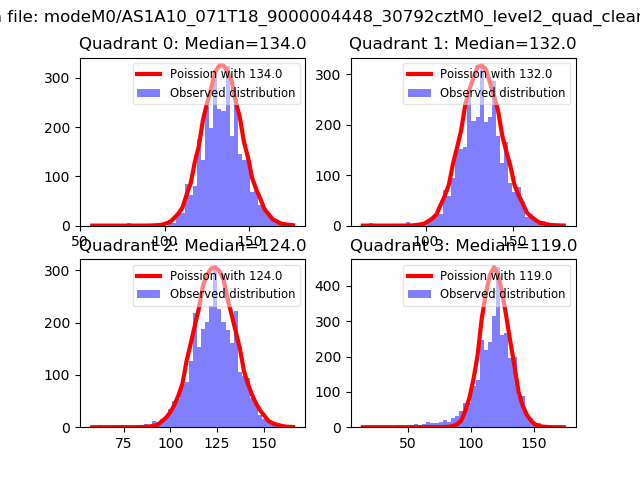 |
 |
| Quadrant-wise count rates Data is divided into 100 sec bins |
 |
|
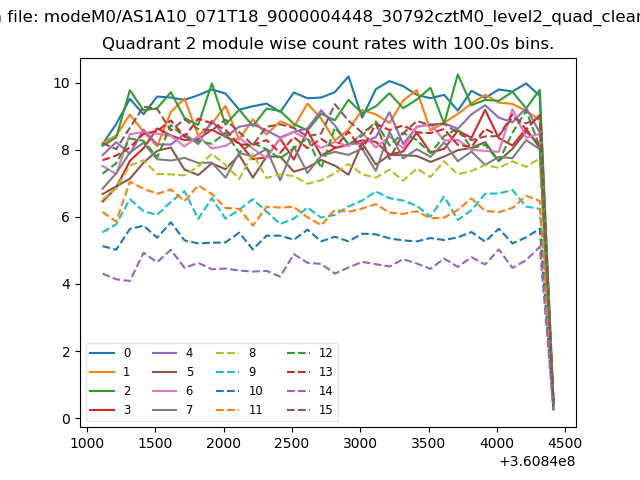
| Module-wise count rates for Quadrant A Data is divided into 100 sec bins |
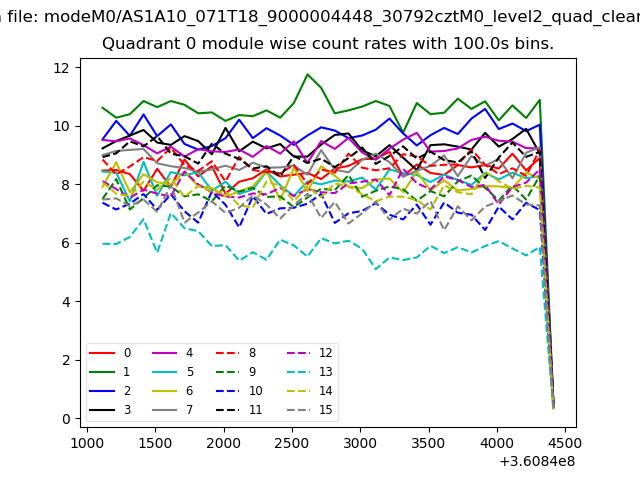 |
 |
| Module-wise count rates for Quadrant B Data is divided into 100 sec bins |
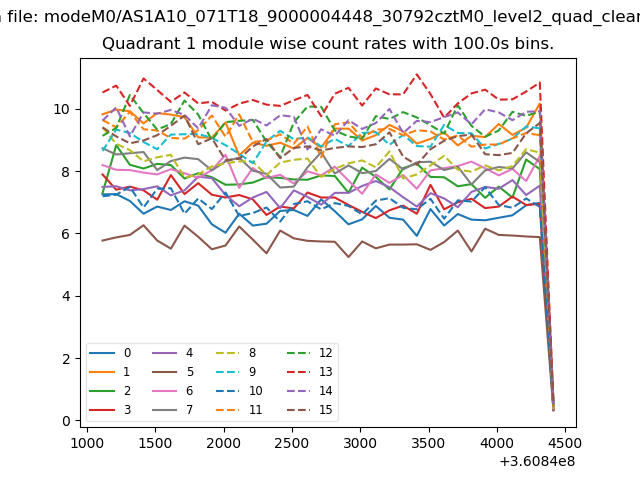 |
 |
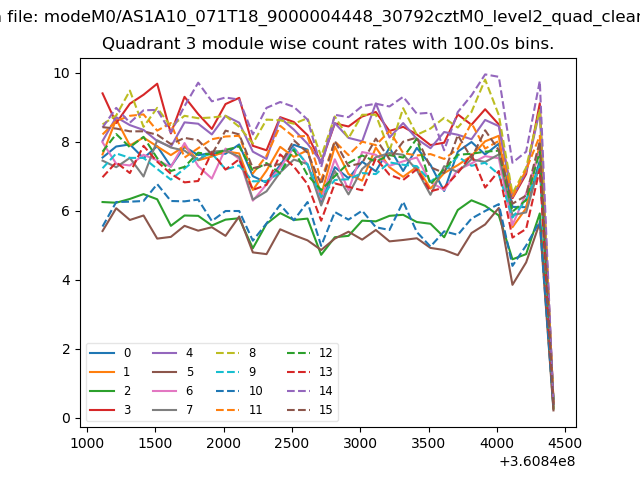
| Module-wise count rates for Quadrant C Data is divided into 100 sec bins |
 |
 |
| Module-wise count rates for Quadrant D Data is divided into 100 sec bins |
 |
 |
| Parameter | Plot |
|---|---|
| CZT HV Monitor | 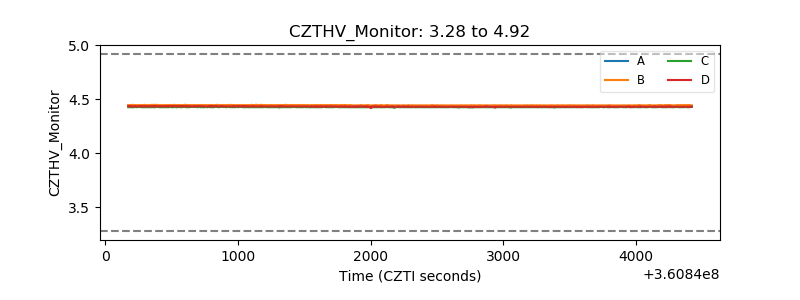 |
| D_VDD | 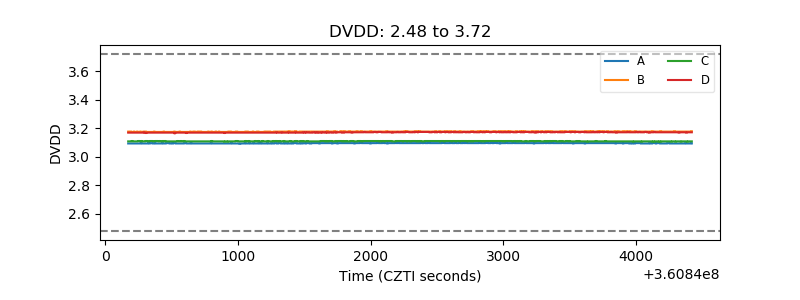 |
| Temperature 1 | 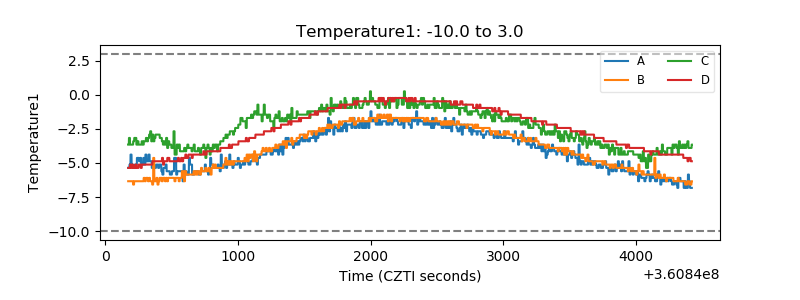 |
| Veto HV Monitor |  |
| Veto LLD | 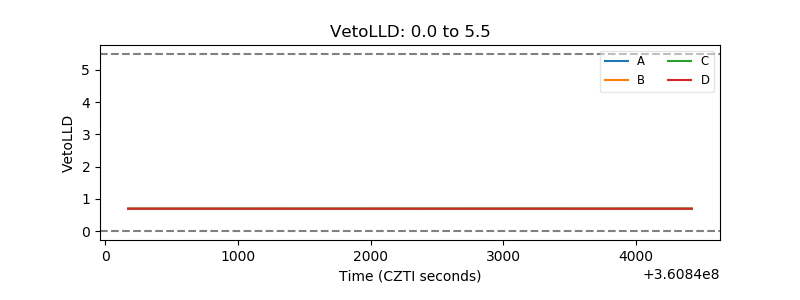 |
| Alpha Counter | 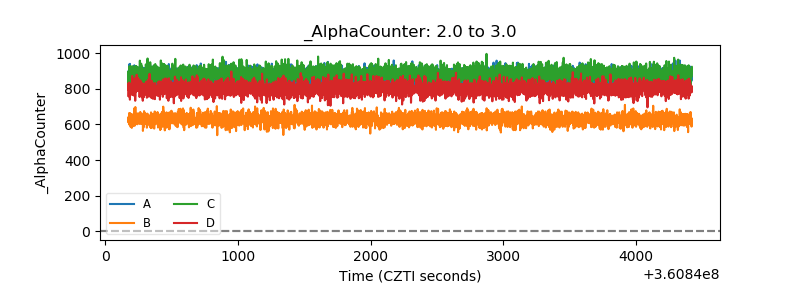 |
| _CPM_Rate | 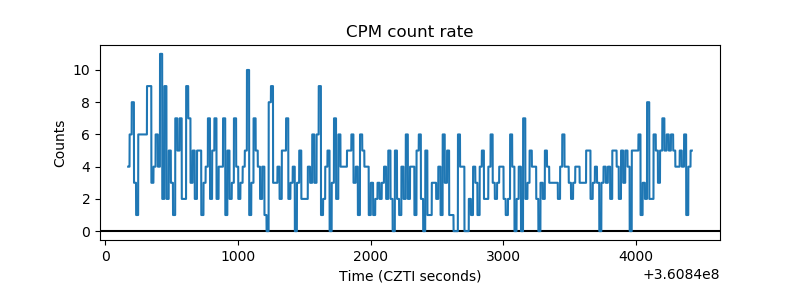 |
| CZT Counter | 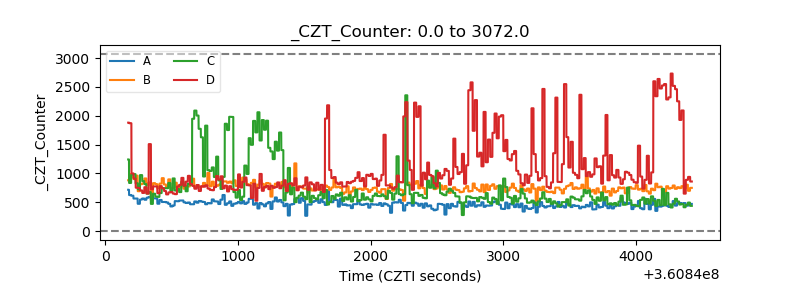 |
| +2.5 Volts monitor |  |
| +5 Volts monitor |  |
| _ROLL_ROT | 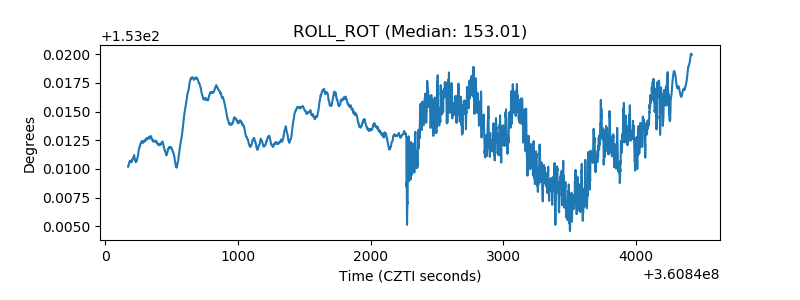 |
| _Roll_DEC | 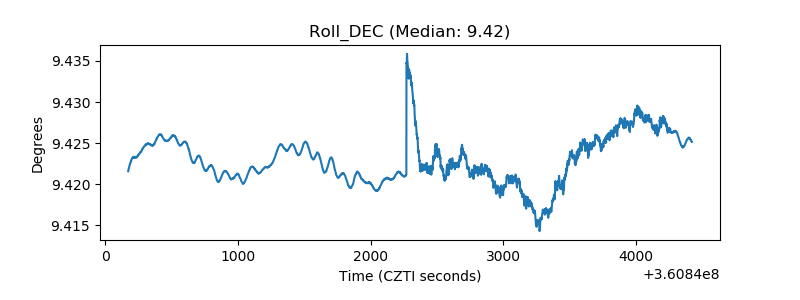 |
| _Roll_RA |  |
| Veto Counter | 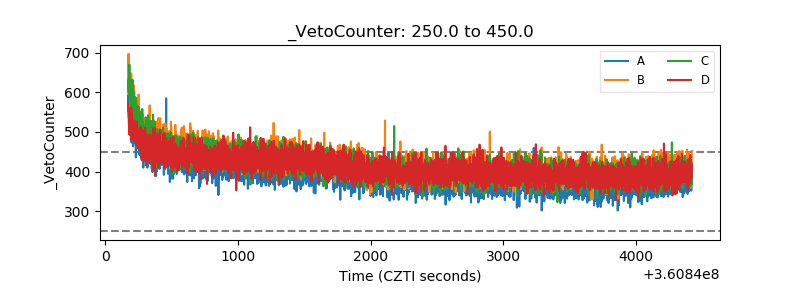 |