| Param | Original file | Final file |
|---|---|---|
| Filename | modeM0/AS1A10_071T25_9000004450cztM0_level2.fits | modeM0/AS1A10_071T25_9000004450cztM0_level2_quad_clean.evt |
| Size (bytes) | 708,482,880 | 540,584,640 |
| Size | 675.7 MB | 515.5 MB |
| Events in quadrant A | 4,528,488 | 3,141,000 |
| Events in quadrant B | 4,207,612 | 3,085,441 |
| Events in quadrant C | 4,231,334 | 2,854,523 |
| Events in quadrant D | 3,673,292 | 2,474,191 |
| Mode M0 | |||
|---|---|---|---|
| Quadrant | BADHDUFLAG | Total packets | Discarded packets |
| A | 0 | 146743 | 0 |
| B | 0 | 215711 | 0 |
| C | 0 | 180628 | 0 |
| D | 0 | 244775 | 0 |
| Mode SS | |||
|---|---|---|---|
| Quadrant | BADHDUFLAG | Total packets | Discarded packets |
| A | 0 | 1428 | 0 |
| B | 0 | 1428 | 0 |
| C | 0 | 1428 | 0 |
| D | 0 | 1428 | 0 |
| Mode M9 | |||
|---|---|---|---|
| Quadrant | BADHDUFLAG | Total packets | Discarded packets |
| A | 0 | 111 | 0 |
| B | 0 | 111 | 0 |
| C | 0 | 111 | 0 |
| D | 0 | 111 | 0 |
| Quadrant | Total seconds | Saturated seconds | Saturation percentage |
|---|---|---|---|
| A | 70199 | 1026 | 1.461559% |
| B | 70199 | 1988 | 2.831949% |
| C | 70199 | 2595 | 3.696634% |
| D | 70199 | 4597 | 6.548526% |
Noise dominated data is calculated using 1-second bins in cleaned event files. If a bin has >2000 counts, and if more than 50% of those come from <1% of pixels, then it is considered to be noise-dominated and hence unusable.
| Quadrant | # 1 sec bins | Bins with >0 counts | Bins with >2000 counts | High rate bins dominated by noise | Noise dominated (total time) | Noise dominated (detector-on time) | Marked lightcurve |
|---|---|---|---|---|---|---|---|
| A | 81270 | 70187 | 0 | 0 | 0.00% | 0.00% |  |
| B | 81270 | 70184 | 0 | 0 | 0.00% | 0.00% | 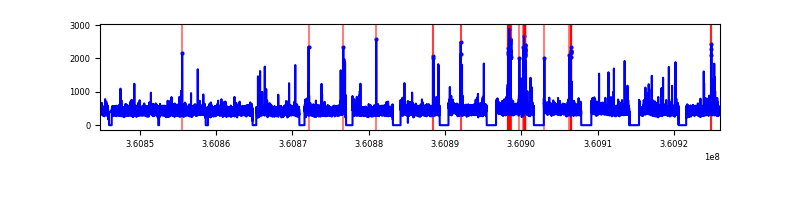 |
| C | 81270 | 70180 | 0 | 0 | 0.00% | 0.00% |  |
| D | 81270 | 70185 | 0 | 0 | 0.00% | 0.00% | 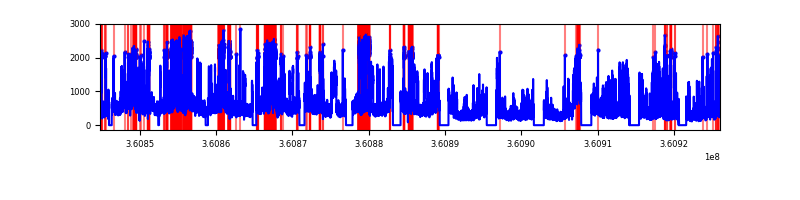 |
Top three noisy pixels from each quadrant. If the there are fewer than three noisy pixels in the level2.evt file, extra rows are filled as -1
| Pixel properties | Quadrant properties | ||||||
|---|---|---|---|---|---|---|---|
| Quadrant | DetID | PixID | Counts | Sigma | Mean | Median | Sigma |
| A | 0 | 29 | 4341 | 11.22 | 1178 | 1106 | 288.4 |
| A | 7 | 110 | 3506 | 8.32 | 1178 | 1106 | 288.4 |
| A | 0 | 30 | 3283 | 7.55 | 1178 | 1106 | 288.4 |
| B | 2 | 9 | 3342 | 10.35 | 1114 | 1065 | 220.0 |
| B | 3 | 80 | 2908 | 8.38 | 1114 | 1065 | 220.0 |
| B | 3 | 17 | 2823 | 7.99 | 1114 | 1065 | 220.0 |
| C | 1 | 81 | 3313 | 7.95 | 1118 | 1045 | 285.3 |
| C | 1 | 80 | 3301 | 7.91 | 1118 | 1045 | 285.3 |
| C | 12 | 241 | 2884 | 6.45 | 1118 | 1045 | 285.3 |
| D | 15 | 46 | 2689 | 6.28 | 1048 | 956 | 275.8 |
| D | 7 | 3 | 2599 | 5.96 | 1048 | 956 | 275.8 |
| D | 10 | 189 | 2589 | 5.92 | 1048 | 956 | 275.8 |
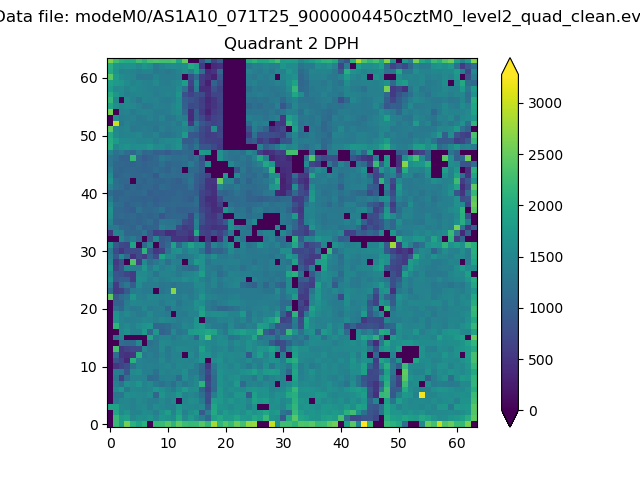
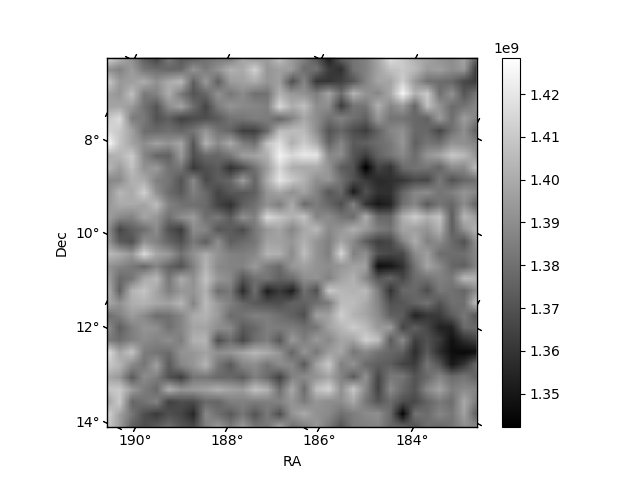
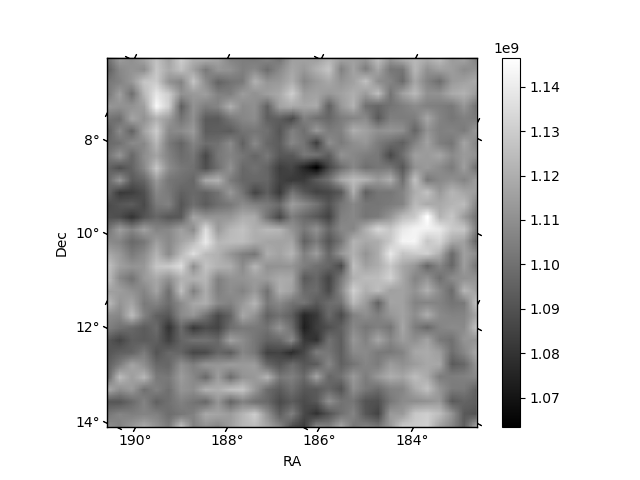
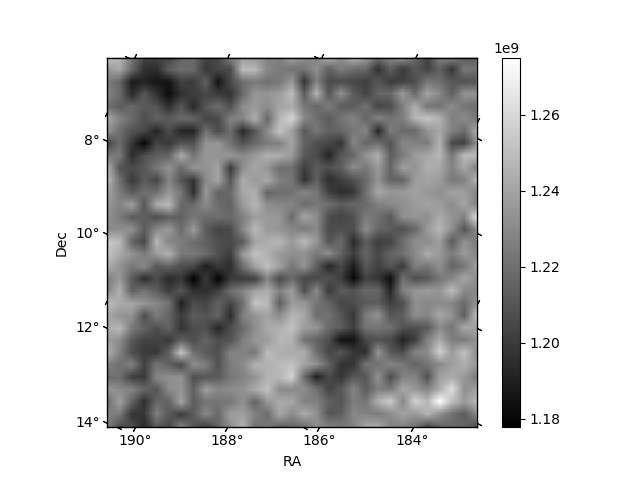
Histogram calculated using DETX and DETY for each event in the final _common_clean file
| Quadrant A | 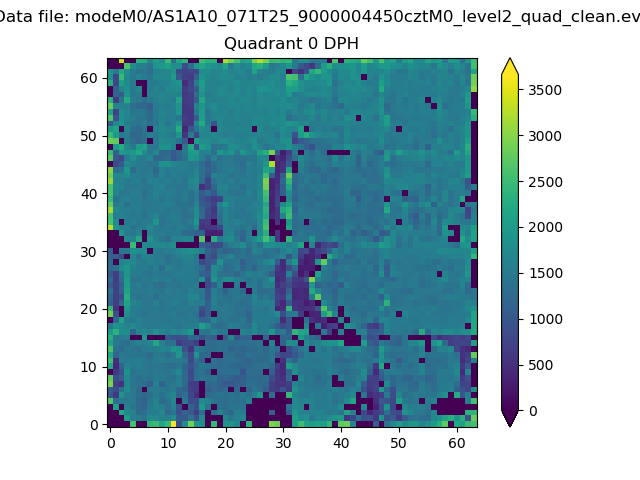 |
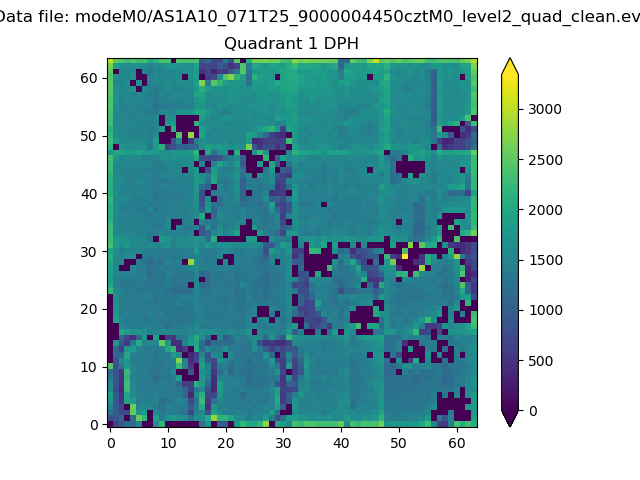 |
Quadrant B |
|---|---|---|---|
| Quadrant D | 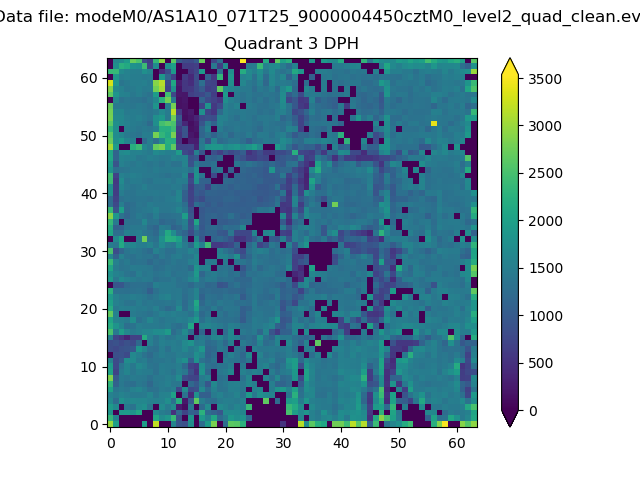 |
 |
Quadrant C |
| Plot type | Count rate plots | Images |
|---|---|---|
| Comparison with Poisson distribution Blue bars denote a histogram of data divided into 1 sec bins. Red curve is a Poisson curve with rate = median count rate of data. |
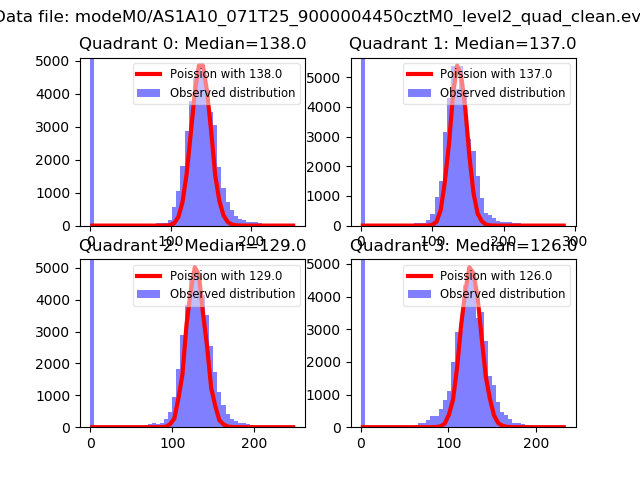 |
 |
| Quadrant-wise count rates Data is divided into 100 sec bins |
 |
|
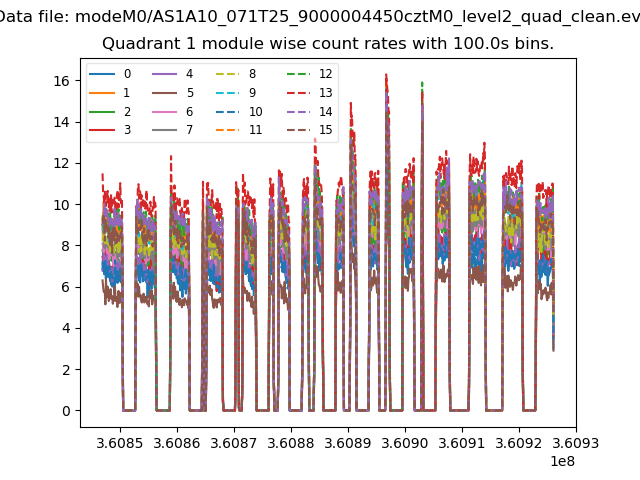
| Module-wise count rates for Quadrant A Data is divided into 100 sec bins |
 |
 |
| Module-wise count rates for Quadrant B Data is divided into 100 sec bins |
 |
 |
| Module-wise count rates for Quadrant C Data is divided into 100 sec bins |
 |
 |
| Module-wise count rates for Quadrant D Data is divided into 100 sec bins |
 |
 |
| Parameter | Plot |
|---|---|
| CZT HV Monitor |  |
| D_VDD | 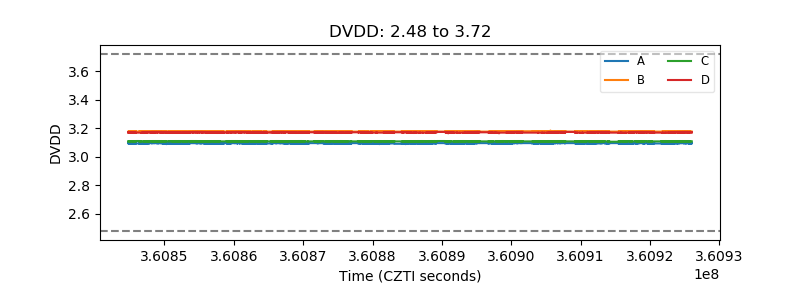 |
| Temperature 1 | 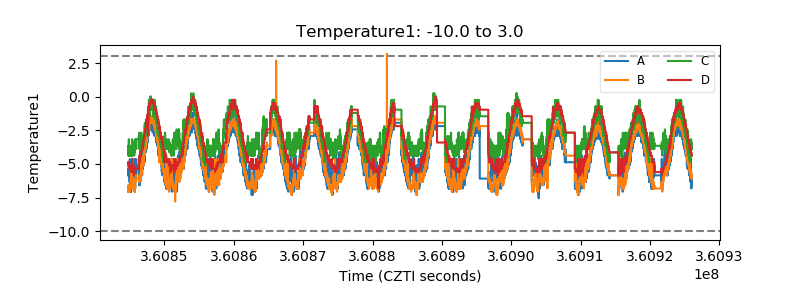 |
| Veto HV Monitor | 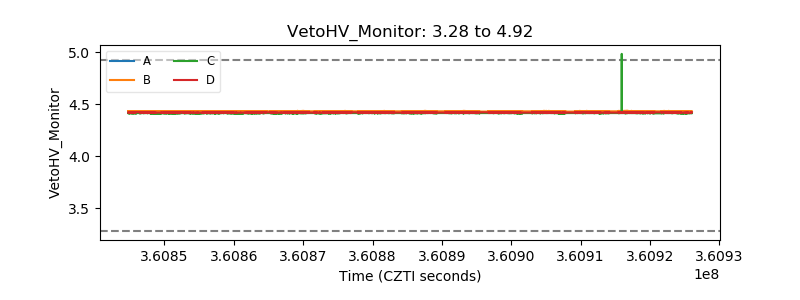 |
| Veto LLD | 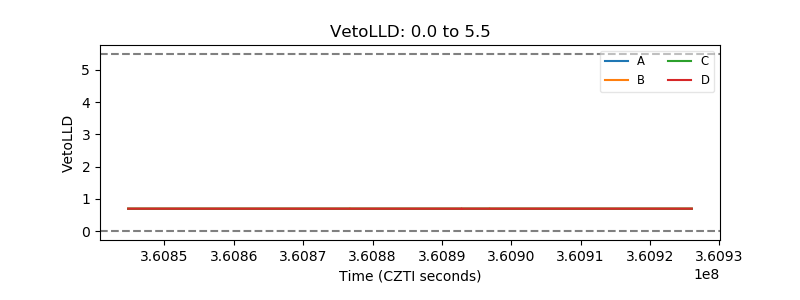 |
| Alpha Counter | 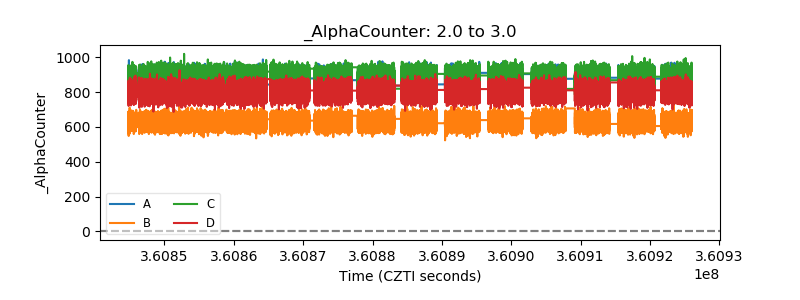 |
| _CPM_Rate | 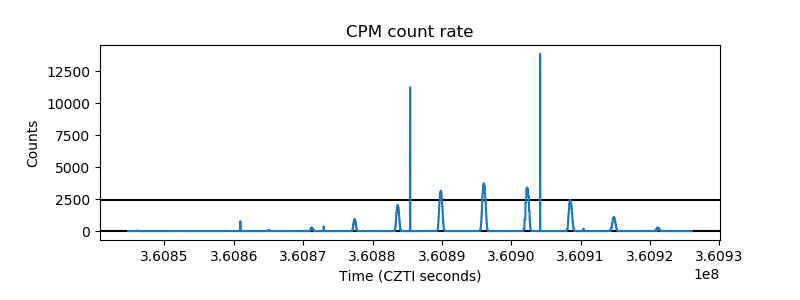 |
| CZT Counter | 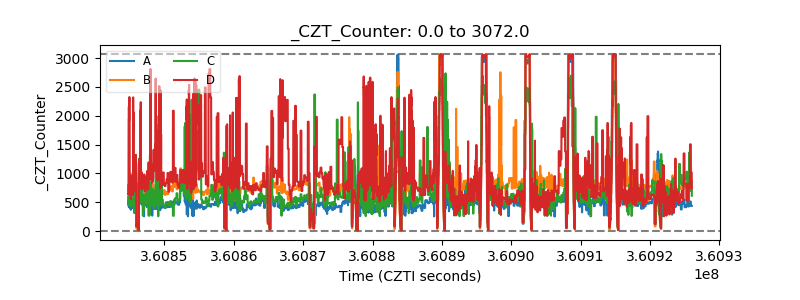 |
| +2.5 Volts monitor | 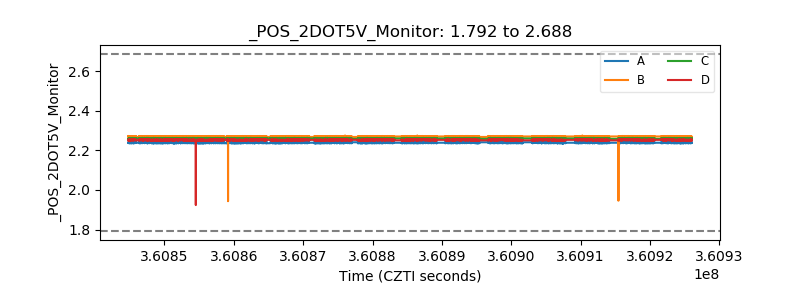 |
| +5 Volts monitor | 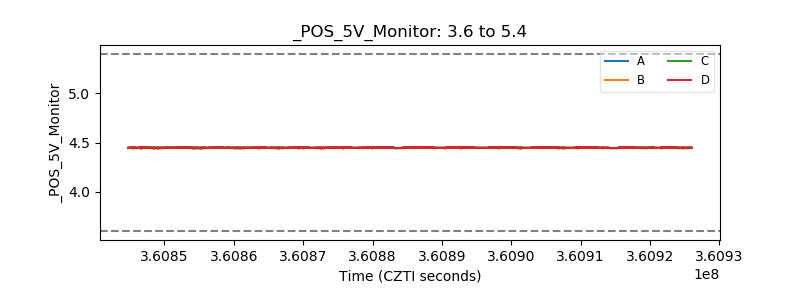 |
| _ROLL_ROT | 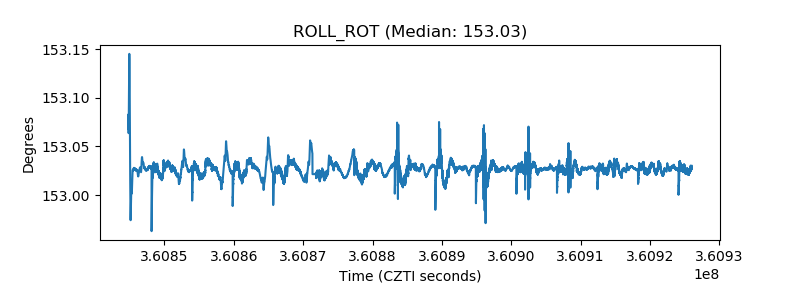 |
| _Roll_DEC | 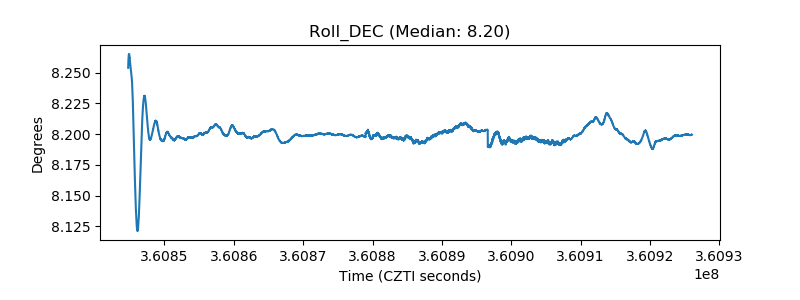 |
| _Roll_RA | 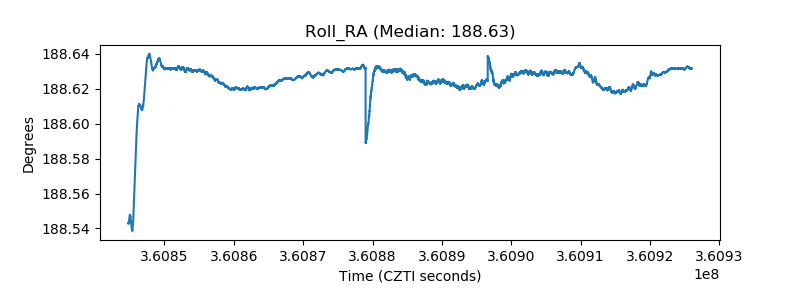 |
| Veto Counter |  |