| Param | Original file | Final file |
|---|---|---|
| Filename | modeM0/AS1A10_071T25_9000004450_30794cztM0_level2.evt | modeM0/AS1A10_071T25_9000004450_30794cztM0_level2_quad_clean.evt |
| Size (bytes) | 730,995,840 | 87,333,120 |
| Size | 697.1 MB | 83.3 MB |
| Events in quadrant A | 3,195,037 | 575,606 |
| Events in quadrant B | 5,077,839 | 569,684 |
| Events in quadrant C | 5,425,948 | 525,872 |
| Events in quadrant D | 7,990,911 | 509,179 |
| Mode M0 | |||
|---|---|---|---|
| Quadrant | BADHDUFLAG | Total packets | Discarded packets |
| A | 0 | 13748 | 1 |
| B | 0 | 20215 | 1 |
| C | 0 | 20742 | 1 |
| D | 0 | 28313 | 1 |
| Mode SS | |||
|---|---|---|---|
| Quadrant | BADHDUFLAG | Total packets | Discarded packets |
| A | 0 | 136 | 0 |
| B | 0 | 136 | 0 |
| C | 0 | 136 | 0 |
| D | 0 | 136 | 0 |
| Mode M9 | |||
|---|---|---|---|
| Quadrant | BADHDUFLAG | Total packets | Discarded packets |
| A | 0 | 3 | 0 |
| B | 0 | 3 | 0 |
| C | 0 | 3 | 0 |
| D | 0 | 3 | 0 |
| Quadrant | Total seconds | Saturated seconds | Saturation percentage |
|---|---|---|---|
| A | 6648 | 109 | 1.639591% |
| B | 6649 | 181 | 2.722214% |
| C | 6649 | 482 | 7.249210% |
| D | 6649 | 1159 | 17.431193% |
Noise dominated data is calculated using 1-second bins in cleaned event files. If a bin has >2000 counts, and if more than 50% of those come from <1% of pixels, then it is considered to be noise-dominated and hence unusable.
| Quadrant | # 1 sec bins | Bins with >0 counts | Bins with >2000 counts | High rate bins dominated by noise | Noise dominated (total time) | Noise dominated (detector-on time) | Marked lightcurve |
|---|---|---|---|---|---|---|---|
| A | 6953 | 6648 | 0 | 0 | 0.00% | 0.00% | 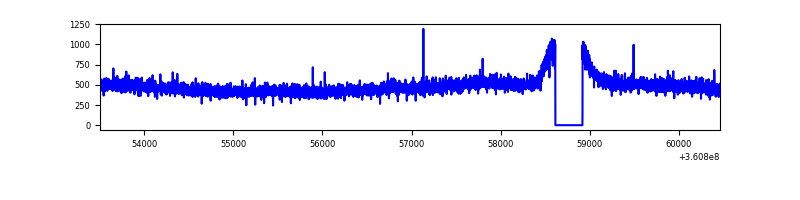 |
| B | 6954 | 6649 | 1 | 1 | 0.01% | 0.02% | 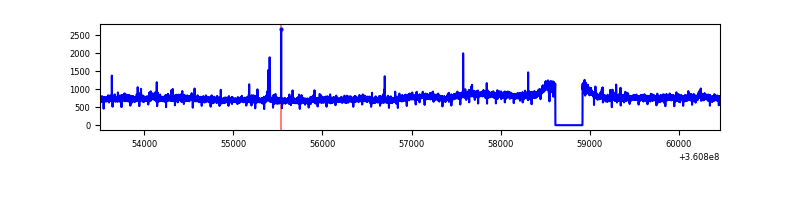 |
| C | 6954 | 6649 | 241 | 241 | 3.47% | 3.62% | 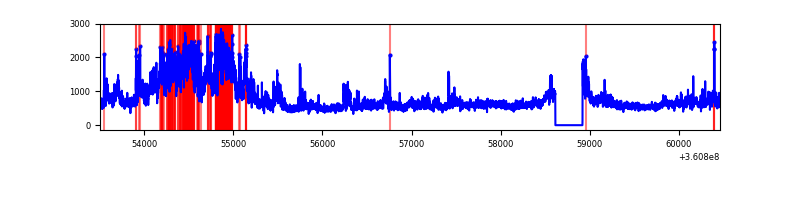 |
| D | 6954 | 6649 | 1109 | 1109 | 15.95% | 16.68% | 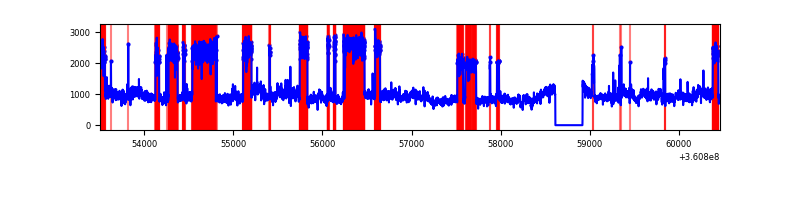 |
Top three noisy pixels from each quadrant. If the there are fewer than three noisy pixels in the level2.evt file, extra rows are filled as -1
| Pixel properties | Quadrant properties | ||||||
|---|---|---|---|---|---|---|---|
| Quadrant | DetID | PixID | Counts | Sigma | Mean | Median | Sigma |
| A | 13 | 254 | 12863 | 71.45 | 828 | 808 | 168.7 |
| A | 3 | 137 | 8555 | 45.92 | 828 | 808 | 168.7 |
| A | 0 | 226 | 7008 | 36.75 | 828 | 808 | 168.7 |
| B | 6 | 159 | 1802868 | 11370.82 | 812 | 791 | 158.5 |
| B | 0 | 190 | 39961 | 247.15 | 812 | 791 | 158.5 |
| B | 12 | 111 | 19482 | 117.93 | 812 | 791 | 158.5 |
| C | 3 | 233 | 2182274 | 11777.23 | 777 | 782 | 185.2 |
| C | 14 | 238 | 124269 | 666.67 | 777 | 782 | 185.2 |
| C | 0 | 10 | 67174 | 358.43 | 777 | 782 | 185.2 |
| D | 8 | 195 | 4942253 | 26041.78 | 775 | 756 | 189.8 |
| D | 2 | 250 | 55907 | 290.65 | 775 | 756 | 189.8 |
| D | 2 | 234 | 33075 | 170.32 | 775 | 756 | 189.8 |
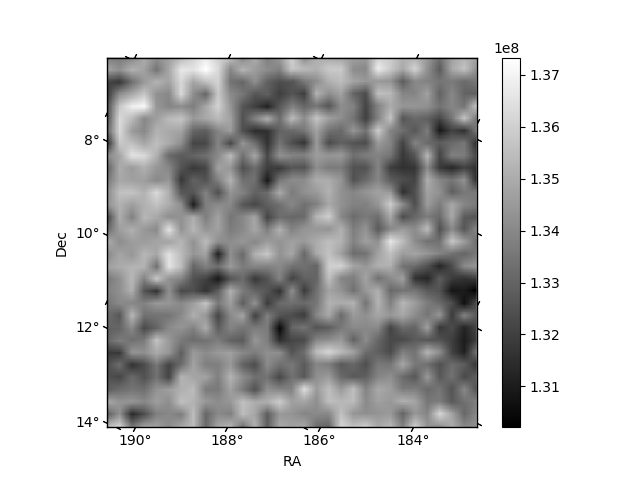
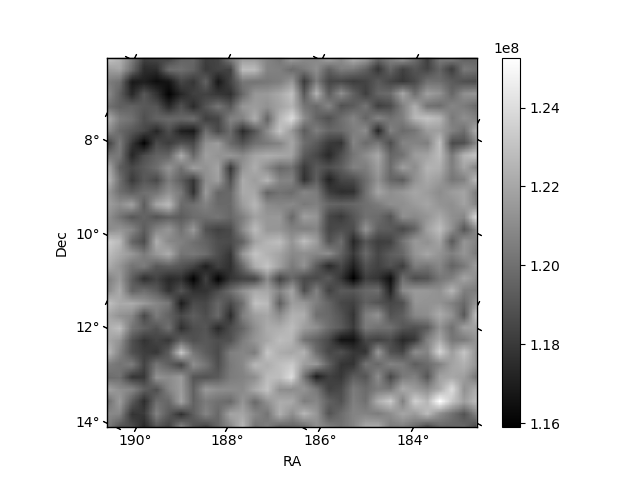
Histogram calculated using DETX and DETY for each event in the final _common_clean file
| Quadrant A | 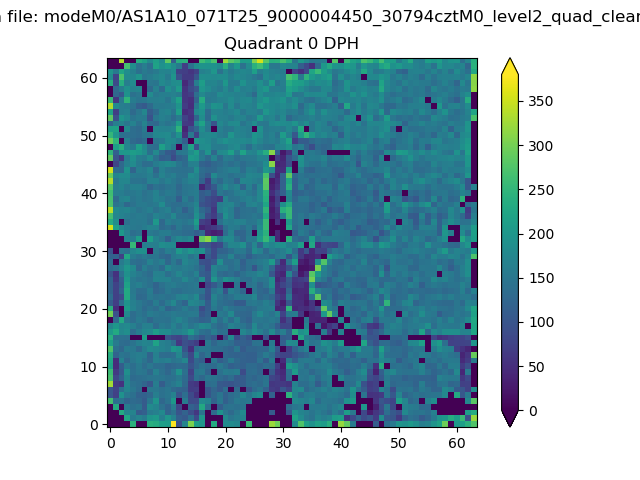 |
 |
Quadrant B |
|---|---|---|---|
| Quadrant D | 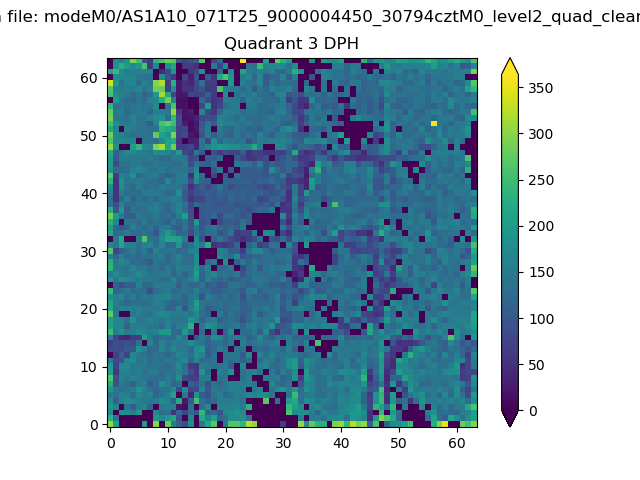 |
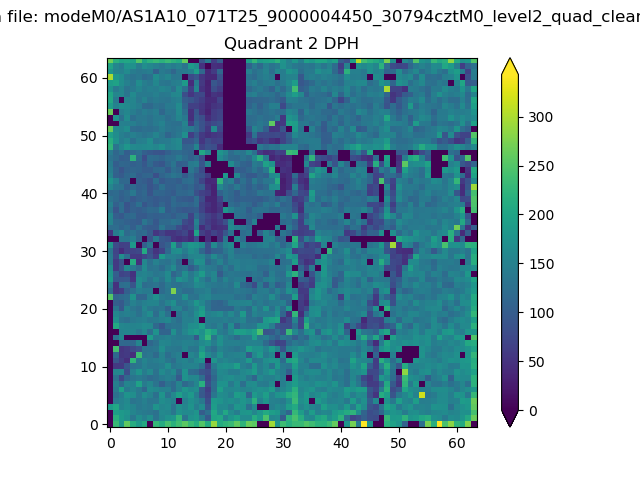 |
Quadrant C |
| Plot type | Count rate plots | Images |
|---|---|---|
| Comparison with Poisson distribution Blue bars denote a histogram of data divided into 1 sec bins. Red curve is a Poisson curve with rate = median count rate of data. |
 |
 |
| Quadrant-wise count rates Data is divided into 100 sec bins |
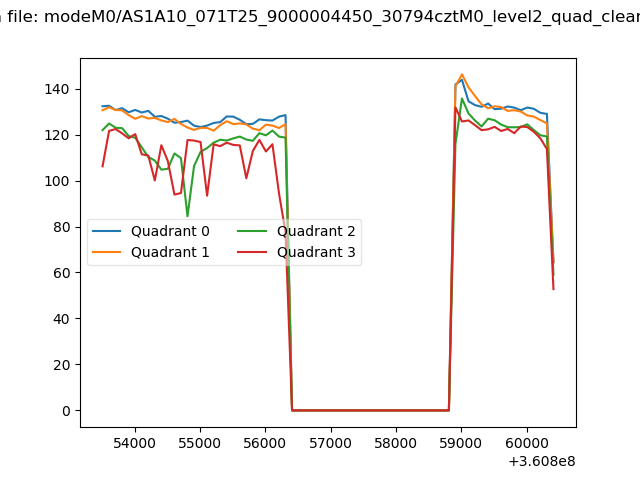 |
|
| Module-wise count rates for Quadrant A Data is divided into 100 sec bins |
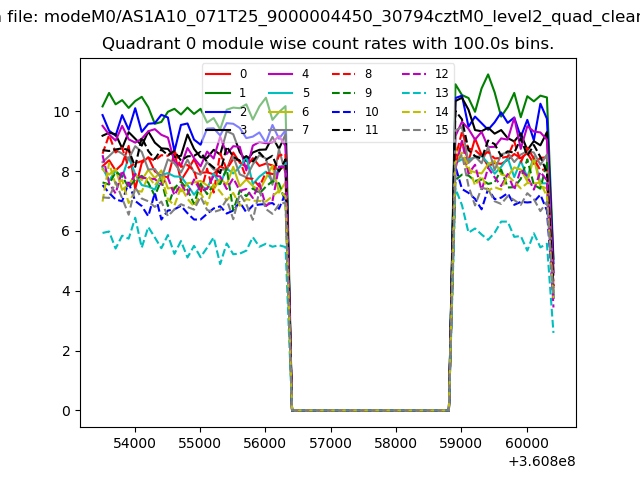 |
 |
| Module-wise count rates for Quadrant B Data is divided into 100 sec bins |
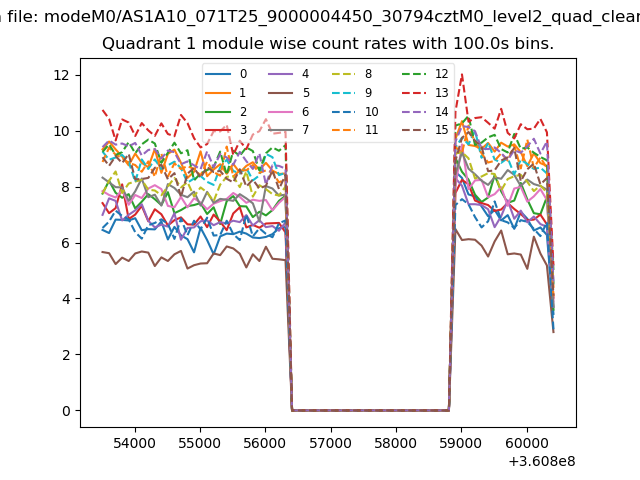 |
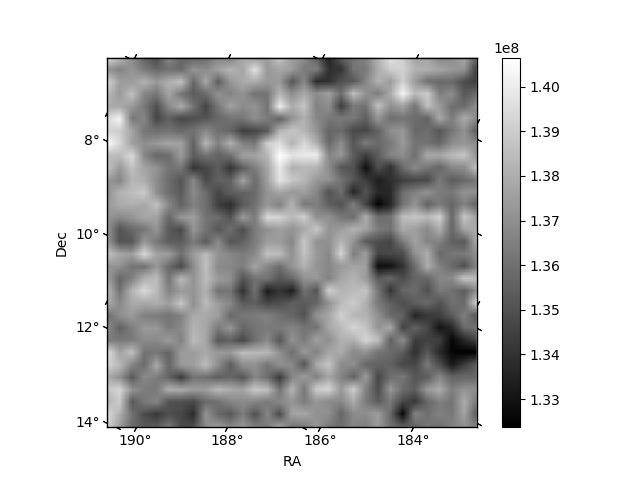 |
| Module-wise count rates for Quadrant C Data is divided into 100 sec bins |
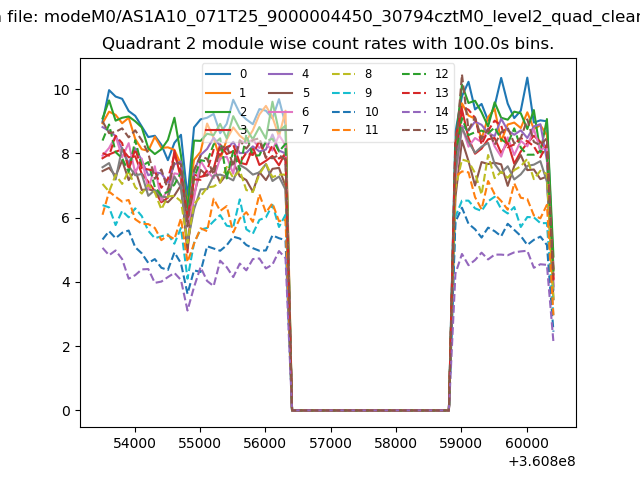 |
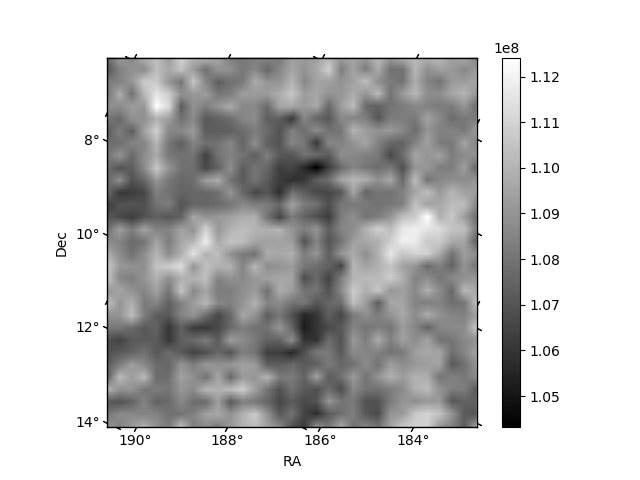 |
| Module-wise count rates for Quadrant D Data is divided into 100 sec bins |
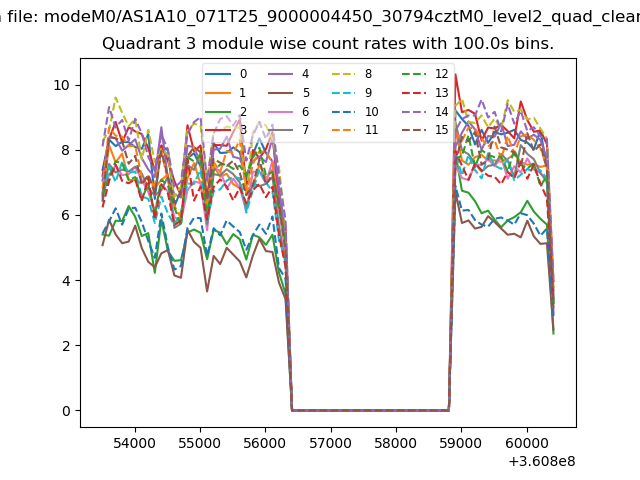 |
 |
| Parameter | Plot |
|---|---|
| CZT HV Monitor | 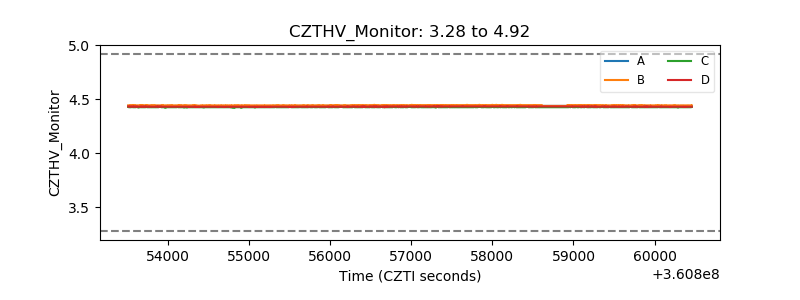 |
| D_VDD | 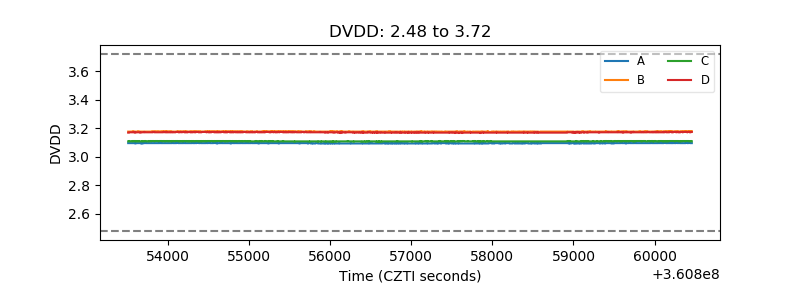 |
| Temperature 1 | 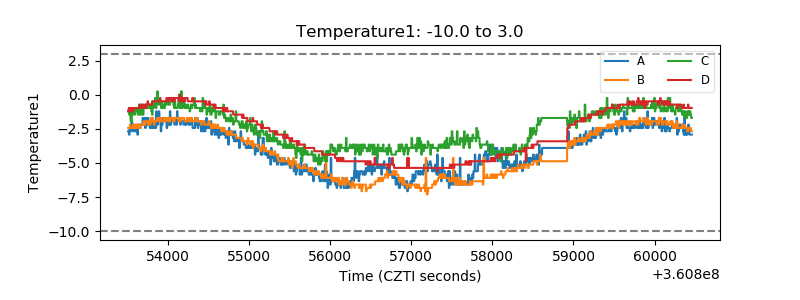 |
| Veto HV Monitor | 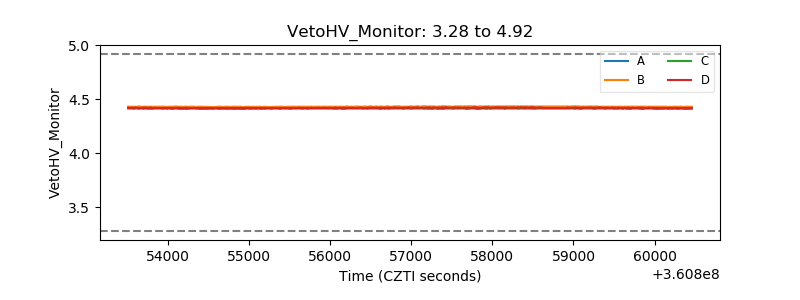 |
| Veto LLD | 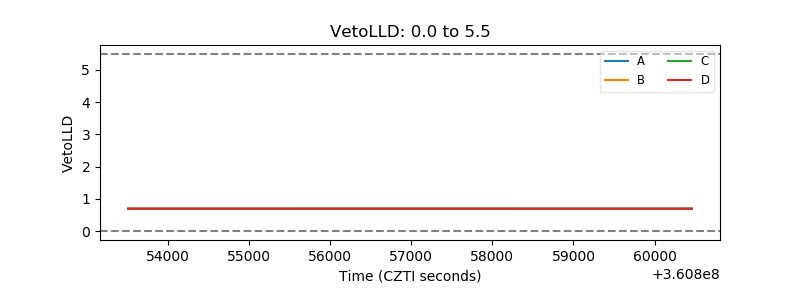 |
| Alpha Counter | 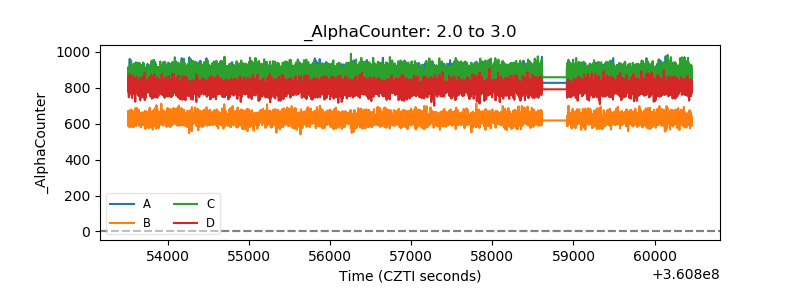 |
| _CPM_Rate | 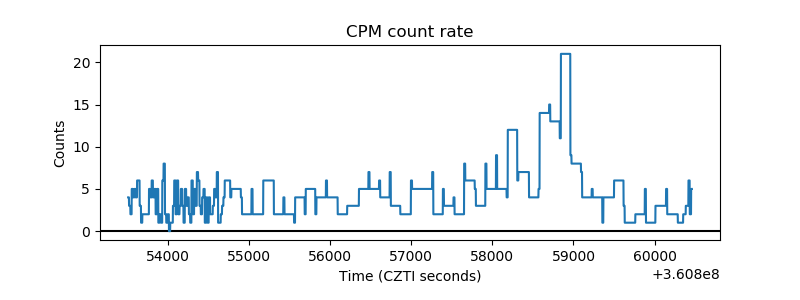 |
| CZT Counter | 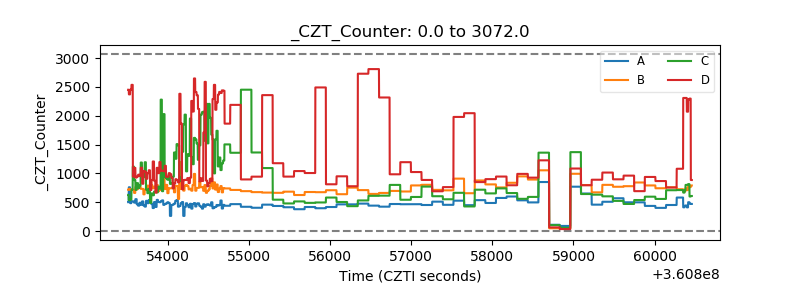 |
| +2.5 Volts monitor |  |
| +5 Volts monitor |  |
| _ROLL_ROT |  |
| _Roll_DEC | 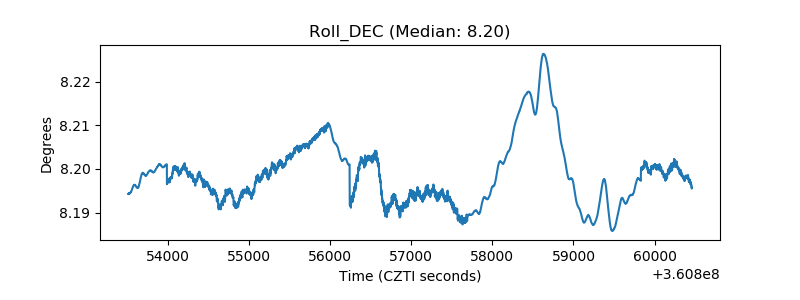 |
| _Roll_RA | 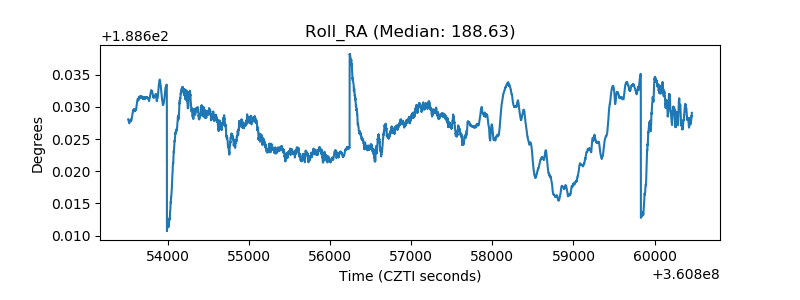 |
| Veto Counter | 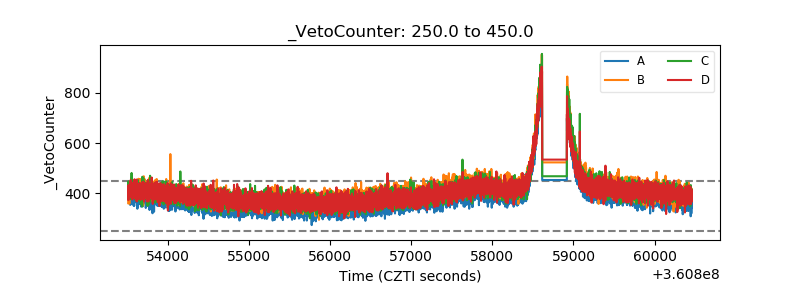 |