| Param | Original file | Final file |
|---|---|---|
| Filename | modeM0/AS1A10_071T25_9000004450_30797cztM0_level2.evt | modeM0/AS1A10_071T25_9000004450_30797cztM0_level2_quad_clean.evt |
| Size (bytes) | 1,789,084,800 | 229,691,520 |
| Size | 1.7 GB | 219.1 MB |
| Events in quadrant A | 8,606,284 | 1,485,913 |
| Events in quadrant B | 13,950,722 | 1,472,954 |
| Events in quadrant C | 10,952,962 | 1,398,451 |
| Events in quadrant D | 19,449,356 | 1,343,360 |
| Mode M0 | |||
|---|---|---|---|
| Quadrant | BADHDUFLAG | Total packets | Discarded packets |
| A | 0 | 37526 | 2 |
| B | 0 | 55380 | 2 |
| C | 0 | 44428 | 2 |
| D | 0 | 70646 | 2 |
| Mode SS | |||
|---|---|---|---|
| Quadrant | BADHDUFLAG | Total packets | Discarded packets |
| A | 0 | 370 | 0 |
| B | 0 | 370 | 0 |
| C | 0 | 370 | 0 |
| D | 0 | 370 | 0 |
| Mode M9 | |||
|---|---|---|---|
| Quadrant | BADHDUFLAG | Total packets | Discarded packets |
| A | 0 | 21 | 0 |
| B | 0 | 21 | 0 |
| C | 0 | 21 | 0 |
| D | 0 | 21 | 0 |
| Quadrant | Total seconds | Saturated seconds | Saturation percentage |
|---|---|---|---|
| A | 18217 | 157 | 0.861832% |
| B | 18217 | 306 | 1.679750% |
| C | 18217 | 508 | 2.788604% |
| D | 18218 | 1313 | 7.207158% |
Noise dominated data is calculated using 1-second bins in cleaned event files. If a bin has >2000 counts, and if more than 50% of those come from <1% of pixels, then it is considered to be noise-dominated and hence unusable.
| Quadrant | # 1 sec bins | Bins with >0 counts | Bins with >2000 counts | High rate bins dominated by noise | Noise dominated (total time) | Noise dominated (detector-on time) | Marked lightcurve |
|---|---|---|---|---|---|---|---|
| A | 20237 | 18217 | 5 | 5 | 0.02% | 0.03% | 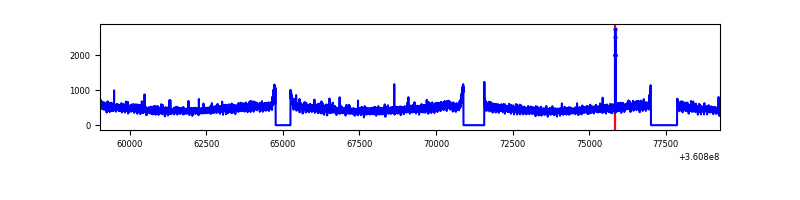 |
| B | 20237 | 18217 | 18 | 18 | 0.09% | 0.10% | 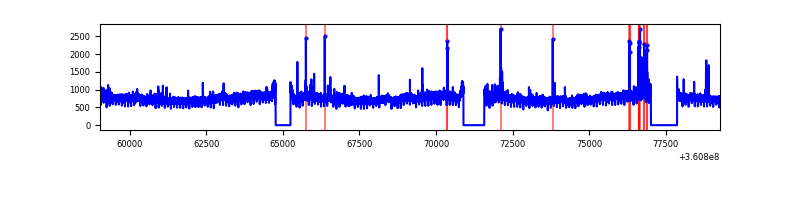 |
| C | 20237 | 18217 | 83 | 83 | 0.41% | 0.46% | 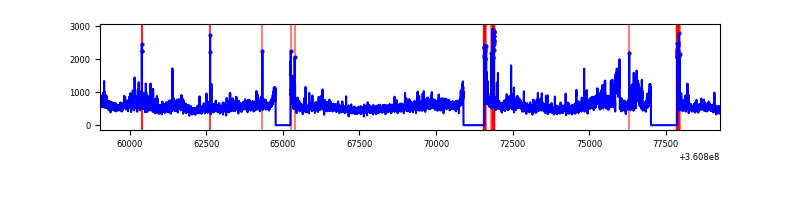 |
| D | 20238 | 18219 | 1620 | 1620 | 8.00% | 8.89% | 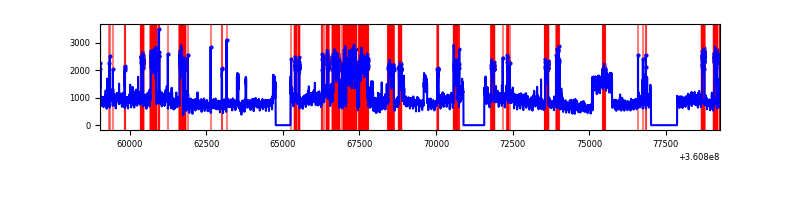 |
Top three noisy pixels from each quadrant. If the there are fewer than three noisy pixels in the level2.evt file, extra rows are filled as -1
| Pixel properties | Quadrant properties | ||||||
|---|---|---|---|---|---|---|---|
| Quadrant | DetID | PixID | Counts | Sigma | Mean | Median | Sigma |
| A | 13 | 254 | 33016 | 69.0 | 2227 | 2182 | 446.9 |
| A | 3 | 137 | 22815 | 46.17 | 2227 | 2182 | 446.9 |
| A | 0 | 226 | 18365 | 36.21 | 2227 | 2182 | 446.9 |
| B | 6 | 159 | 5007950 | 11875.11 | 2192 | 2135 | 421.5 |
| B | 5 | 255 | 121191 | 282.43 | 2192 | 2135 | 421.5 |
| B | 0 | 190 | 61782 | 141.5 | 2192 | 2135 | 421.5 |
| C | 3 | 233 | 1963685 | 3928.44 | 2113 | 2128 | 499.3 |
| C | 0 | 10 | 378128 | 753.02 | 2113 | 2128 | 499.3 |
| C | 14 | 238 | 336717 | 670.09 | 2113 | 2128 | 499.3 |
| D | 8 | 195 | 10983380 | 20601.81 | 2107 | 2060 | 533.0 |
| D | 2 | 250 | 197682 | 367.0 | 2107 | 2060 | 533.0 |
| D | 13 | 174 | 175957 | 326.24 | 2107 | 2060 | 533.0 |
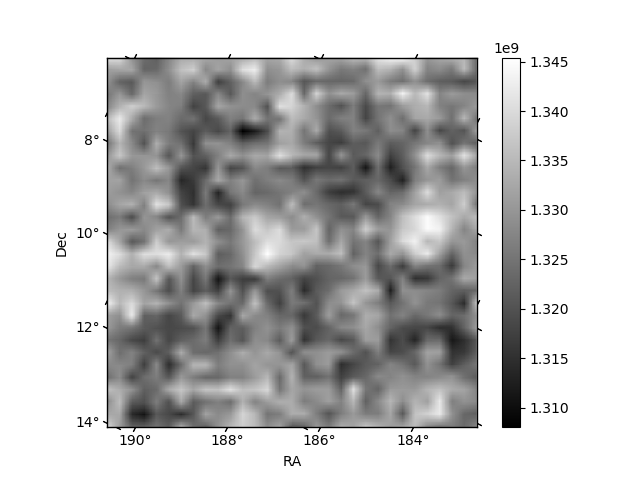
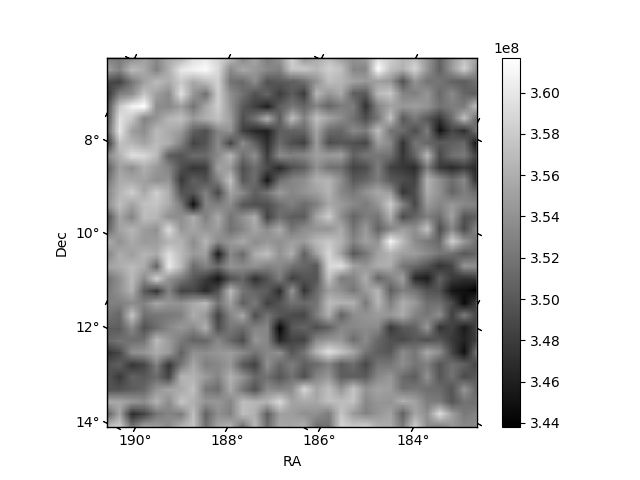
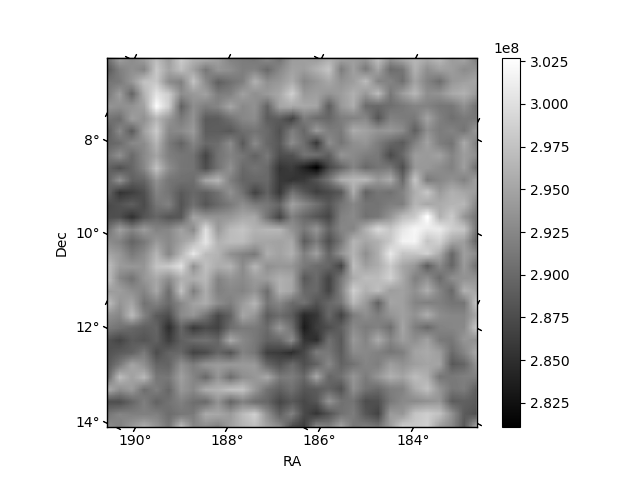
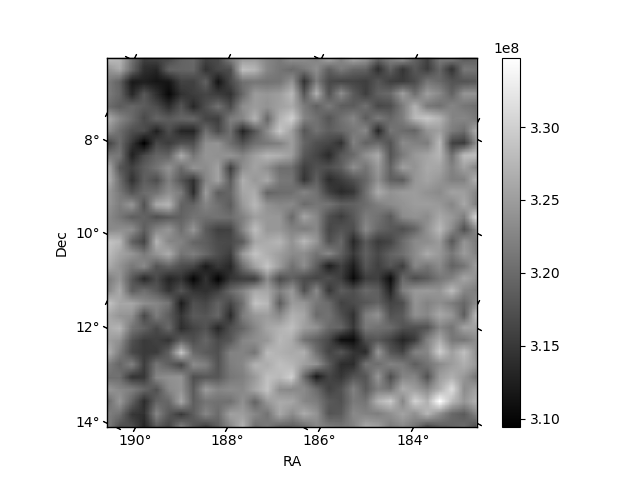
Histogram calculated using DETX and DETY for each event in the final _common_clean file
| Quadrant A | 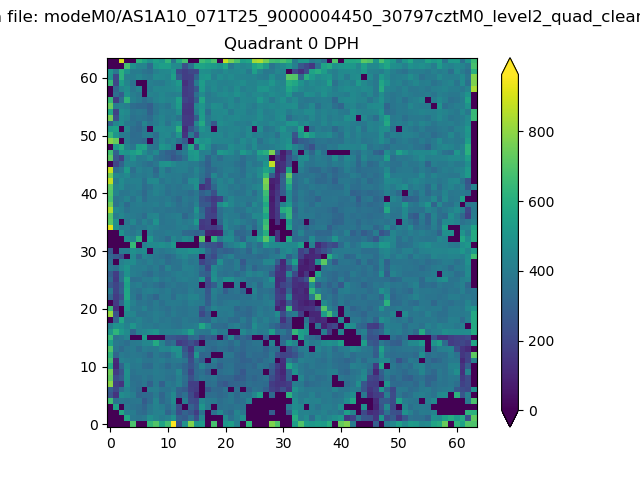 |
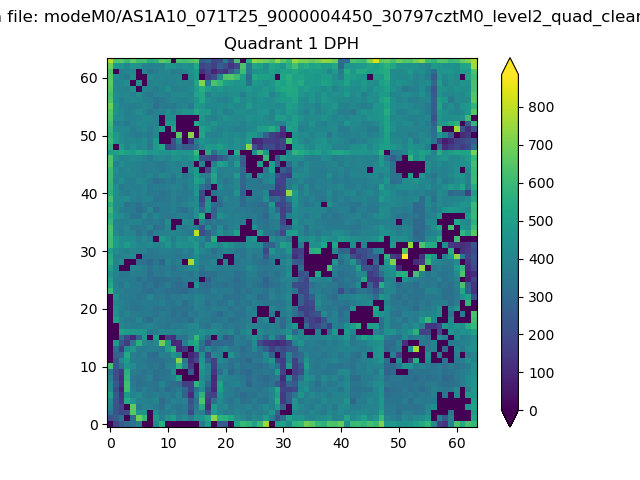 |
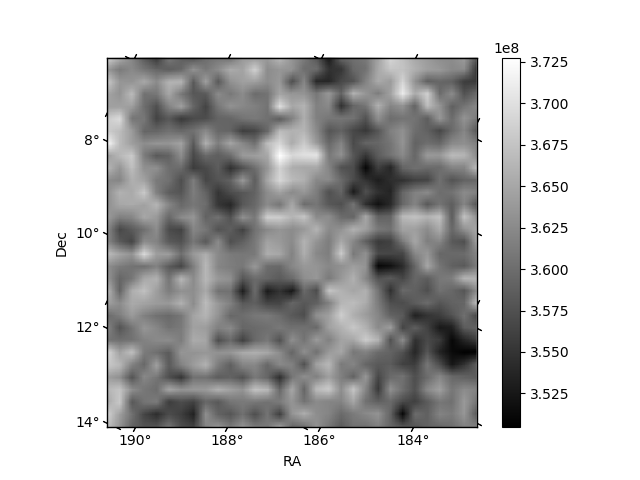
Quadrant B |
|---|---|---|---|
| Quadrant D | 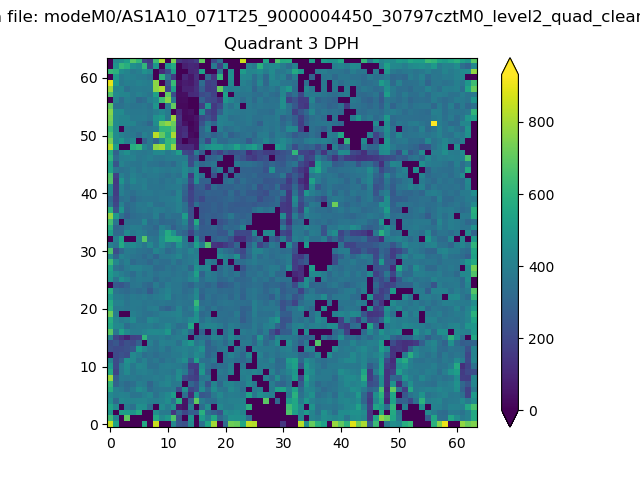 |
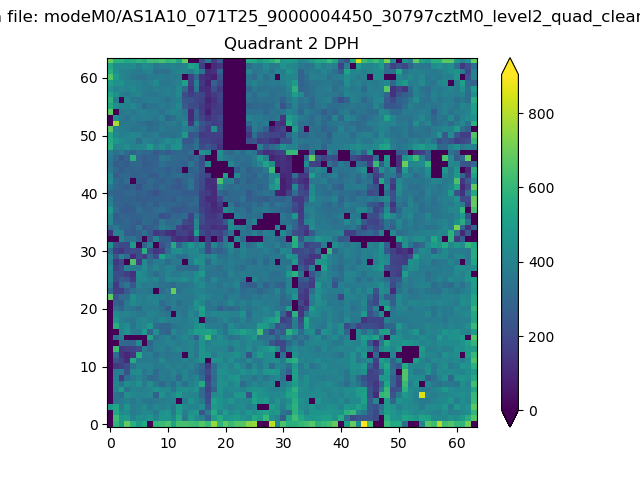 |
Quadrant C |
| Plot type | Count rate plots | Images |
|---|---|---|
| Comparison with Poisson distribution Blue bars denote a histogram of data divided into 1 sec bins. Red curve is a Poisson curve with rate = median count rate of data. |
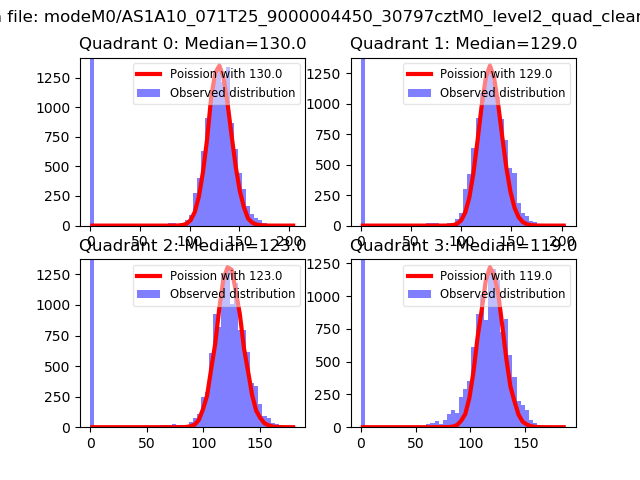 |
 |
| Quadrant-wise count rates Data is divided into 100 sec bins |
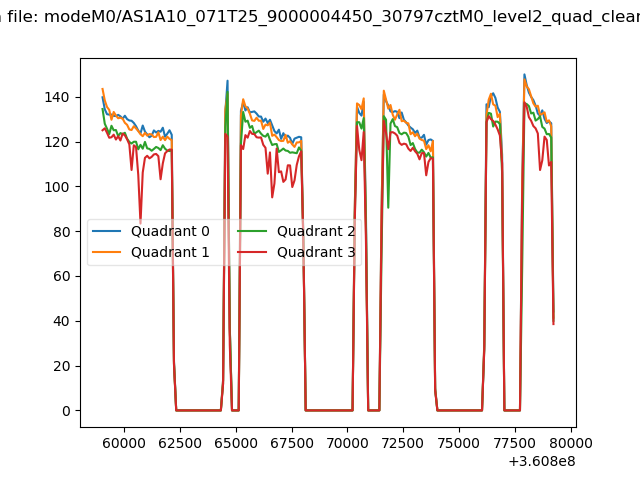 |
|
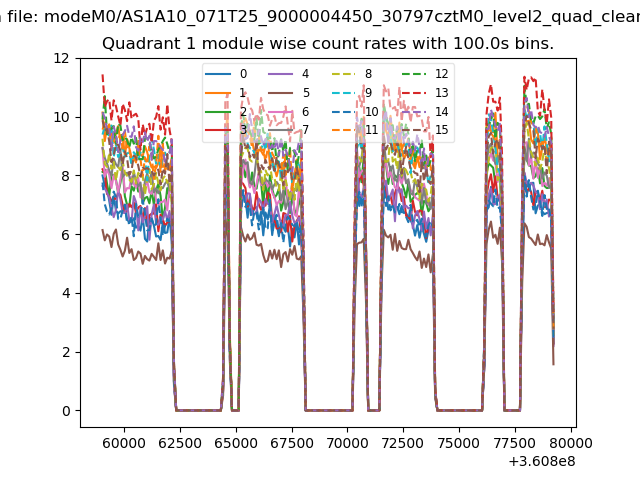
| Module-wise count rates for Quadrant A Data is divided into 100 sec bins |
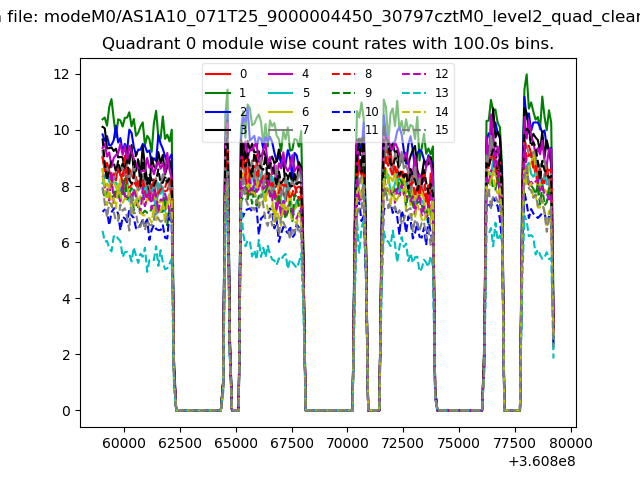 |
 |
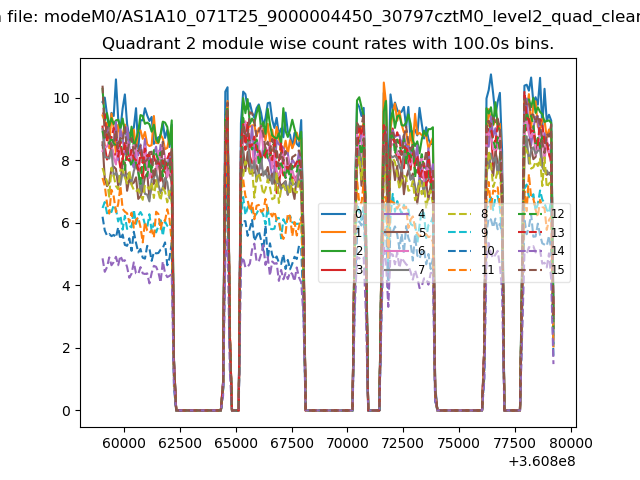
| Module-wise count rates for Quadrant B Data is divided into 100 sec bins |
 |
 |
| Module-wise count rates for Quadrant C Data is divided into 100 sec bins |
 |
 |
| Module-wise count rates for Quadrant D Data is divided into 100 sec bins |
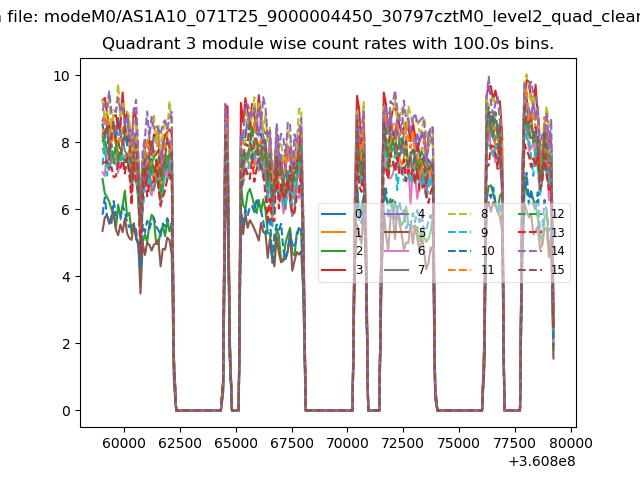 |
 |
| Parameter | Plot |
|---|---|
| CZT HV Monitor | 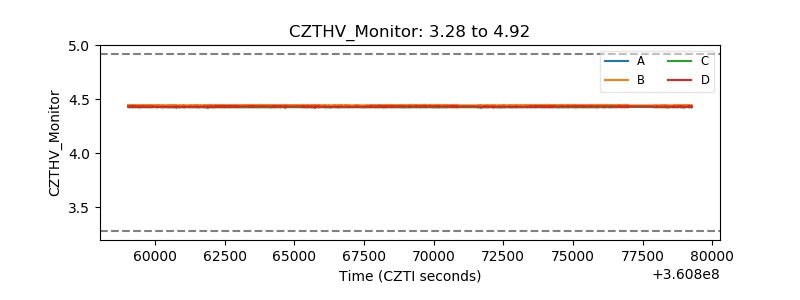 |
| D_VDD | 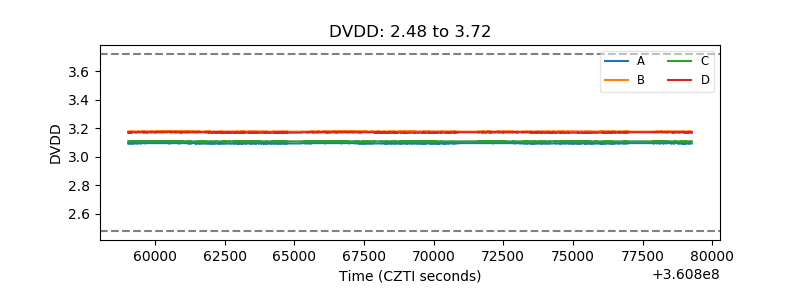 |
| Temperature 1 | 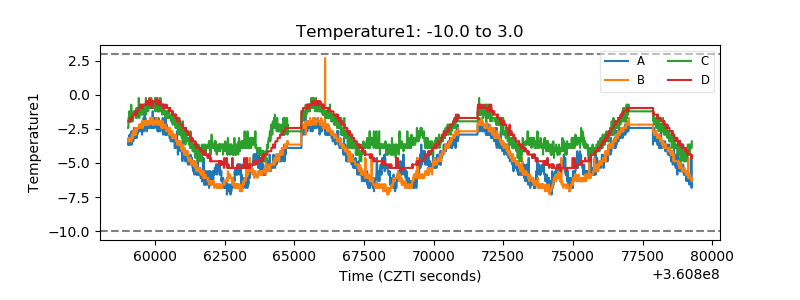 |
| Veto HV Monitor | 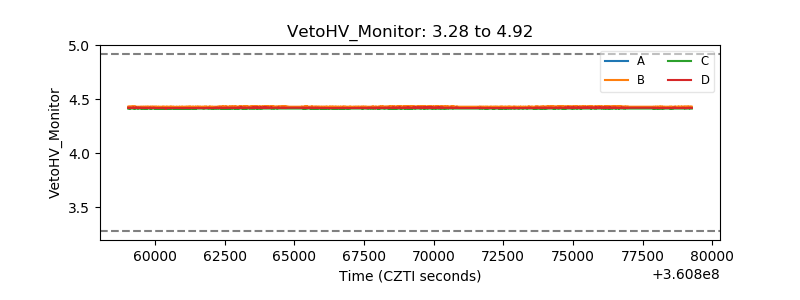 |
| Veto LLD | 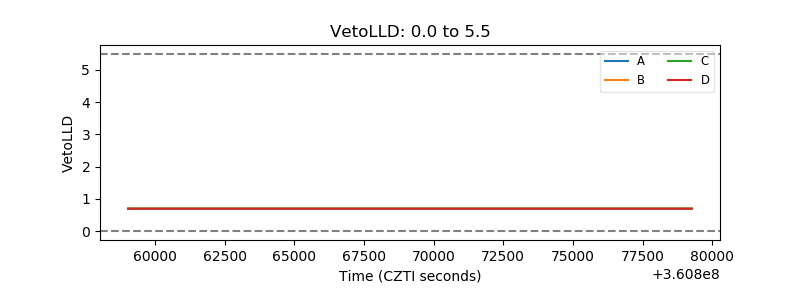 |
| Alpha Counter | 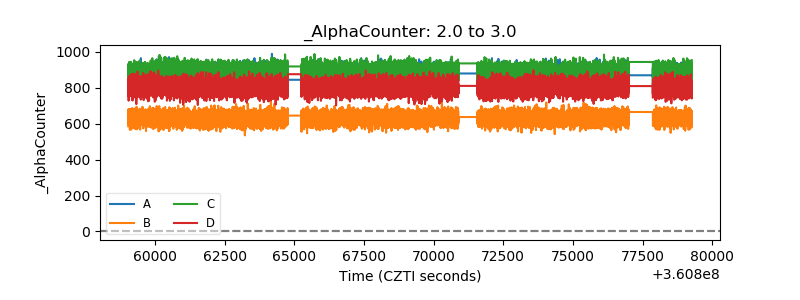 |
| _CPM_Rate | 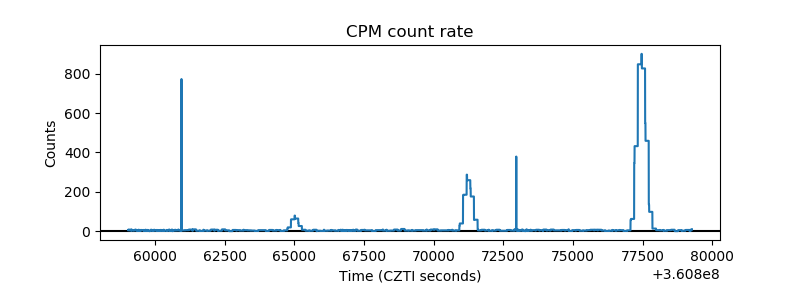 |
| CZT Counter | 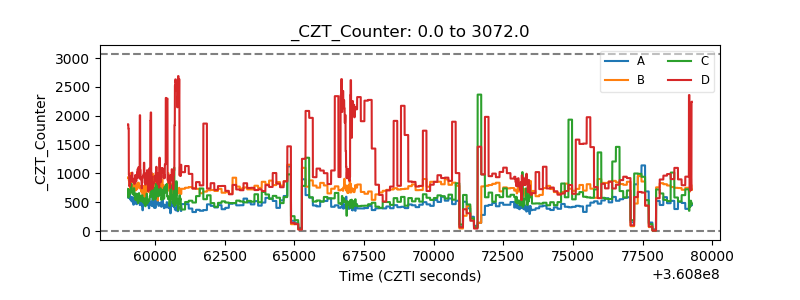 |
| +2.5 Volts monitor |  |
| +5 Volts monitor |  |
| _ROLL_ROT | 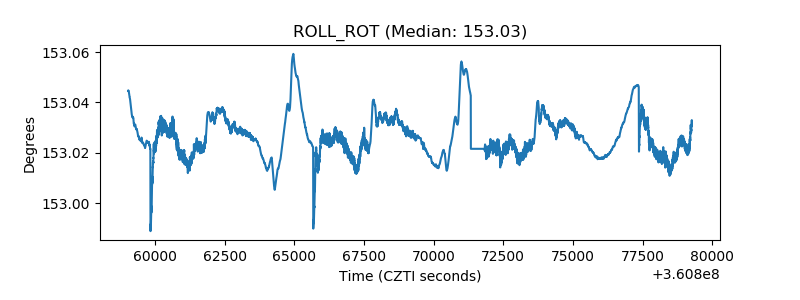 |
| _Roll_DEC | 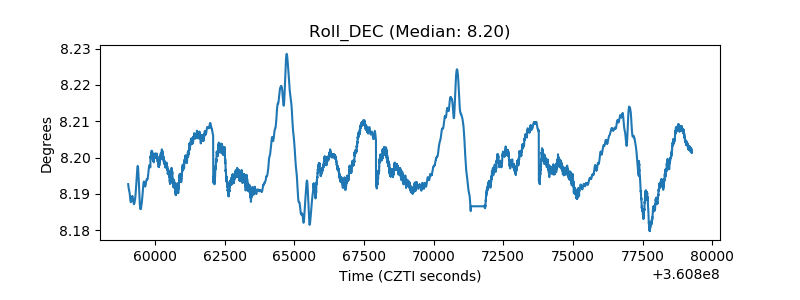 |
| _Roll_RA | 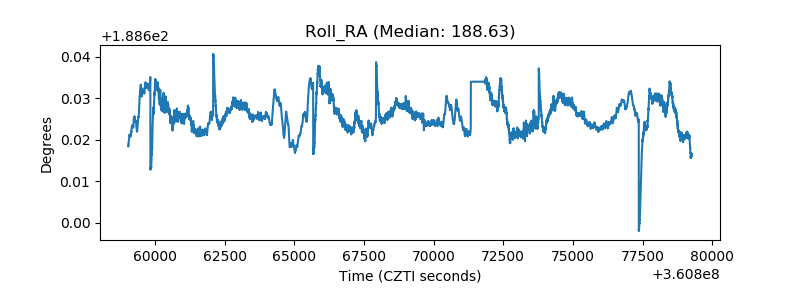 |
| Veto Counter | 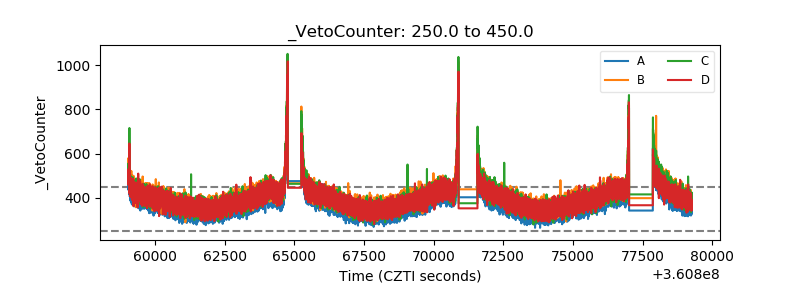 |