| Param | Original file | Final file |
|---|---|---|
| Filename | modeM0/AS1A10_071T25_9000004450_30798cztM0_level2.evt | modeM0/AS1A10_071T25_9000004450_30798cztM0_level2_quad_clean.evt |
| Size (bytes) | 663,272,640 | 94,075,200 |
| Size | 632.5 MB | 89.7 MB |
| Events in quadrant A | 3,217,969 | 620,352 |
| Events in quadrant B | 5,154,832 | 619,478 |
| Events in quadrant C | 4,014,734 | 584,540 |
| Events in quadrant D | 7,244,394 | 554,166 |
| Mode M0 | |||
|---|---|---|---|
| Quadrant | BADHDUFLAG | Total packets | Discarded packets |
| A | 0 | 13873 | 2 |
| B | 0 | 20362 | 2 |
| C | 0 | 16129 | 2 |
| D | 0 | 26233 | 2 |
| Mode SS | |||
|---|---|---|---|
| Quadrant | BADHDUFLAG | Total packets | Discarded packets |
| A | 0 | 138 | 0 |
| B | 0 | 138 | 0 |
| C | 0 | 138 | 0 |
| D | 0 | 138 | 0 |
| Mode M9 | |||
|---|---|---|---|
| Quadrant | BADHDUFLAG | Total packets | Discarded packets |
| A | 0 | 19 | 0 |
| B | 0 | 19 | 0 |
| C | 0 | 19 | 0 |
| D | 0 | 19 | 0 |
| Quadrant | Total seconds | Saturated seconds | Saturation percentage |
|---|---|---|---|
| A | 6747 | 51 | 0.755892% |
| B | 6748 | 88 | 1.304090% |
| C | 6747 | 160 | 2.371424% |
| D | 6747 | 659 | 9.767304% |
Noise dominated data is calculated using 1-second bins in cleaned event files. If a bin has >2000 counts, and if more than 50% of those come from <1% of pixels, then it is considered to be noise-dominated and hence unusable.
| Quadrant | # 1 sec bins | Bins with >0 counts | Bins with >2000 counts | High rate bins dominated by noise | Noise dominated (total time) | Noise dominated (detector-on time) | Marked lightcurve |
|---|---|---|---|---|---|---|---|
| A | 8613 | 6748 | 0 | 0 | 0.00% | 0.00% | 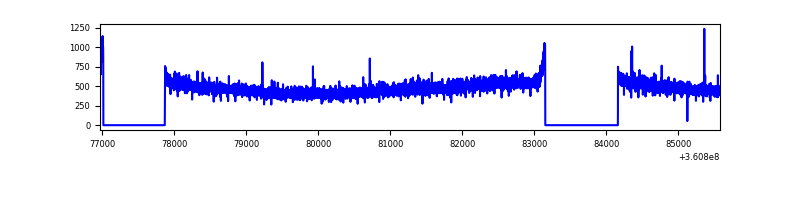 |
| B | 8614 | 6749 | 2 | 2 | 0.02% | 0.03% | 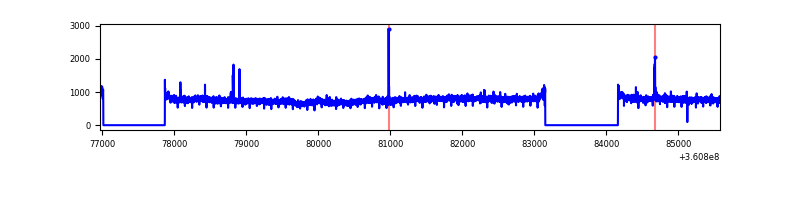 |
| C | 8613 | 6748 | 35 | 35 | 0.41% | 0.52% | 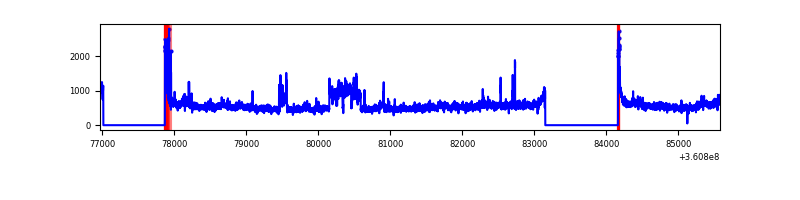 |
| D | 8613 | 6749 | 567 | 567 | 6.58% | 8.40% | 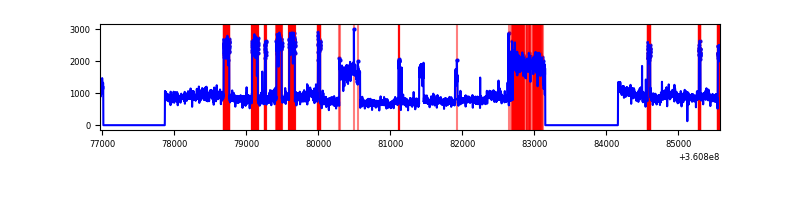 |
Top three noisy pixels from each quadrant. If the there are fewer than three noisy pixels in the level2.evt file, extra rows are filled as -1
| Pixel properties | Quadrant properties | ||||||
|---|---|---|---|---|---|---|---|
| Quadrant | DetID | PixID | Counts | Sigma | Mean | Median | Sigma |
| A | 13 | 254 | 12165 | 67.24 | 833 | 816 | 168.8 |
| A | 3 | 137 | 8483 | 45.42 | 833 | 816 | 168.8 |
| A | 0 | 226 | 6875 | 35.9 | 833 | 816 | 168.8 |
| B | 6 | 159 | 1858796 | 11638.08 | 824 | 804 | 159.6 |
| B | 12 | 111 | 19588 | 117.66 | 824 | 804 | 159.6 |
| B | 11 | 111 | 18058 | 108.08 | 824 | 804 | 159.6 |
| C | 3 | 233 | 654623 | 3466.45 | 792 | 797 | 188.6 |
| C | 0 | 10 | 133485 | 703.48 | 792 | 797 | 188.6 |
| C | 14 | 238 | 125438 | 660.82 | 792 | 797 | 188.6 |
| D | 8 | 195 | 4230063 | 21008.4 | 779 | 761 | 201.3 |
| D | 2 | 250 | 33968 | 164.95 | 779 | 761 | 201.3 |
| D | 2 | 234 | 29654 | 143.52 | 779 | 761 | 201.3 |
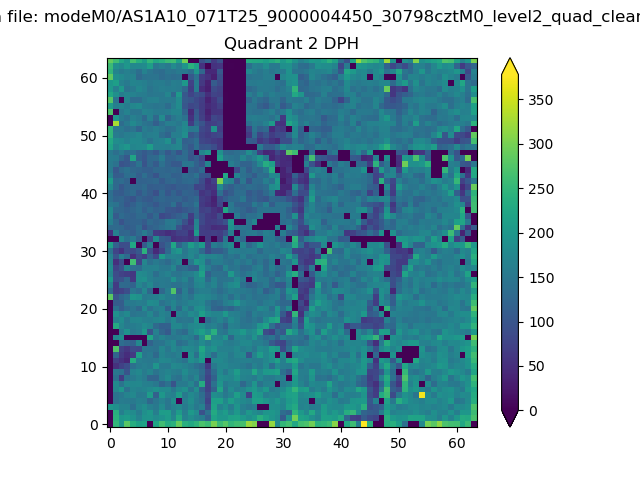
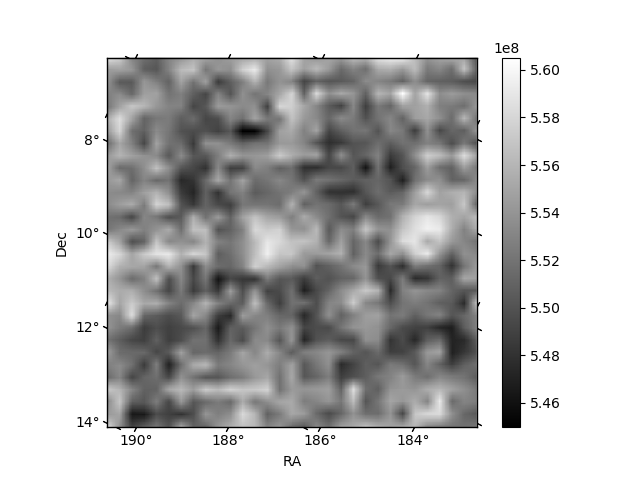
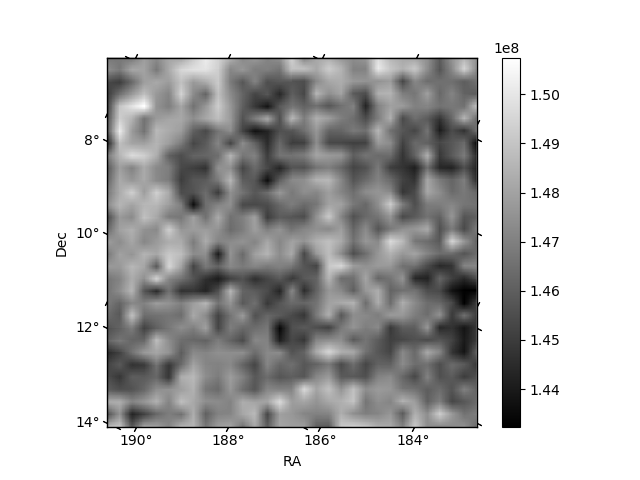
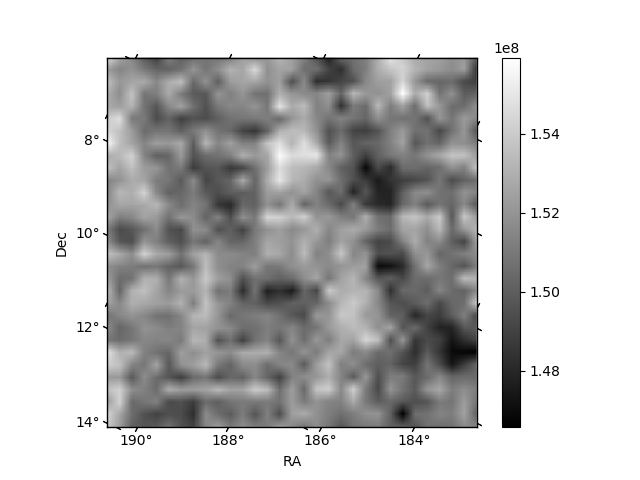
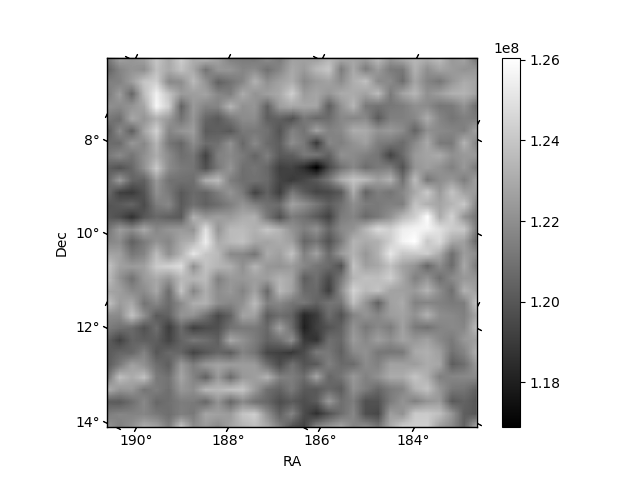
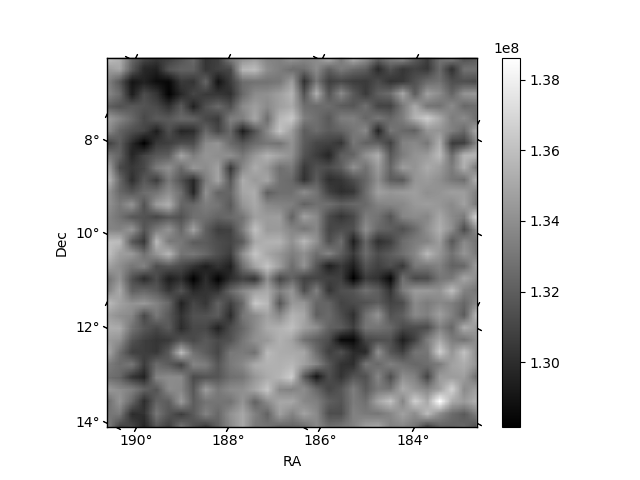
Histogram calculated using DETX and DETY for each event in the final _common_clean file
| Quadrant A | 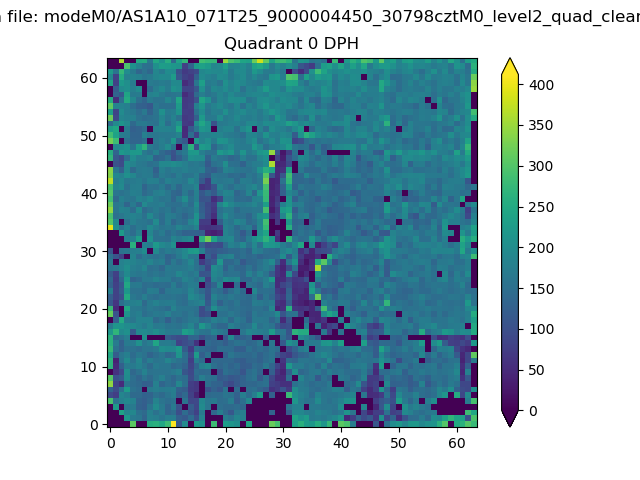 |
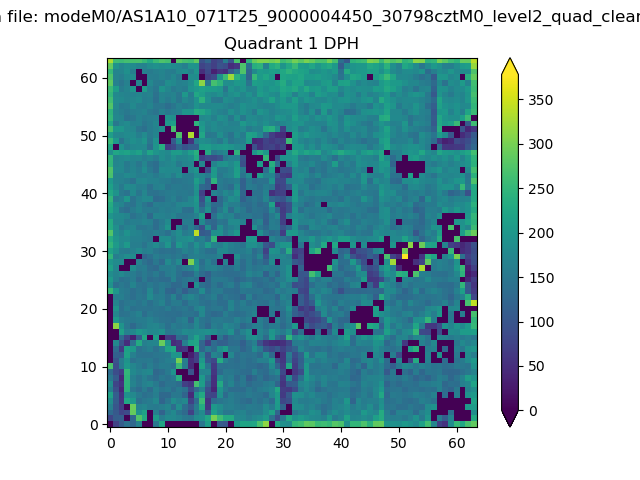 |
Quadrant B |
|---|---|---|---|
| Quadrant D | 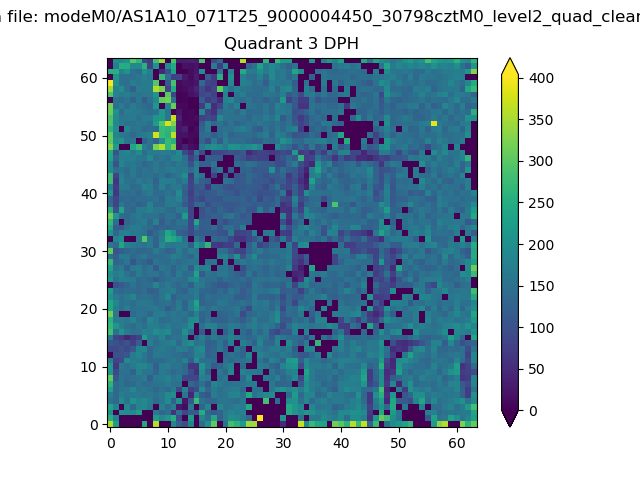 |
 |
Quadrant C |
| Plot type | Count rate plots | Images |
|---|---|---|
| Comparison with Poisson distribution Blue bars denote a histogram of data divided into 1 sec bins. Red curve is a Poisson curve with rate = median count rate of data. |
 |
 |
| Quadrant-wise count rates Data is divided into 100 sec bins |
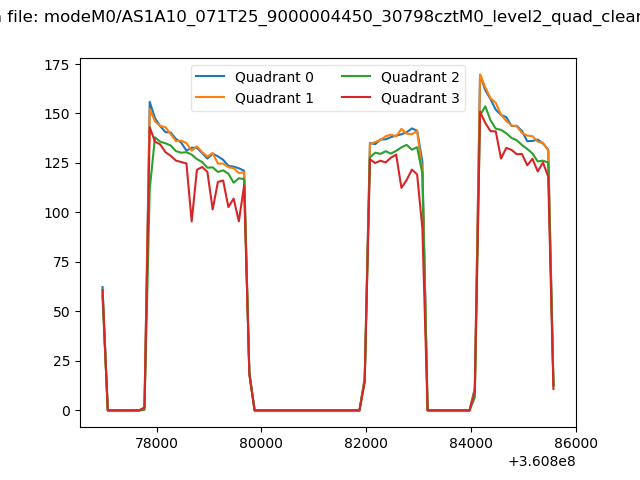 |
|
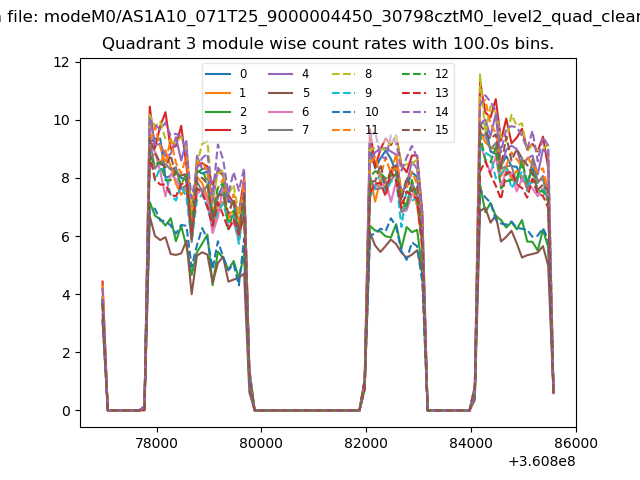
| Module-wise count rates for Quadrant A Data is divided into 100 sec bins |
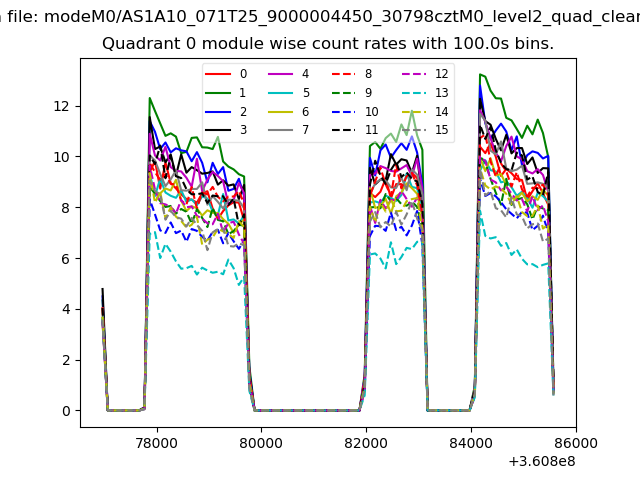 |
 |
| Module-wise count rates for Quadrant B Data is divided into 100 sec bins |
 |
 |
| Module-wise count rates for Quadrant C Data is divided into 100 sec bins |
 |
 |
| Module-wise count rates for Quadrant D Data is divided into 100 sec bins |
 |
 |
| Parameter | Plot |
|---|---|
| CZT HV Monitor |  |
| D_VDD | 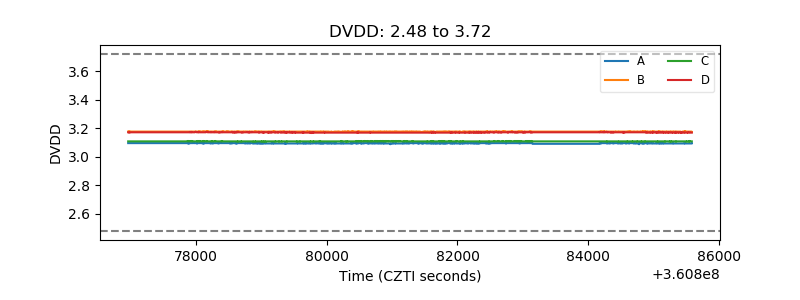 |
| Temperature 1 | 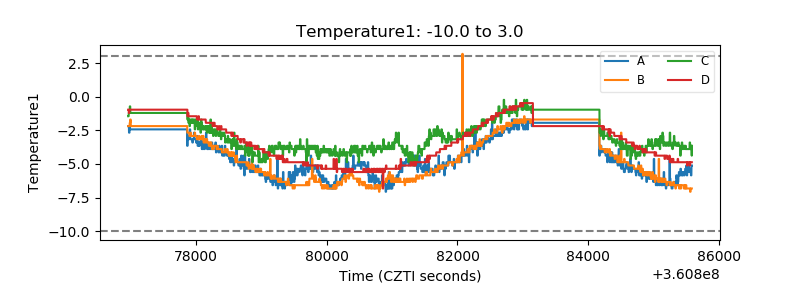 |
| Veto HV Monitor | 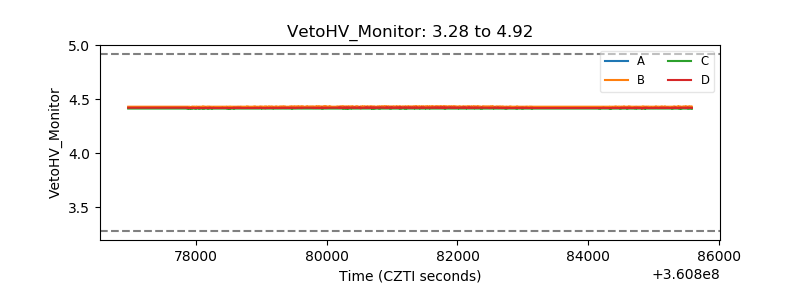 |
| Veto LLD | 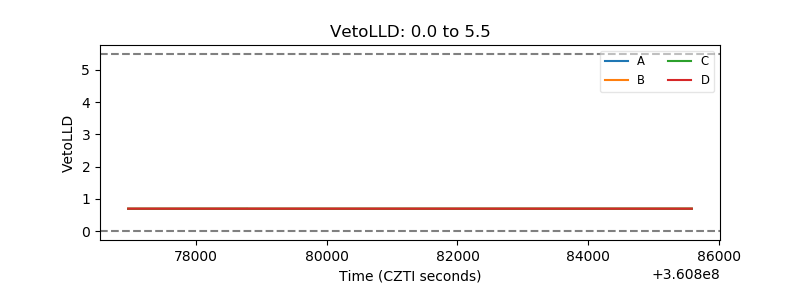 |
| Alpha Counter | 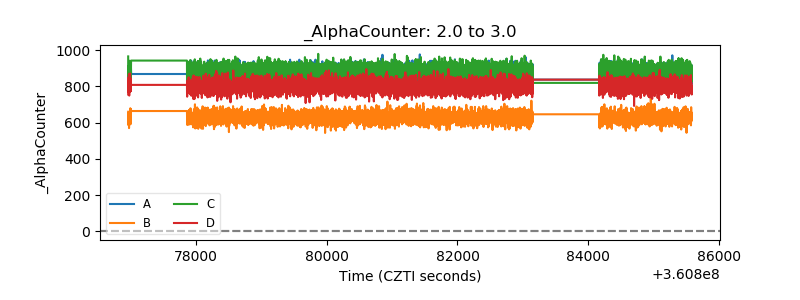 |
| _CPM_Rate | 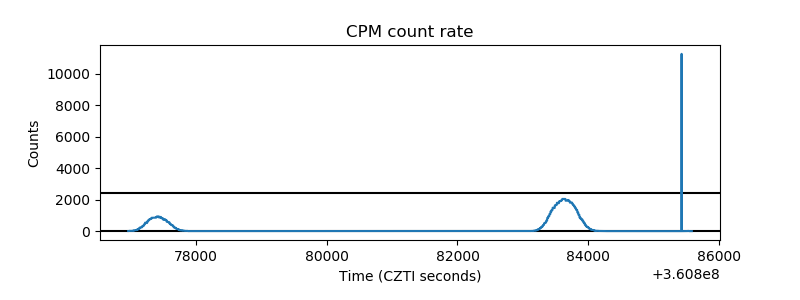 |
| CZT Counter | 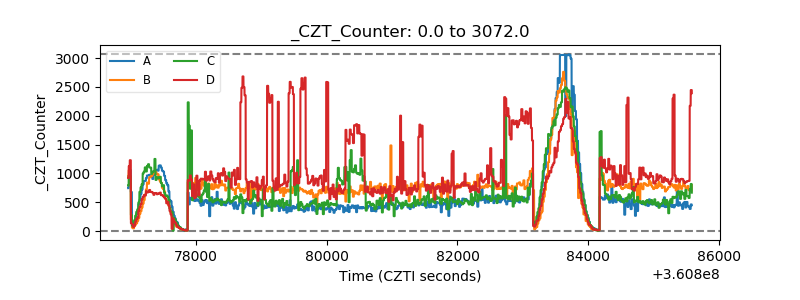 |
| +2.5 Volts monitor |  |
| +5 Volts monitor |  |
| _ROLL_ROT |  |
| _Roll_DEC | 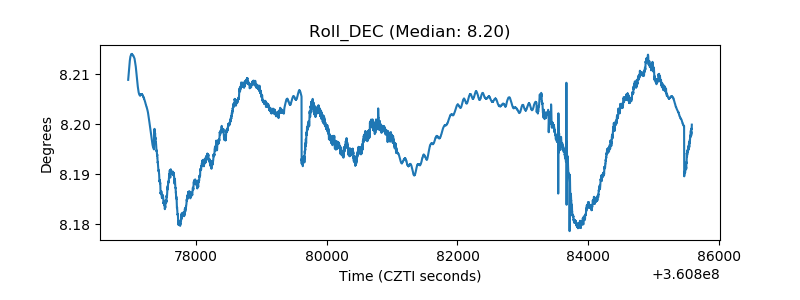 |
| _Roll_RA | 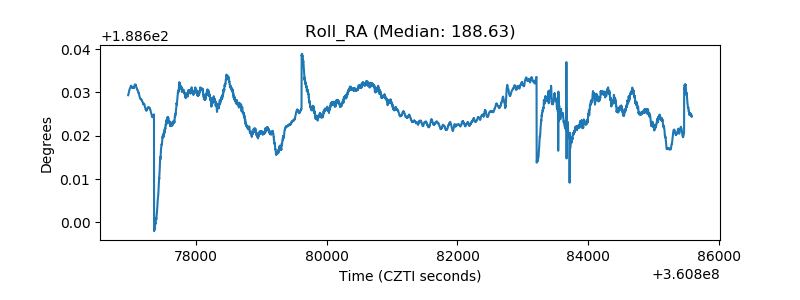 |
| Veto Counter |  |