| Param | Original file | Final file |
|---|---|---|
| Filename | modeM0/AS1A10_071T25_9000004450_30802cztM0_level2.evt | modeM0/AS1A10_071T25_9000004450_30802cztM0_level2_quad_clean.evt |
| Size (bytes) | 575,539,200 | 74,557,440 |
| Size | 548.9 MB | 71.1 MB |
| Events in quadrant A | 3,405,028 | 474,492 |
| Events in quadrant B | 5,658,357 | 475,544 |
| Events in quadrant C | 3,935,992 | 435,130 |
| Events in quadrant D | 4,006,577 | 434,445 |
| Mode M0 | |||
|---|---|---|---|
| Quadrant | BADHDUFLAG | Total packets | Discarded packets |
| A | 0 | 13728 | 2 |
| B | 0 | 20716 | 2 |
| C | 0 | 15844 | 2 |
| D | 0 | 16013 | 2 |
| Mode SS | |||
|---|---|---|---|
| Quadrant | BADHDUFLAG | Total packets | Discarded packets |
| A | 0 | 128 | 0 |
| B | 0 | 128 | 0 |
| C | 0 | 128 | 0 |
| D | 0 | 128 | 0 |
| Mode M9 | |||
|---|---|---|---|
| Quadrant | BADHDUFLAG | Total packets | Discarded packets |
| A | 0 | 17 | 0 |
| B | 0 | 18 | 0 |
| C | 0 | 18 | 0 |
| D | 0 | 18 | 0 |
| Quadrant | Total seconds | Saturated seconds | Saturation percentage |
|---|---|---|---|
| A | 6274 | 33 | 0.525980% |
| B | 6274 | 267 | 4.255658% |
| C | 6273 | 157 | 2.502790% |
| D | 6273 | 41 | 0.653595% |
Noise dominated data is calculated using 1-second bins in cleaned event files. If a bin has >2000 counts, and if more than 50% of those come from <1% of pixels, then it is considered to be noise-dominated and hence unusable.
| Quadrant | # 1 sec bins | Bins with >0 counts | Bins with >2000 counts | High rate bins dominated by noise | Noise dominated (total time) | Noise dominated (detector-on time) | Marked lightcurve |
|---|---|---|---|---|---|---|---|
| A | 7589 | 6274 | 0 | 0 | 0.00% | 0.00% | 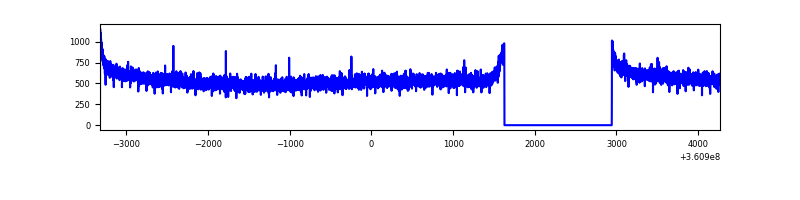 |
| B | 7589 | 6274 | 135 | 135 | 1.78% | 2.15% | 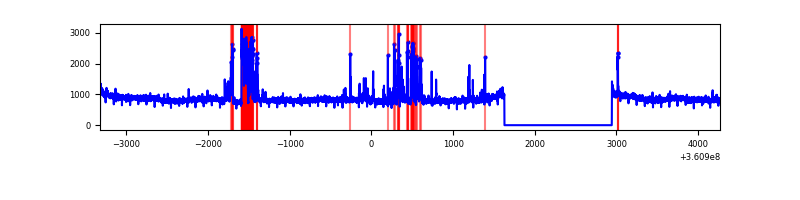 |
| C | 7588 | 6273 | 39 | 39 | 0.51% | 0.62% |  |
| D | 7588 | 6273 | 29 | 29 | 0.38% | 0.46% | 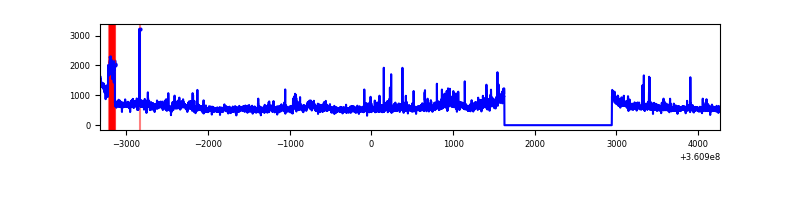 |
Top three noisy pixels from each quadrant. If the there are fewer than three noisy pixels in the level2.evt file, extra rows are filled as -1
| Pixel properties | Quadrant properties | ||||||
|---|---|---|---|---|---|---|---|
| Quadrant | DetID | PixID | Counts | Sigma | Mean | Median | Sigma |
| A | 13 | 254 | 11521 | 61.55 | 882 | 871 | 173.0 |
| A | 3 | 137 | 8060 | 41.55 | 882 | 871 | 173.0 |
| A | 0 | 226 | 7416 | 37.82 | 882 | 871 | 173.0 |
| B | 6 | 159 | 1720685 | 10441.33 | 871 | 854 | 164.7 |
| B | 5 | 255 | 467889 | 2835.43 | 871 | 854 | 164.7 |
| B | 12 | 111 | 19128 | 110.94 | 871 | 854 | 164.7 |
| C | 3 | 233 | 418655 | 2205.75 | 820 | 829 | 189.4 |
| C | 0 | 10 | 158266 | 831.13 | 820 | 829 | 189.4 |
| C | 14 | 238 | 136288 | 715.1 | 820 | 829 | 189.4 |
| D | 8 | 195 | 808296 | 4012.08 | 824 | 806 | 201.3 |
| D | 2 | 250 | 33433 | 162.11 | 824 | 806 | 201.3 |
| D | 2 | 234 | 27284 | 131.56 | 824 | 806 | 201.3 |
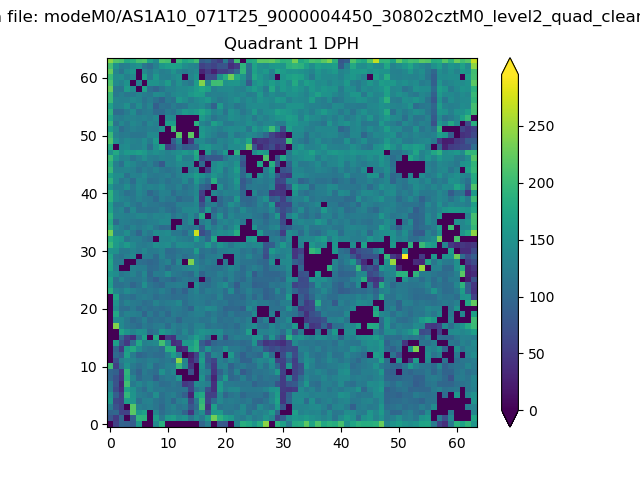
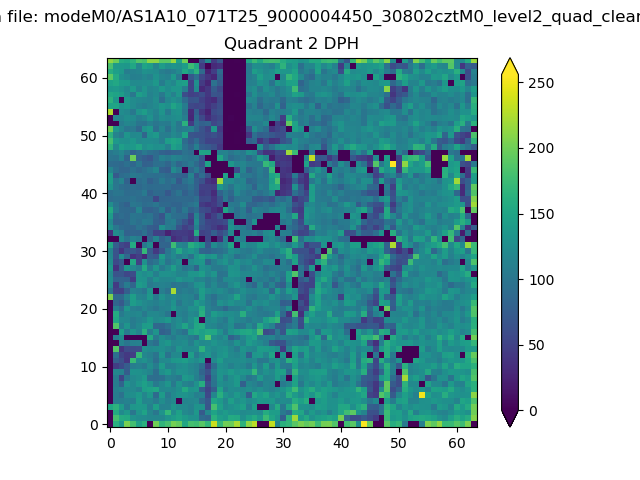
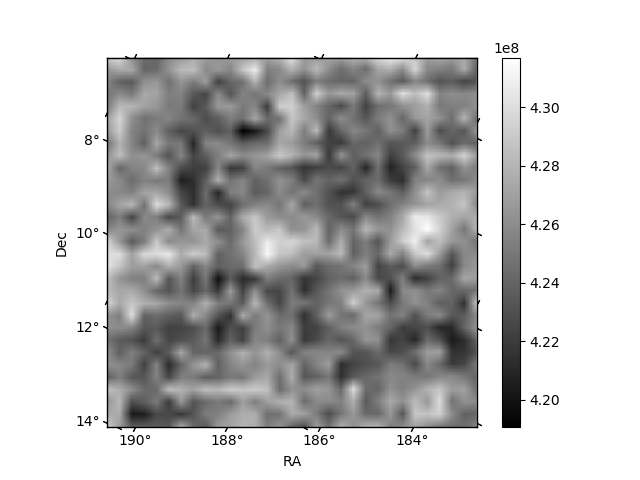
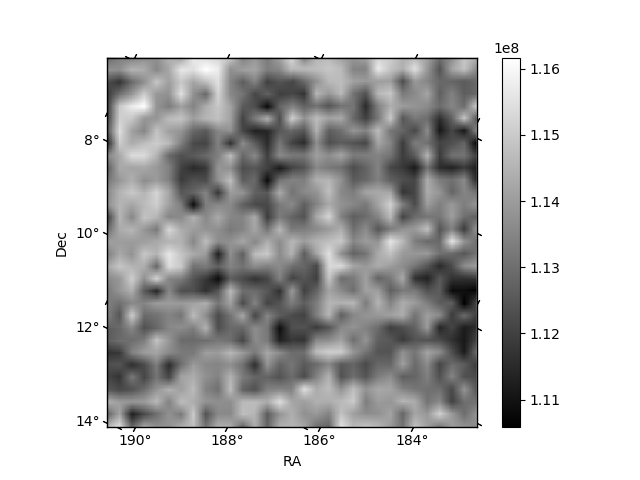
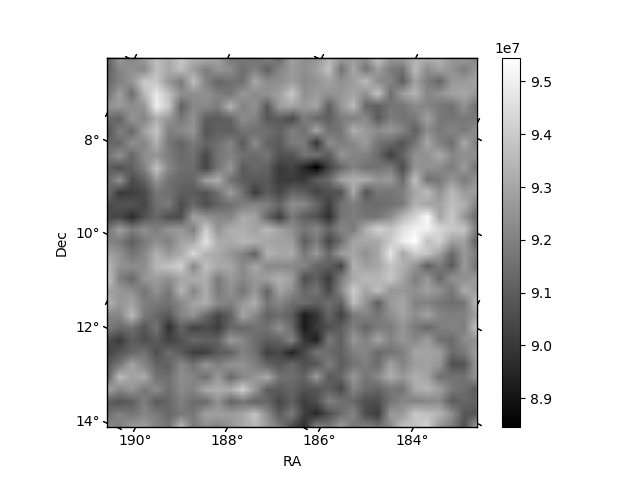
Histogram calculated using DETX and DETY for each event in the final _common_clean file
| Quadrant A | 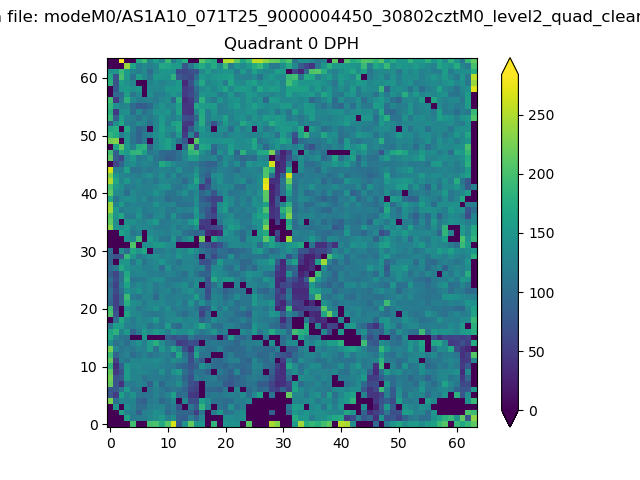 |
 |
Quadrant B |
|---|---|---|---|
| Quadrant D | 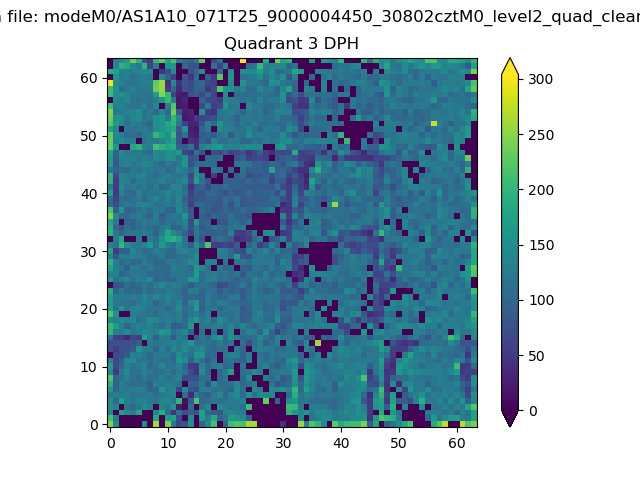 |
 |
Quadrant C |
| Plot type | Count rate plots | Images |
|---|---|---|
| Comparison with Poisson distribution Blue bars denote a histogram of data divided into 1 sec bins. Red curve is a Poisson curve with rate = median count rate of data. |
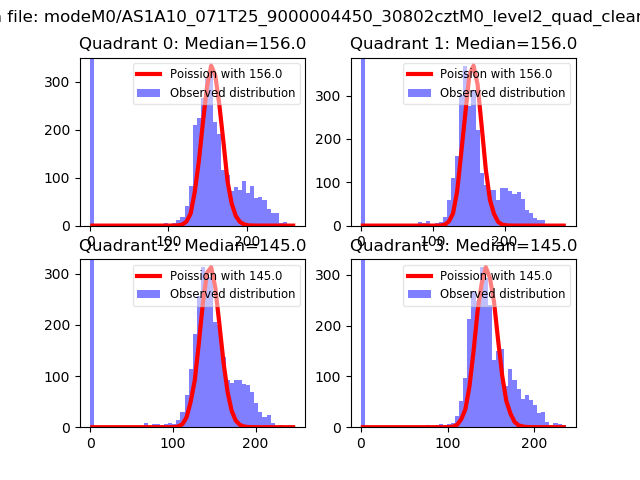 |
 |
| Quadrant-wise count rates Data is divided into 100 sec bins |
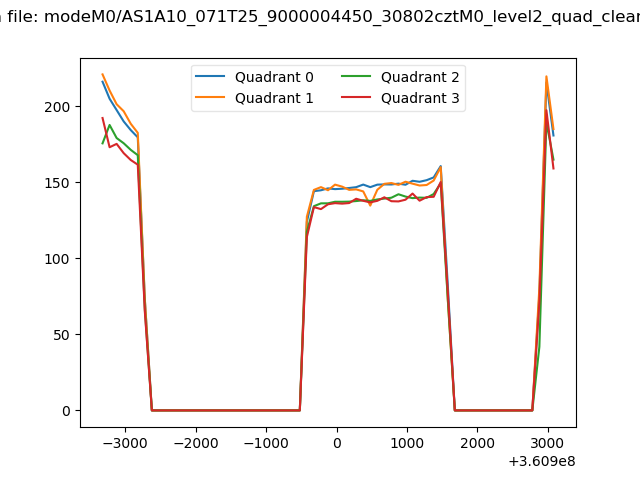 |
|
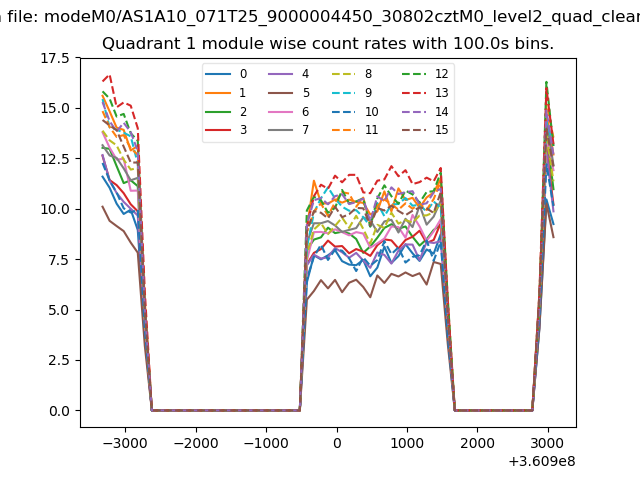
| Module-wise count rates for Quadrant A Data is divided into 100 sec bins |
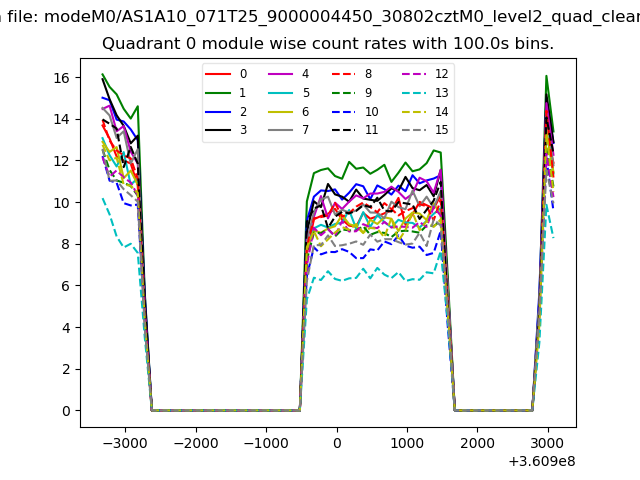 |
 |
| Module-wise count rates for Quadrant B Data is divided into 100 sec bins |
 |
 |
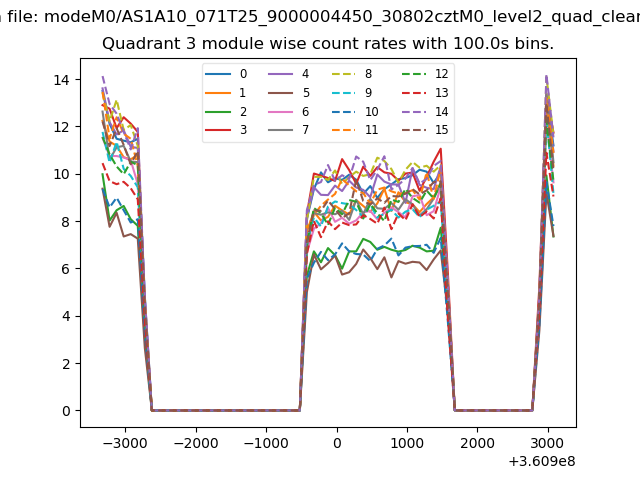
| Module-wise count rates for Quadrant C Data is divided into 100 sec bins |
 |
 |
| Module-wise count rates for Quadrant D Data is divided into 100 sec bins |
 |
 |
| Parameter | Plot |
|---|---|
| CZT HV Monitor |  |
| D_VDD | 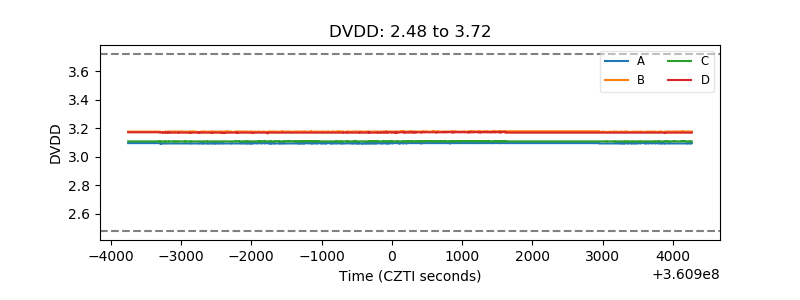 |
| Temperature 1 | 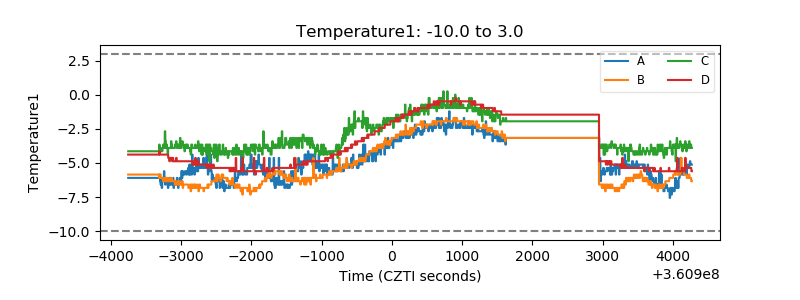 |
| Veto HV Monitor | 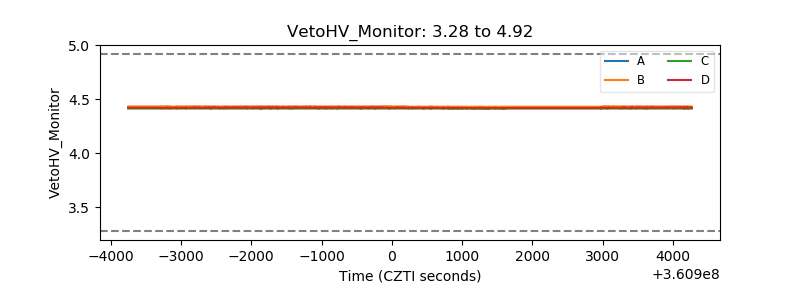 |
| Veto LLD | 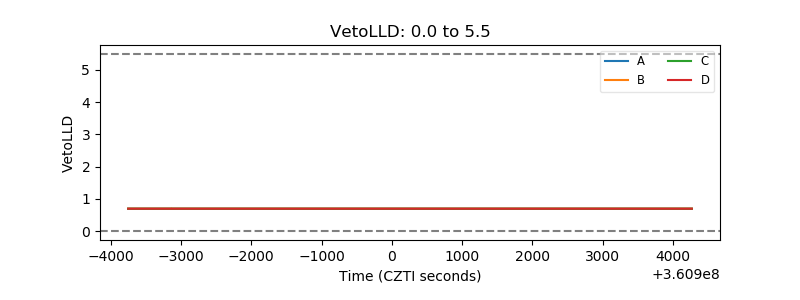 |
| Alpha Counter | 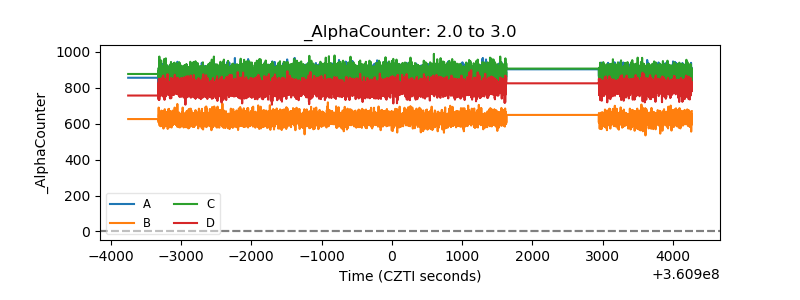 |
| _CPM_Rate | 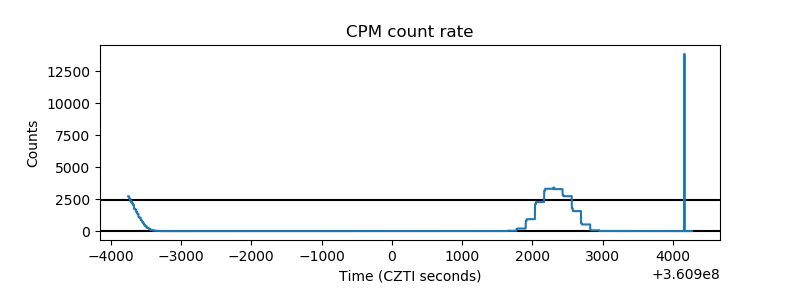 |
| CZT Counter | 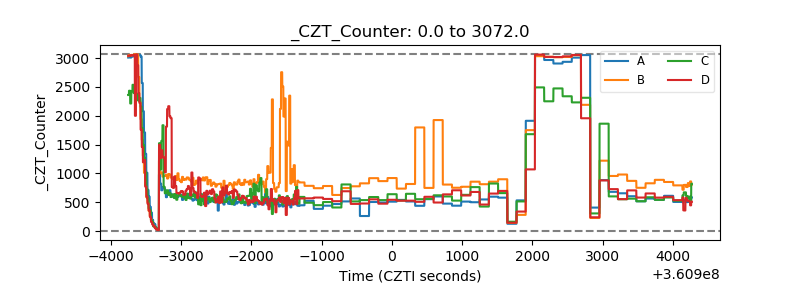 |
| +2.5 Volts monitor |  |
| +5 Volts monitor | 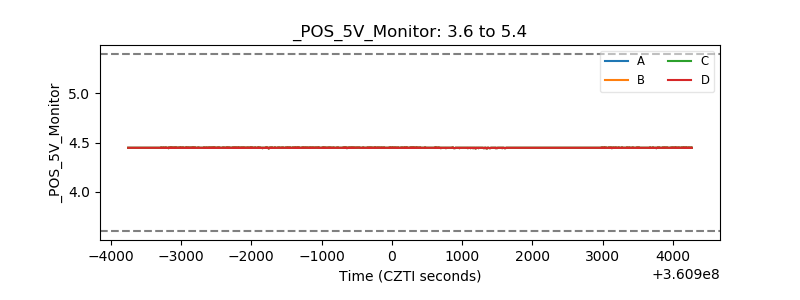 |
| _ROLL_ROT | 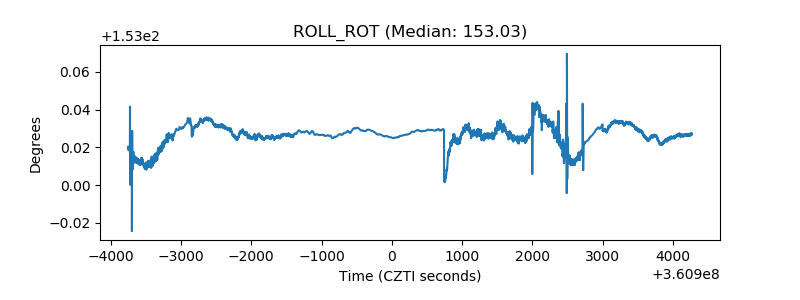 |
| _Roll_DEC | 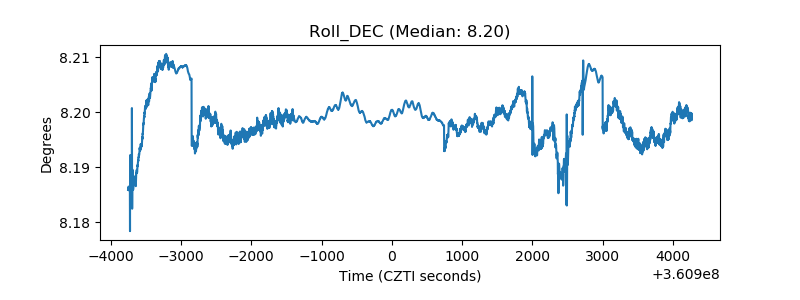 |
| _Roll_RA | 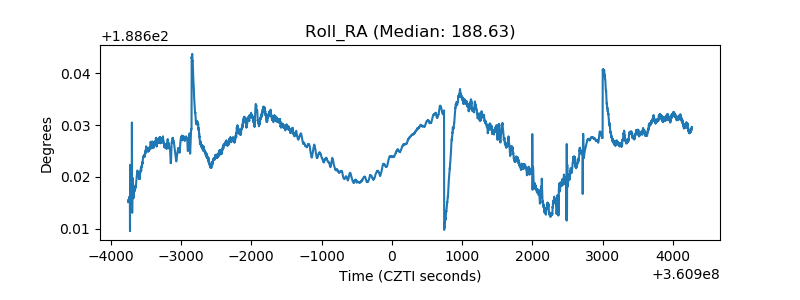 |
| Veto Counter | 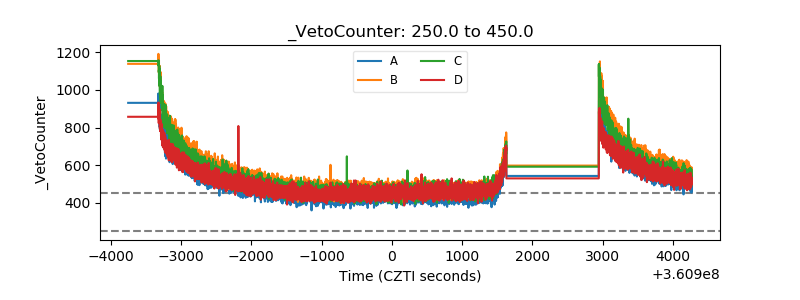 |