| Param | Original file | Final file |
|---|---|---|
| Filename | modeM0/AS1A10_071T25_9000004450_30803cztM0_level2.evt | modeM0/AS1A10_071T25_9000004450_30803cztM0_level2_quad_clean.evt |
| Size (bytes) | 587,378,880 | 60,448,320 |
| Size | 560.2 MB | 57.6 MB |
| Events in quadrant A | 3,382,031 | 366,097 |
| Events in quadrant B | 5,157,522 | 364,457 |
| Events in quadrant C | 3,768,621 | 340,945 |
| Events in quadrant D | 5,062,929 | 326,999 |
| Mode M0 | |||
|---|---|---|---|
| Quadrant | BADHDUFLAG | Total packets | Discarded packets |
| A | 0 | 13438 | 1 |
| B | 0 | 19000 | 1 |
| C | 0 | 15157 | 1 |
| D | 0 | 19282 | 1 |
| Mode SS | |||
|---|---|---|---|
| Quadrant | BADHDUFLAG | Total packets | Discarded packets |
| A | 0 | 126 | 0 |
| B | 0 | 126 | 0 |
| C | 0 | 126 | 0 |
| D | 0 | 126 | 0 |
| Mode M9 | |||
|---|---|---|---|
| Quadrant | BADHDUFLAG | Total packets | Discarded packets |
| A | 0 | 14 | 0 |
| B | 0 | 14 | 0 |
| C | 0 | 14 | 0 |
| D | 0 | 14 | 0 |
| Quadrant | Total seconds | Saturated seconds | Saturation percentage |
|---|---|---|---|
| A | 6179 | 45 | 0.728273% |
| B | 6179 | 119 | 1.925878% |
| C | 6180 | 139 | 2.249191% |
| D | 6180 | 215 | 3.478964% |
Noise dominated data is calculated using 1-second bins in cleaned event files. If a bin has >2000 counts, and if more than 50% of those come from <1% of pixels, then it is considered to be noise-dominated and hence unusable.
| Quadrant | # 1 sec bins | Bins with >0 counts | Bins with >2000 counts | High rate bins dominated by noise | Noise dominated (total time) | Noise dominated (detector-on time) | Marked lightcurve |
|---|---|---|---|---|---|---|---|
| A | 7514 | 6180 | 0 | 0 | 0.00% | 0.00% | 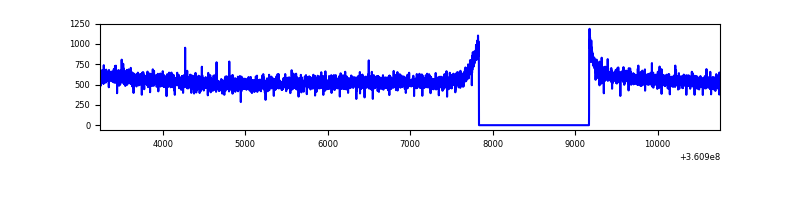 |
| B | 7514 | 6179 | 8 | 8 | 0.11% | 0.13% | 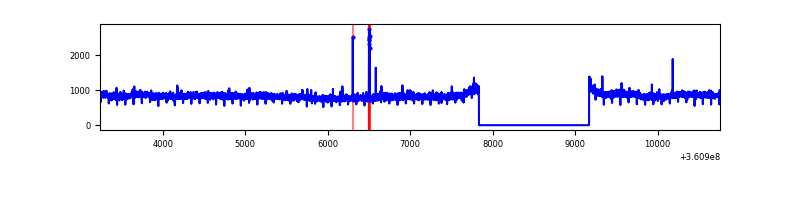 |
| C | 7515 | 6180 | 20 | 20 | 0.27% | 0.32% | 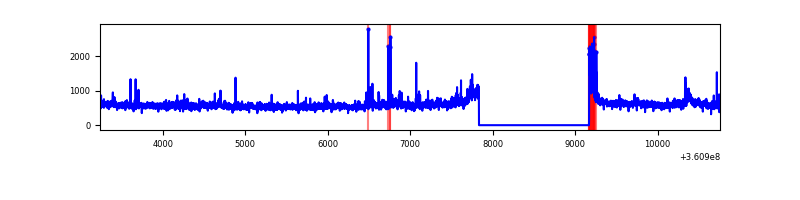 |
| D | 7515 | 6180 | 169 | 169 | 2.25% | 2.73% | 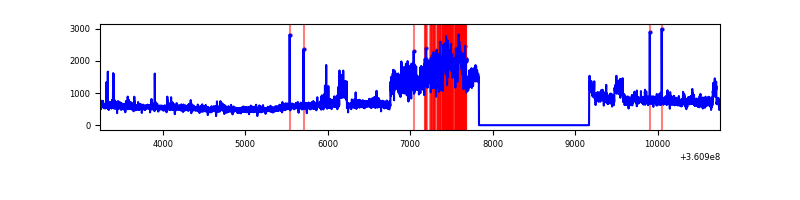 |
Top three noisy pixels from each quadrant. If the there are fewer than three noisy pixels in the level2.evt file, extra rows are filled as -1
| Pixel properties | Quadrant properties | ||||||
|---|---|---|---|---|---|---|---|
| Quadrant | DetID | PixID | Counts | Sigma | Mean | Median | Sigma |
| A | 13 | 254 | 11829 | 63.28 | 876 | 866 | 173.2 |
| A | 3 | 137 | 8111 | 41.82 | 876 | 866 | 173.2 |
| A | 0 | 226 | 7541 | 38.53 | 876 | 866 | 173.2 |
| B | 6 | 159 | 1702613 | 10525.85 | 866 | 850 | 161.7 |
| B | 12 | 111 | 19171 | 113.32 | 866 | 850 | 161.7 |
| B | 11 | 111 | 17483 | 102.88 | 866 | 850 | 161.7 |
| C | 3 | 233 | 281274 | 1497.96 | 811 | 819 | 187.2 |
| C | 0 | 10 | 153922 | 817.75 | 811 | 819 | 187.2 |
| C | 14 | 238 | 135600 | 719.89 | 811 | 819 | 187.2 |
| D | 8 | 195 | 1934588 | 10046.18 | 814 | 799 | 192.5 |
| D | 2 | 234 | 24145 | 121.28 | 814 | 799 | 192.5 |
| D | 2 | 250 | 19101 | 95.08 | 814 | 799 | 192.5 |
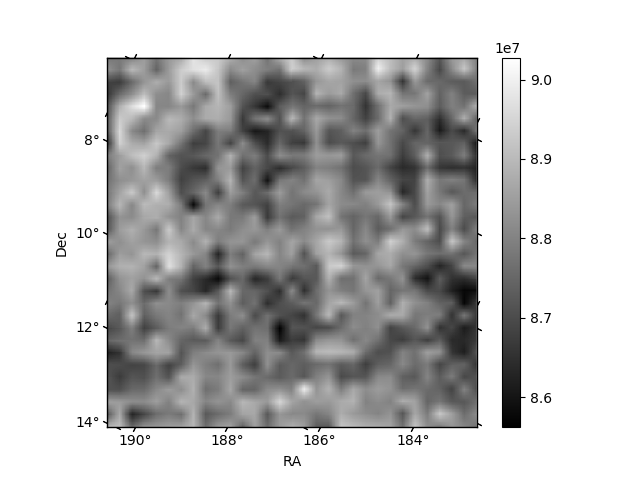
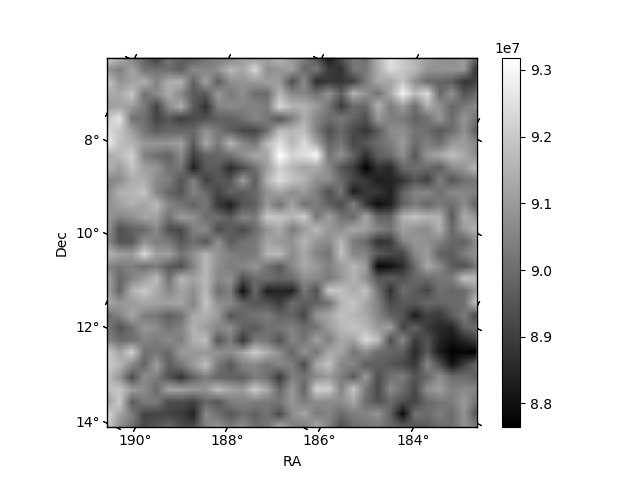
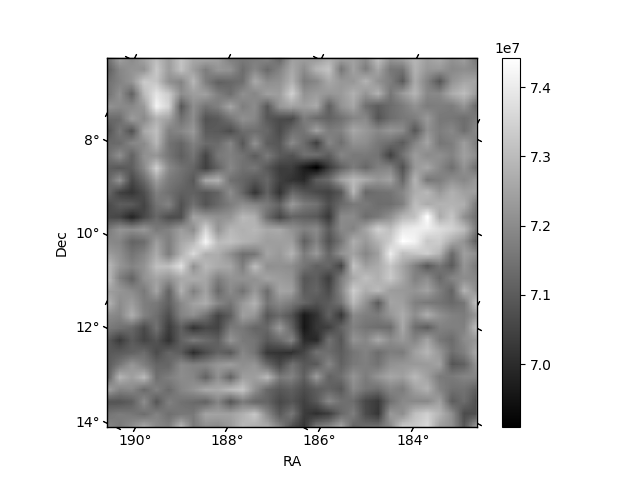
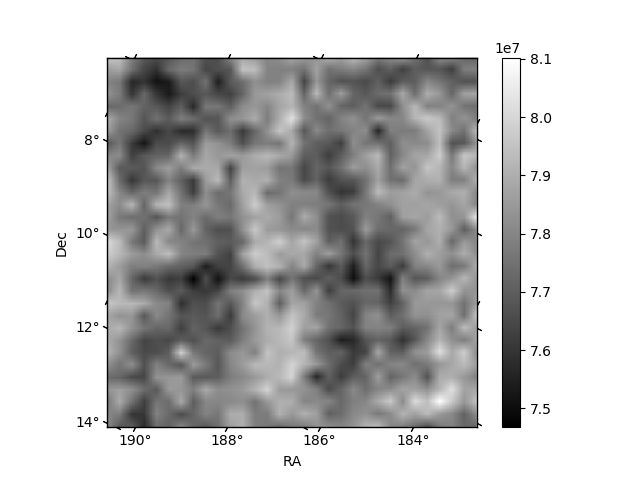
Histogram calculated using DETX and DETY for each event in the final _common_clean file
| Quadrant A | 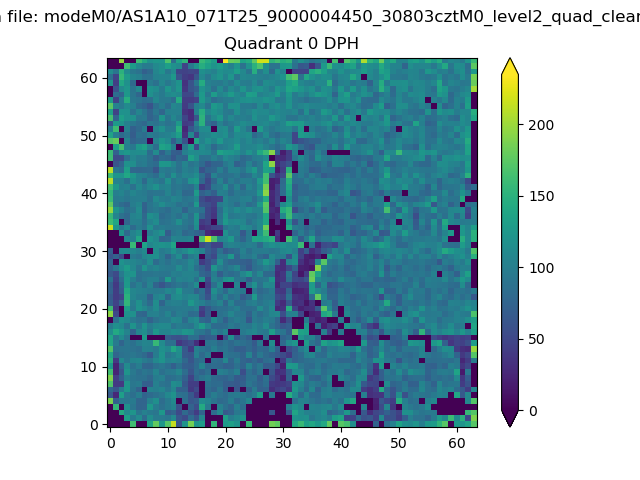 |
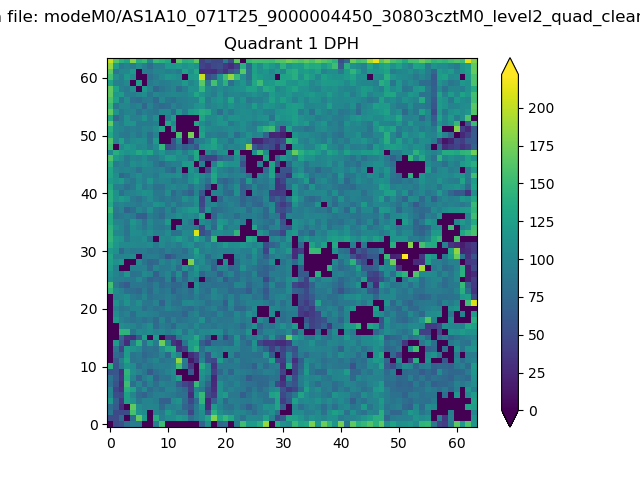 |
Quadrant B |
|---|---|---|---|
| Quadrant D | 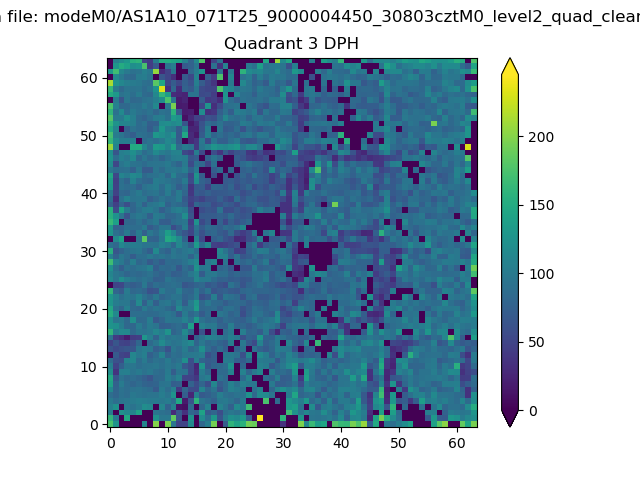 |
 |
Quadrant C |
| Plot type | Count rate plots | Images |
|---|---|---|
| Comparison with Poisson distribution Blue bars denote a histogram of data divided into 1 sec bins. Red curve is a Poisson curve with rate = median count rate of data. |
 |
 |
| Quadrant-wise count rates Data is divided into 100 sec bins |
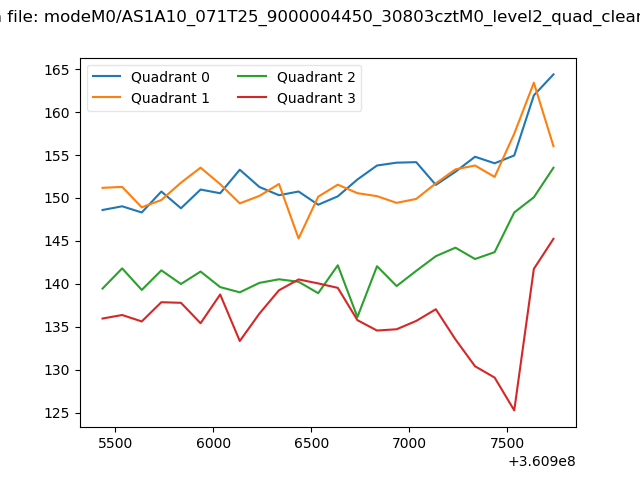 |
|
| Module-wise count rates for Quadrant A Data is divided into 100 sec bins |
 |
 |
| Module-wise count rates for Quadrant B Data is divided into 100 sec bins |
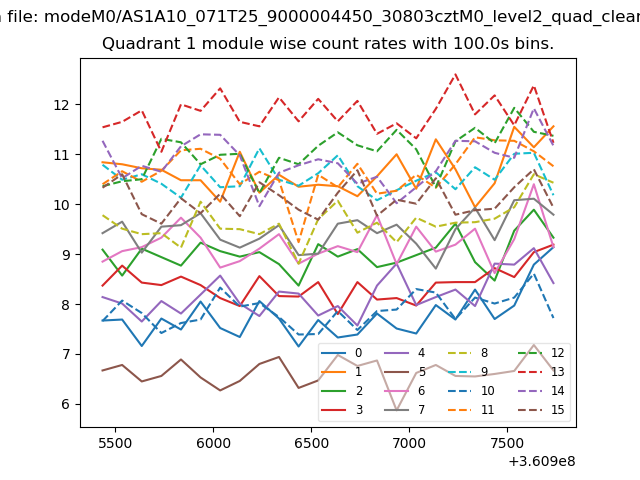 |
 |
| Module-wise count rates for Quadrant C Data is divided into 100 sec bins |
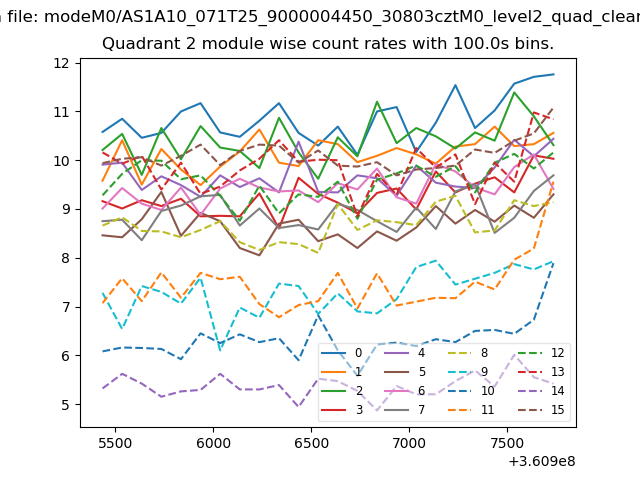 |
 |
| Module-wise count rates for Quadrant D Data is divided into 100 sec bins |
 |
 |
| Parameter | Plot |
|---|---|
| CZT HV Monitor | 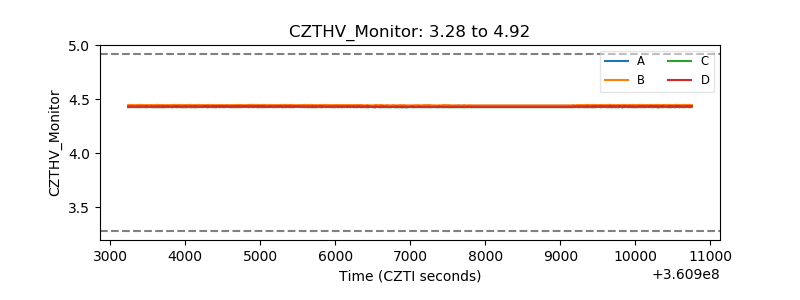 |
| D_VDD | 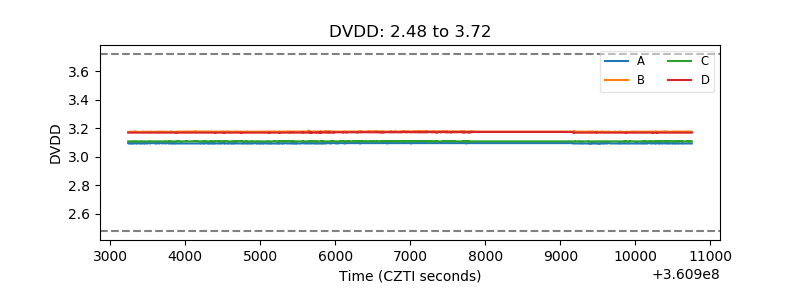 |
| Temperature 1 | 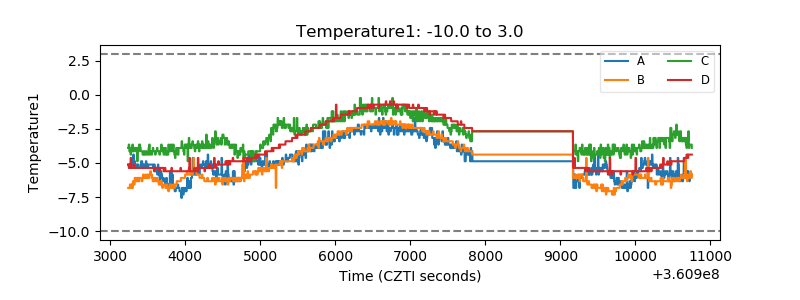 |
| Veto HV Monitor | 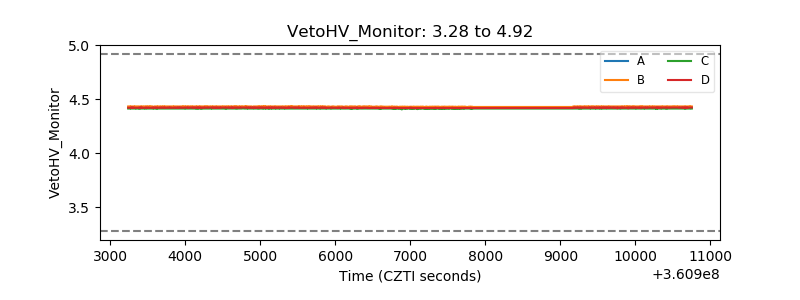 |
| Veto LLD | 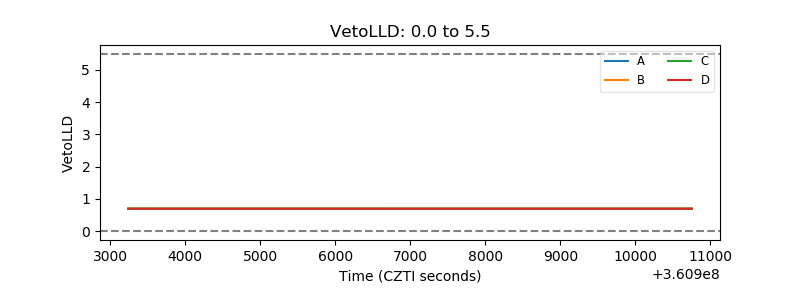 |
| Alpha Counter | 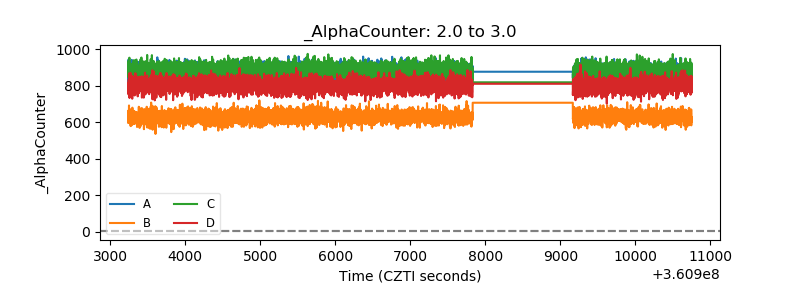 |
| _CPM_Rate | 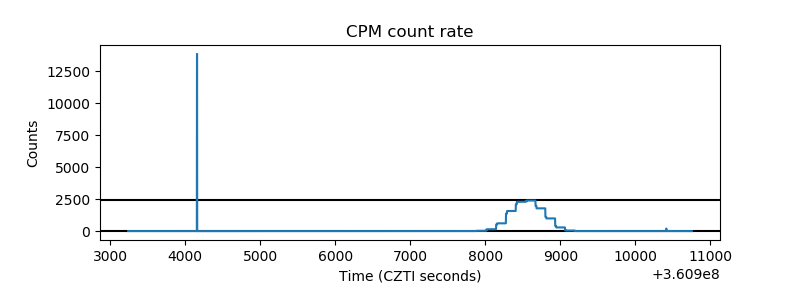 |
| CZT Counter | 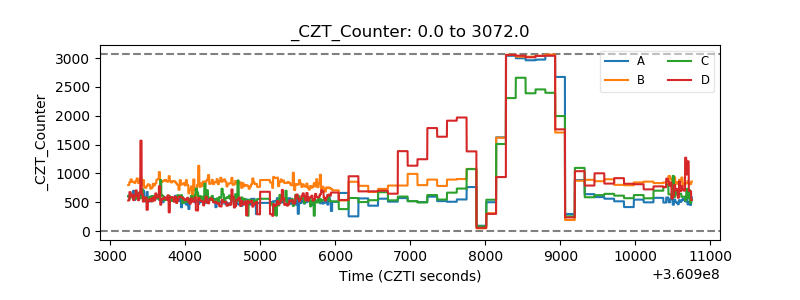 |
| +2.5 Volts monitor |  |
| +5 Volts monitor |  |
| _ROLL_ROT |  |
| _Roll_DEC |  |
| _Roll_RA | 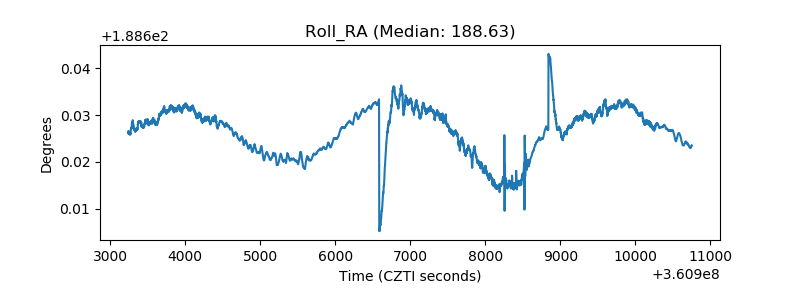 |
| Veto Counter |  |