| Param | Original file | Final file |
|---|---|---|
| Filename | modeM0/AS1A10_071T25_9000004450_30805cztM0_level2.evt | modeM0/AS1A10_071T25_9000004450_30805cztM0_level2_quad_clean.evt |
| Size (bytes) | 606,628,800 | 80,706,240 |
| Size | 578.5 MB | 77.0 MB |
| Events in quadrant A | 3,478,564 | 513,855 |
| Events in quadrant B | 5,339,732 | 510,880 |
| Events in quadrant C | 4,392,867 | 479,282 |
| Events in quadrant D | 4,711,472 | 476,729 |
| Mode M0 | |||
|---|---|---|---|
| Quadrant | BADHDUFLAG | Total packets | Discarded packets |
| A | 0 | 14012 | 3 |
| B | 0 | 20436 | 3 |
| C | 0 | 17642 | 3 |
| D | 0 | 18434 | 3 |
| Mode SS | |||
|---|---|---|---|
| Quadrant | BADHDUFLAG | Total packets | Discarded packets |
| A | 0 | 136 | 0 |
| B | 0 | 136 | 0 |
| C | 0 | 136 | 0 |
| D | 0 | 136 | 0 |
| Mode M9 | |||
|---|---|---|---|
| Quadrant | BADHDUFLAG | Total packets | Discarded packets |
| A | 0 | 18 | 0 |
| B | 0 | 19 | 0 |
| C | 0 | 19 | 0 |
| D | 0 | 19 | 0 |
| Quadrant | Total seconds | Saturated seconds | Saturation percentage |
|---|---|---|---|
| A | 6640 | 150 | 2.259036% |
| B | 6640 | 249 | 3.750000% |
| C | 6640 | 297 | 4.472892% |
| D | 6640 | 165 | 2.484940% |
Noise dominated data is calculated using 1-second bins in cleaned event files. If a bin has >2000 counts, and if more than 50% of those come from <1% of pixels, then it is considered to be noise-dominated and hence unusable.
| Quadrant | # 1 sec bins | Bins with >0 counts | Bins with >2000 counts | High rate bins dominated by noise | Noise dominated (total time) | Noise dominated (detector-on time) | Marked lightcurve |
|---|---|---|---|---|---|---|---|
| A | 7600 | 6640 | 0 | 0 | 0.00% | 0.00% | 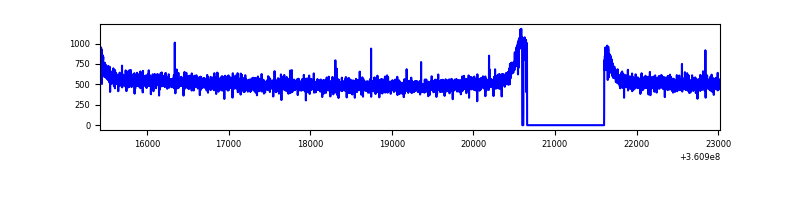 |
| B | 7600 | 6640 | 3 | 3 | 0.04% | 0.05% | 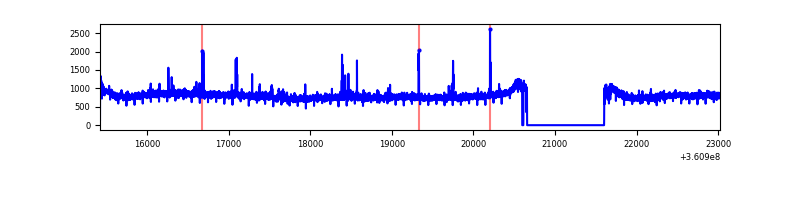 |
| C | 7600 | 6640 | 14 | 14 | 0.18% | 0.21% | 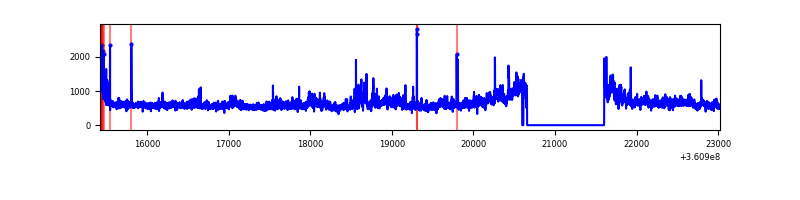 |
| D | 7600 | 6641 | 44 | 44 | 0.58% | 0.66% | 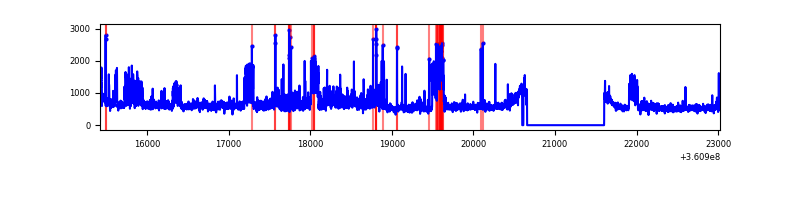 |
Top three noisy pixels from each quadrant. If the there are fewer than three noisy pixels in the level2.evt file, extra rows are filled as -1
| Pixel properties | Quadrant properties | ||||||
|---|---|---|---|---|---|---|---|
| Quadrant | DetID | PixID | Counts | Sigma | Mean | Median | Sigma |
| A | 13 | 254 | 11455 | 58.91 | 902 | 885 | 179.4 |
| A | 3 | 137 | 8886 | 44.59 | 902 | 885 | 179.4 |
| A | 0 | 226 | 7606 | 37.46 | 902 | 885 | 179.4 |
| B | 6 | 159 | 1769880 | 10480.38 | 882 | 863 | 168.8 |
| B | 4 | 80 | 32833 | 189.4 | 882 | 863 | 168.8 |
| B | 12 | 111 | 20529 | 116.51 | 882 | 863 | 168.8 |
| C | 3 | 233 | 839343 | 4275.15 | 838 | 843 | 196.1 |
| C | 14 | 238 | 138192 | 700.28 | 838 | 843 | 196.1 |
| C | 0 | 10 | 132654 | 672.05 | 838 | 843 | 196.1 |
| D | 8 | 195 | 1336460 | 6540.8 | 857 | 839 | 204.2 |
| D | 2 | 250 | 78903 | 382.3 | 857 | 839 | 204.2 |
| D | 15 | 217 | 45244 | 217.46 | 857 | 839 | 204.2 |
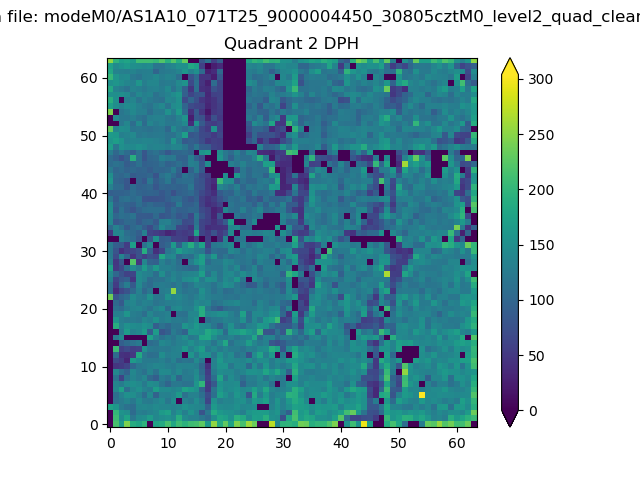
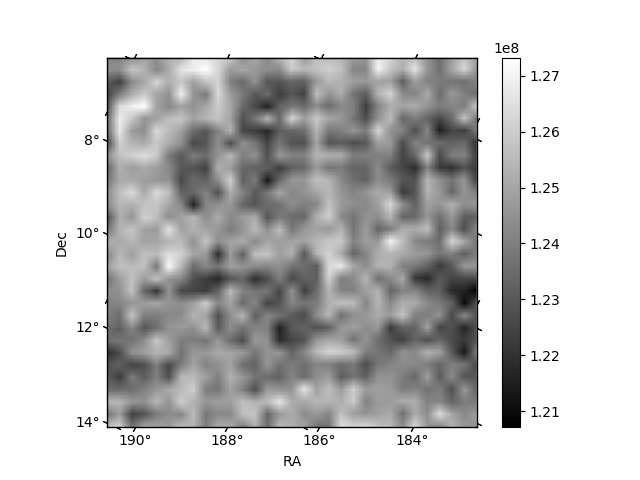
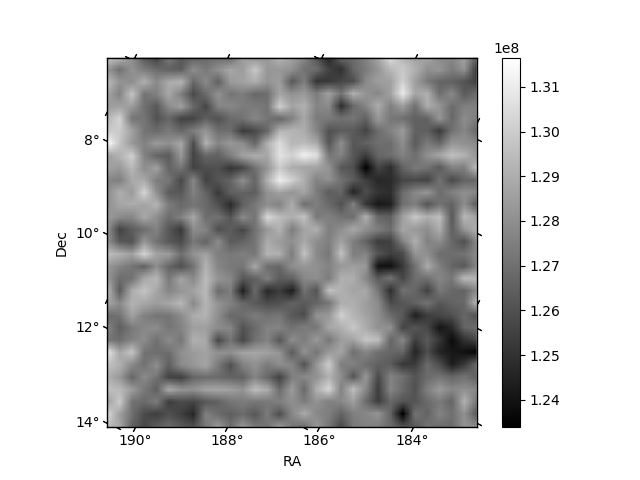
Histogram calculated using DETX and DETY for each event in the final _common_clean file
| Quadrant A | 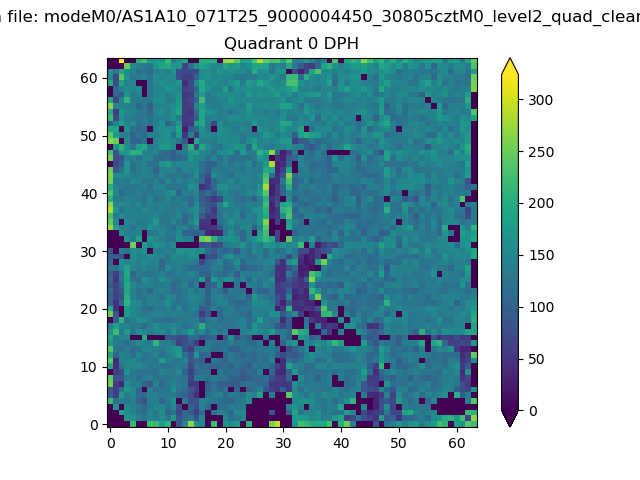 |
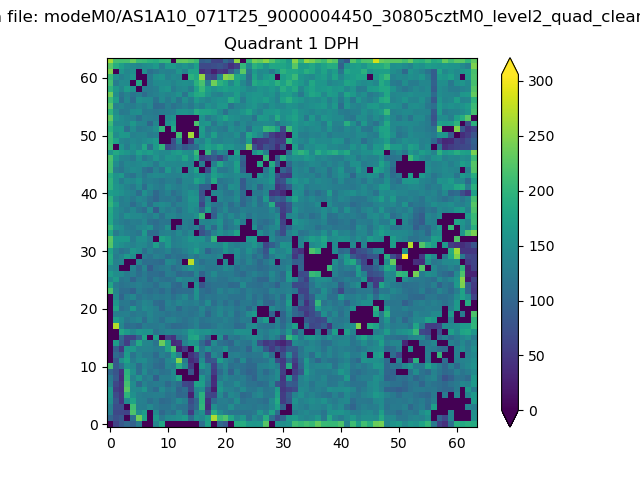 |
Quadrant B |
|---|---|---|---|
| Quadrant D | 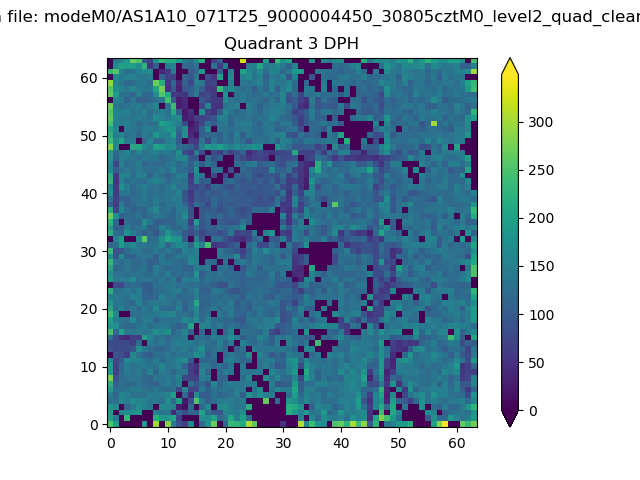 |
 |
Quadrant C |
| Plot type | Count rate plots | Images |
|---|---|---|
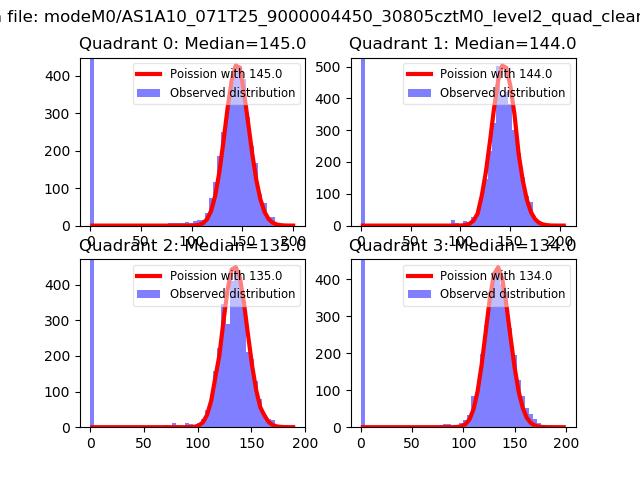
| Comparison with Poisson distribution Blue bars denote a histogram of data divided into 1 sec bins. Red curve is a Poisson curve with rate = median count rate of data. |
 |
 |
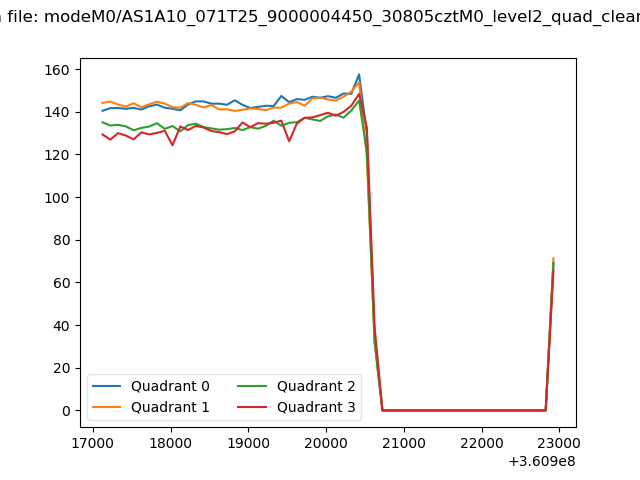
| Quadrant-wise count rates Data is divided into 100 sec bins |
 |
|
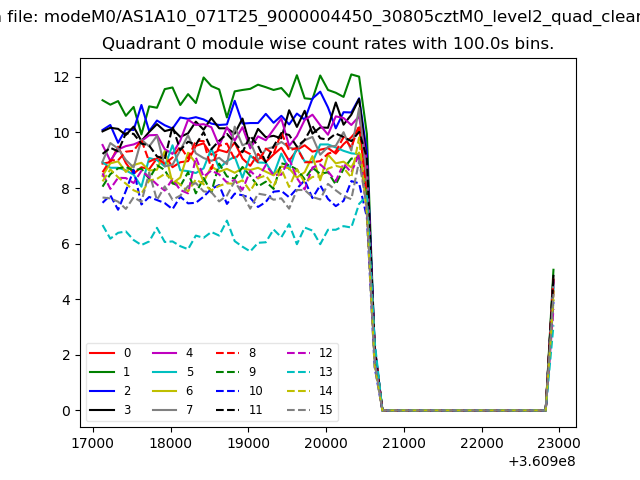
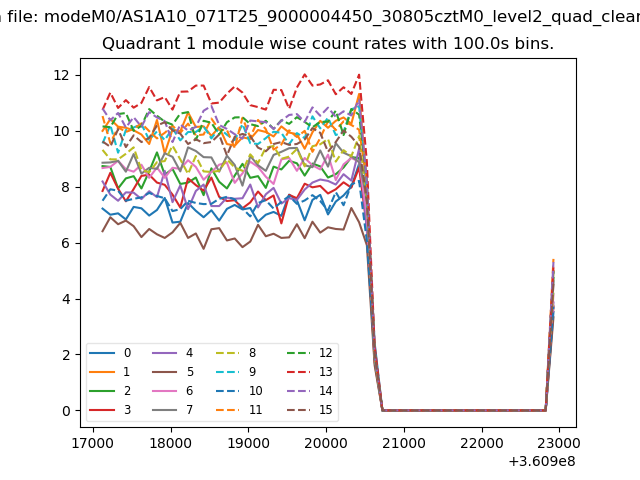
| Module-wise count rates for Quadrant A Data is divided into 100 sec bins |
 |
 |
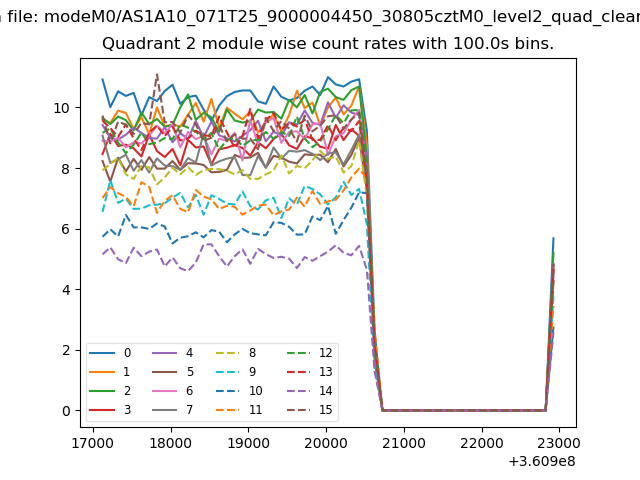
| Module-wise count rates for Quadrant B Data is divided into 100 sec bins |
 |
 |
| Module-wise count rates for Quadrant C Data is divided into 100 sec bins |
 |
 |
| Module-wise count rates for Quadrant D Data is divided into 100 sec bins |
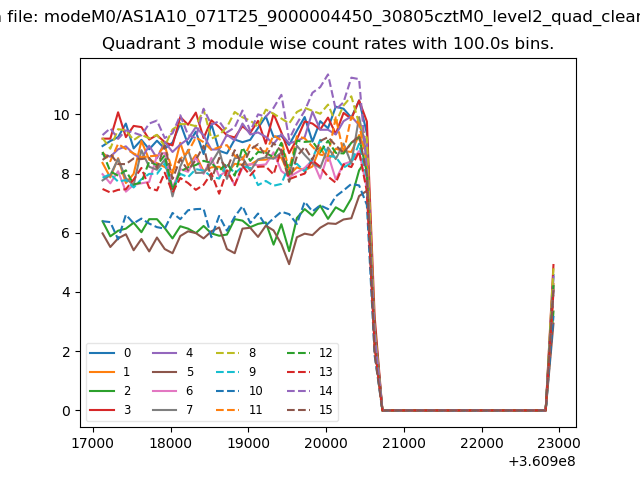 |
 |
| Parameter | Plot |
|---|---|
| CZT HV Monitor | 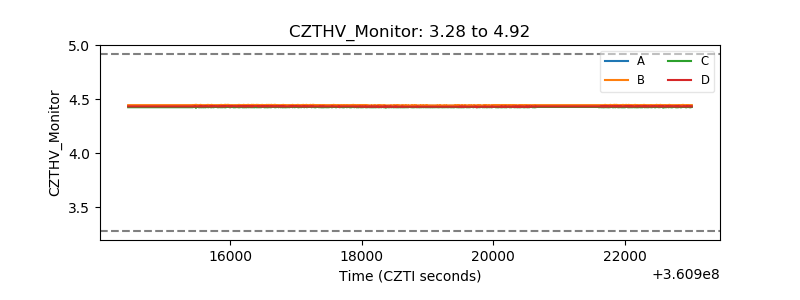 |
| D_VDD | 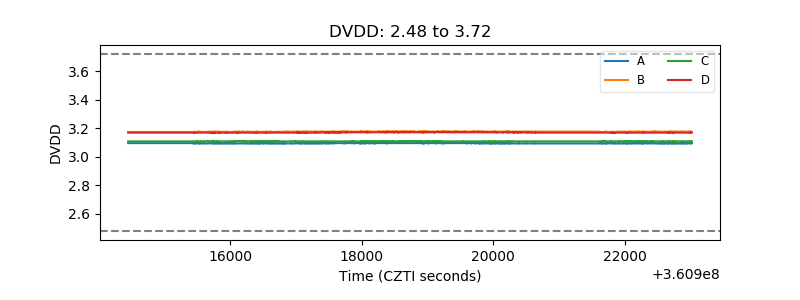 |
| Temperature 1 | 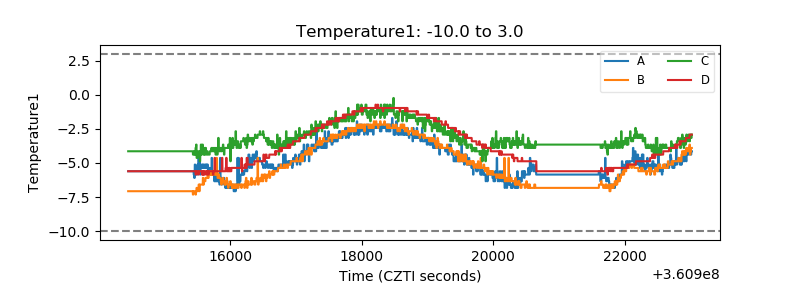 |
| Veto HV Monitor | 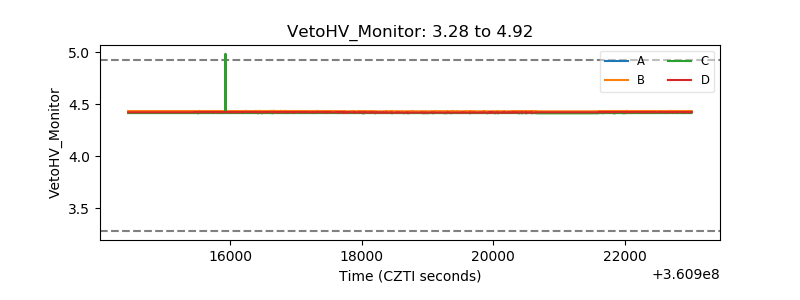 |
| Veto LLD | 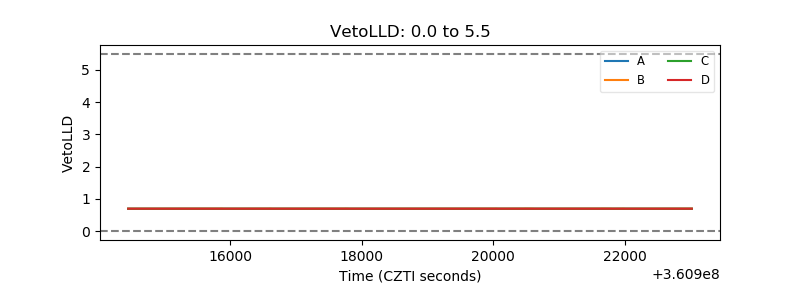 |
| Alpha Counter | 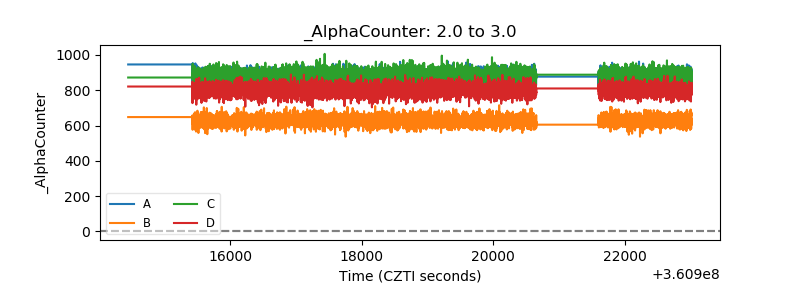 |
| _CPM_Rate | 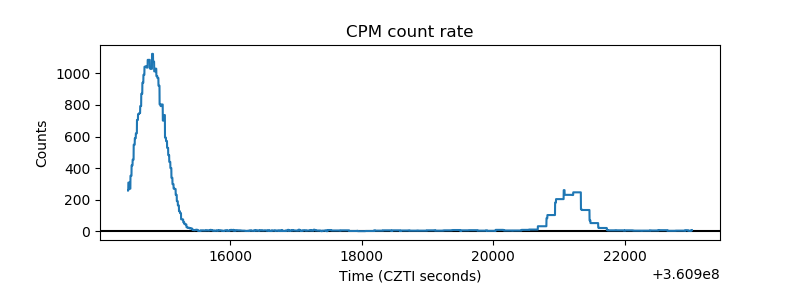 |
| CZT Counter | 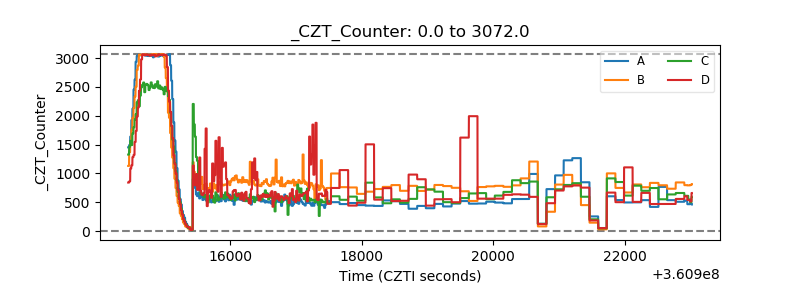 |
| +2.5 Volts monitor |  |
| +5 Volts monitor |  |
| _ROLL_ROT | 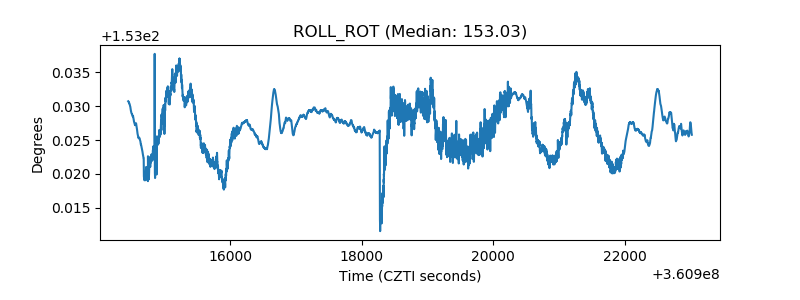 |
| _Roll_DEC | 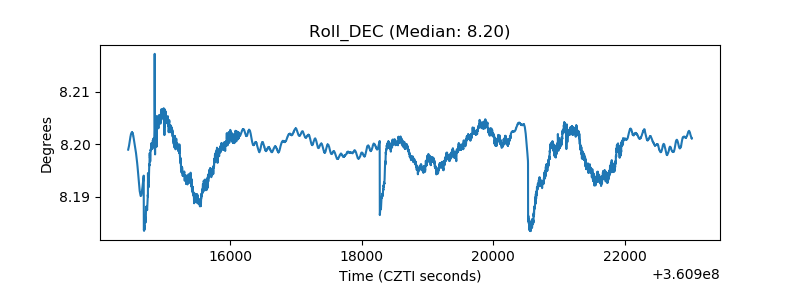 |
| _Roll_RA | 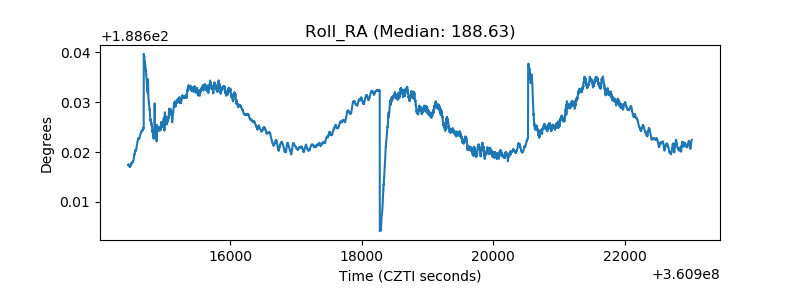 |
| Veto Counter | 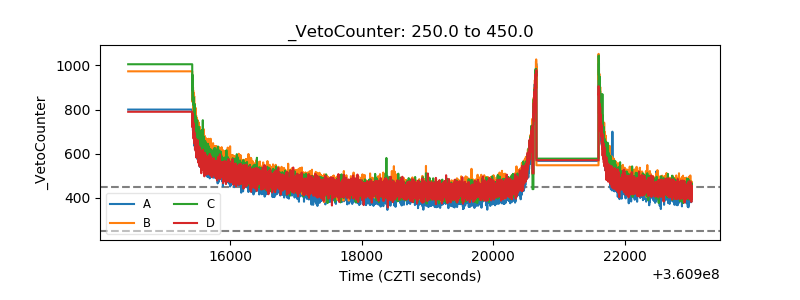 |