| Param | Original file | Final file |
|---|---|---|
| Filename | modeM0/AS1A10_071T25_9000004450_30806cztM0_level2.evt | modeM0/AS1A10_071T25_9000004450_30806cztM0_level2_quad_clean.evt |
| Size (bytes) | 402,264,000 | 63,141,120 |
| Size | 383.6 MB | 60.2 MB |
| Events in quadrant A | 2,155,627 | 415,402 |
| Events in quadrant B | 3,432,428 | 412,839 |
| Events in quadrant C | 3,387,175 | 384,533 |
| Events in quadrant D | 2,906,682 | 387,343 |
| Mode M0 | |||
|---|---|---|---|
| Quadrant | BADHDUFLAG | Total packets | Discarded packets |
| A | 0 | 9083 | 1 |
| B | 0 | 13488 | 1 |
| C | 0 | 13290 | 1 |
| D | 0 | 11485 | 1 |
| Mode SS | |||
|---|---|---|---|
| Quadrant | BADHDUFLAG | Total packets | Discarded packets |
| A | 0 | 88 | 0 |
| B | 0 | 88 | 0 |
| C | 0 | 88 | 0 |
| D | 0 | 88 | 0 |
| Quadrant | Total seconds | Saturated seconds | Saturation percentage |
|---|---|---|---|
| A | 4433 | 63 | 1.421159% |
| B | 4434 | 109 | 2.458277% |
| C | 4434 | 166 | 3.743798% |
| D | 4434 | 72 | 1.623816% |
Noise dominated data is calculated using 1-second bins in cleaned event files. If a bin has >2000 counts, and if more than 50% of those come from <1% of pixels, then it is considered to be noise-dominated and hence unusable.
| Quadrant | # 1 sec bins | Bins with >0 counts | Bins with >2000 counts | High rate bins dominated by noise | Noise dominated (total time) | Noise dominated (detector-on time) | Marked lightcurve |
|---|---|---|---|---|---|---|---|
| A | 4433 | 4433 | 0 | 0 | 0.00% | 0.00% | 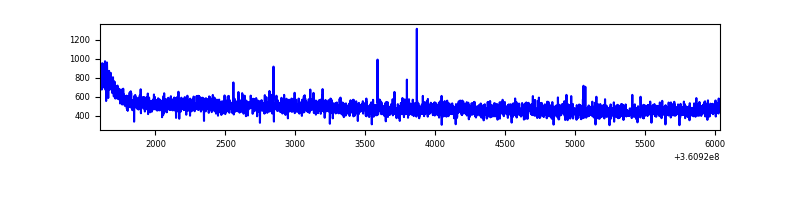 |
| B | 4434 | 4434 | 8 | 8 | 0.18% | 0.18% | 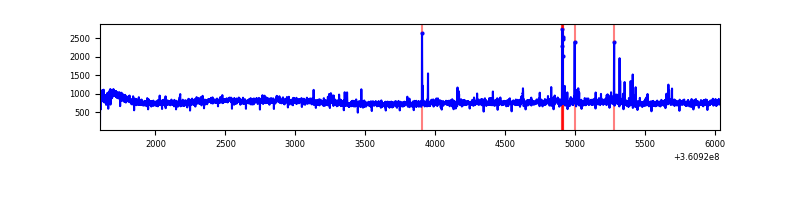 |
| C | 4434 | 4434 | 14 | 14 | 0.32% | 0.32% | 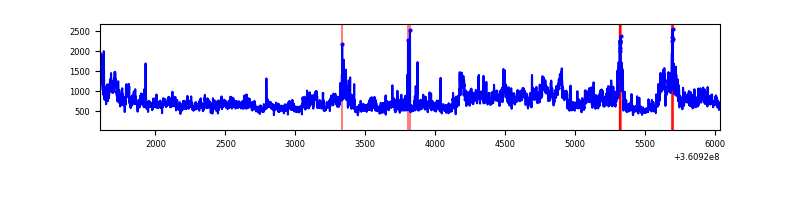 |
| D | 4434 | 4434 | 19 | 19 | 0.43% | 0.43% | 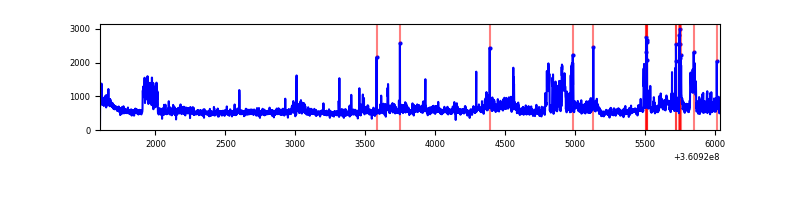 |
Top three noisy pixels from each quadrant. If the there are fewer than three noisy pixels in the level2.evt file, extra rows are filled as -1
| Pixel properties | Quadrant properties | ||||||
|---|---|---|---|---|---|---|---|
| Quadrant | DetID | PixID | Counts | Sigma | Mean | Median | Sigma |
| A | 13 | 254 | 7903 | 65.28 | 558 | 548 | 112.7 |
| A | 3 | 137 | 5554 | 44.43 | 558 | 548 | 112.7 |
| A | 0 | 226 | 4773 | 37.5 | 558 | 548 | 112.7 |
| B | 6 | 159 | 1182417 | 11254.53 | 547 | 534 | 105.0 |
| B | 0 | 190 | 29750 | 278.21 | 547 | 534 | 105.0 |
| B | 5 | 255 | 13575 | 124.18 | 547 | 534 | 105.0 |
| C | 3 | 233 | 1205472 | 9894.27 | 521 | 524 | 121.8 |
| C | 14 | 238 | 84325 | 688.12 | 521 | 524 | 121.8 |
| C | 0 | 10 | 48639 | 395.09 | 521 | 524 | 121.8 |
| D | 8 | 195 | 767642 | 6036.21 | 533 | 521 | 127.1 |
| D | 13 | 138 | 33667 | 260.81 | 533 | 521 | 127.1 |
| D | 10 | 253 | 32493 | 251.58 | 533 | 521 | 127.1 |
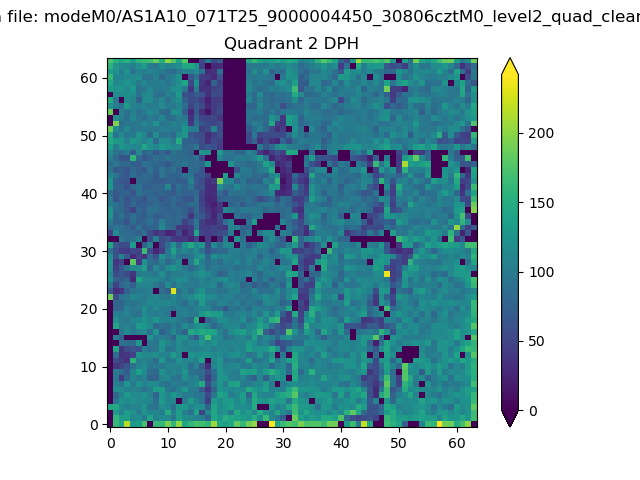
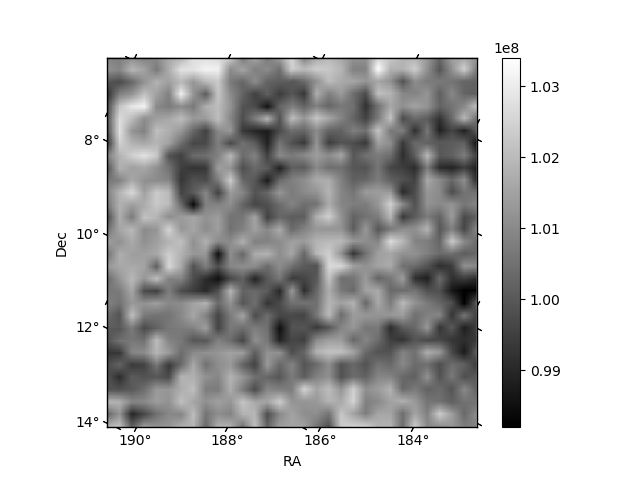
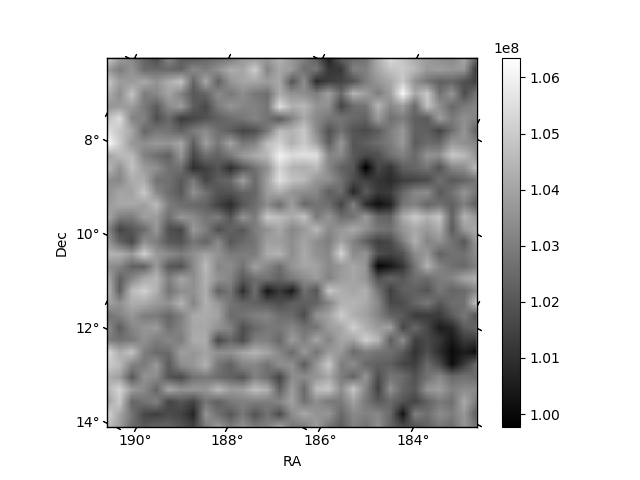
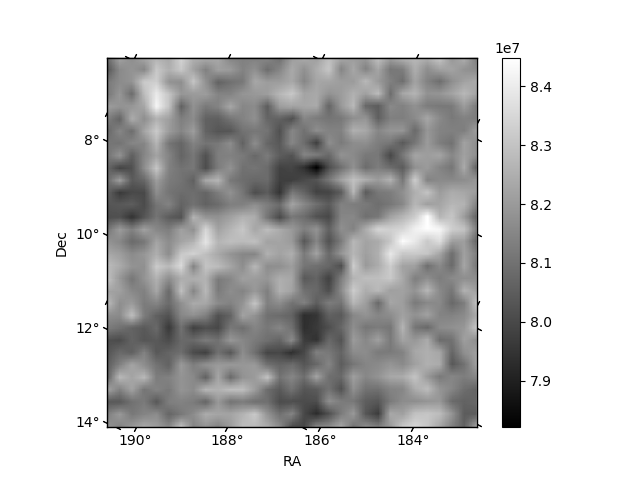
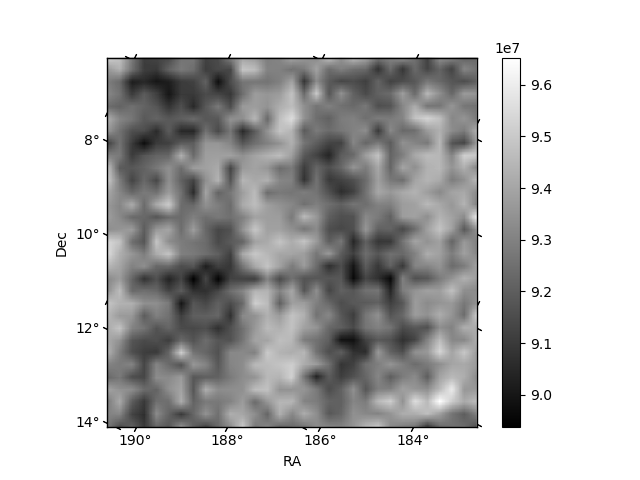
Histogram calculated using DETX and DETY for each event in the final _common_clean file
| Quadrant A | 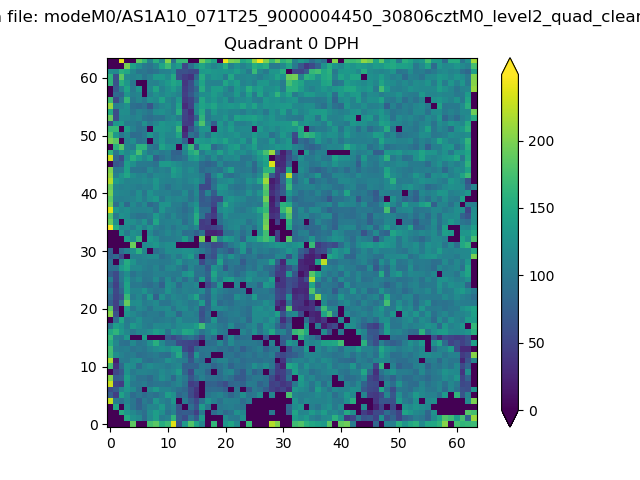 |
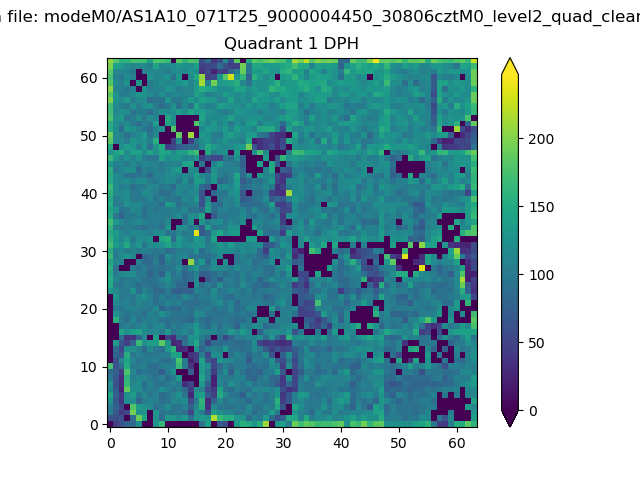 |
Quadrant B |
|---|---|---|---|
| Quadrant D | 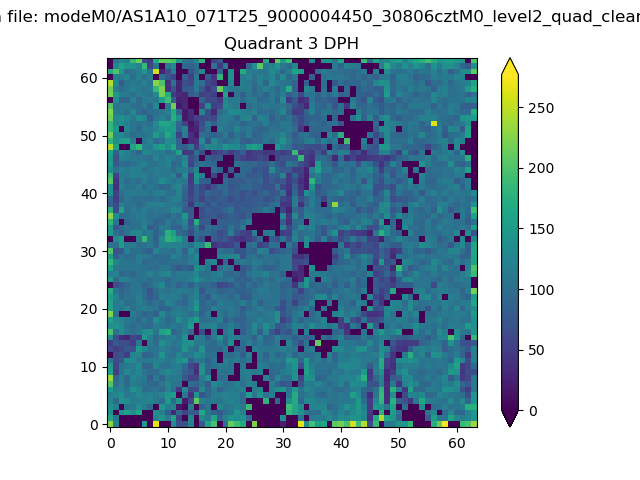 |
 |
Quadrant C |
| Plot type | Count rate plots | Images |
|---|---|---|
| Comparison with Poisson distribution Blue bars denote a histogram of data divided into 1 sec bins. Red curve is a Poisson curve with rate = median count rate of data. |
 |
 |
| Quadrant-wise count rates Data is divided into 100 sec bins |
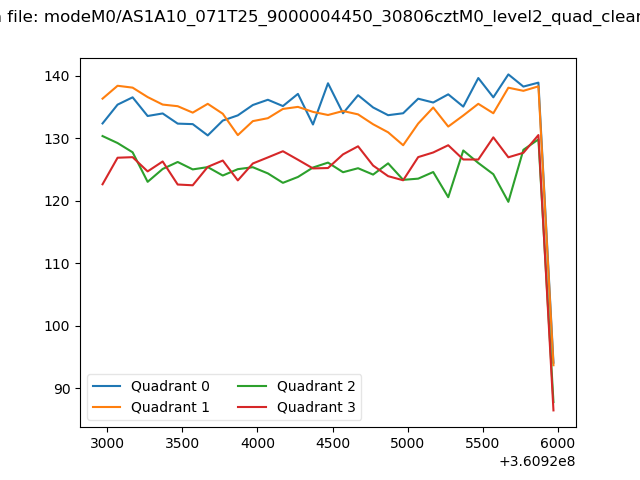 |
|
| Module-wise count rates for Quadrant A Data is divided into 100 sec bins |
 |
 |
| Module-wise count rates for Quadrant B Data is divided into 100 sec bins |
 |
 |
| Module-wise count rates for Quadrant C Data is divided into 100 sec bins |
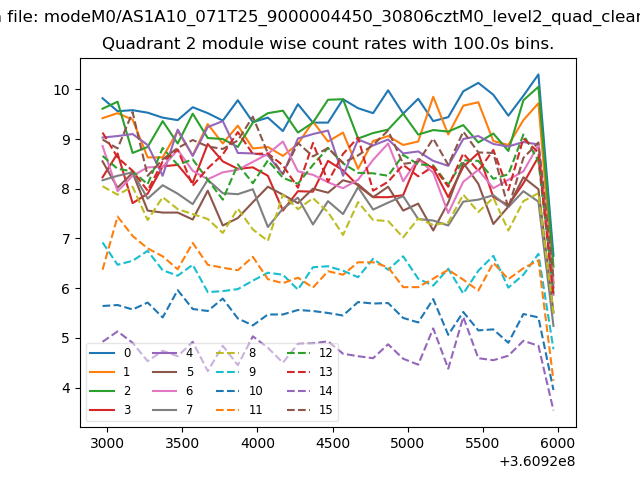 |
 |
| Module-wise count rates for Quadrant D Data is divided into 100 sec bins |
 |
 |
| Parameter | Plot |
|---|---|
| CZT HV Monitor |  |
| D_VDD | 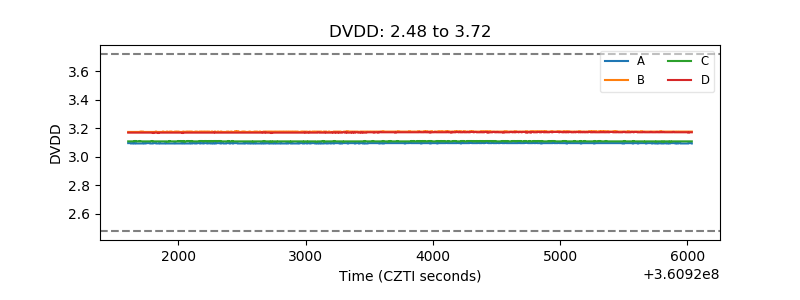 |
| Temperature 1 | 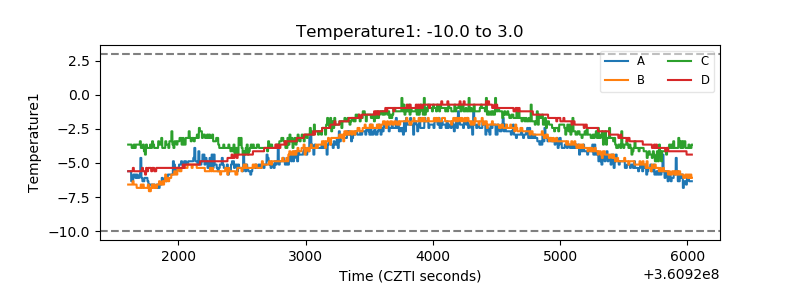 |
| Veto HV Monitor | 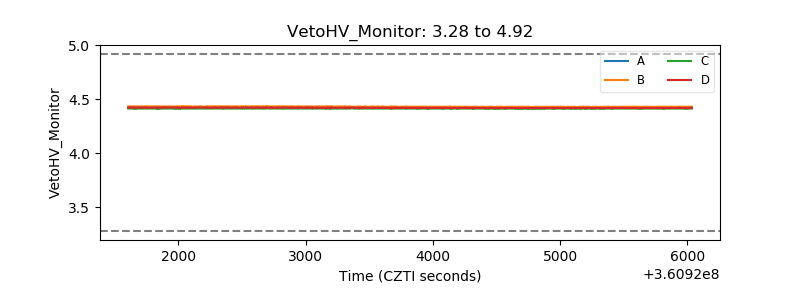 |
| Veto LLD | 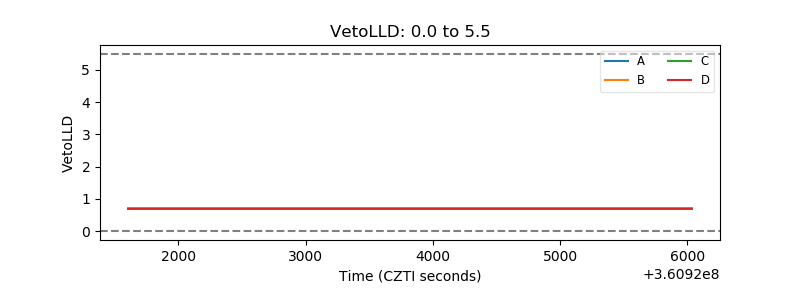 |
| Alpha Counter | 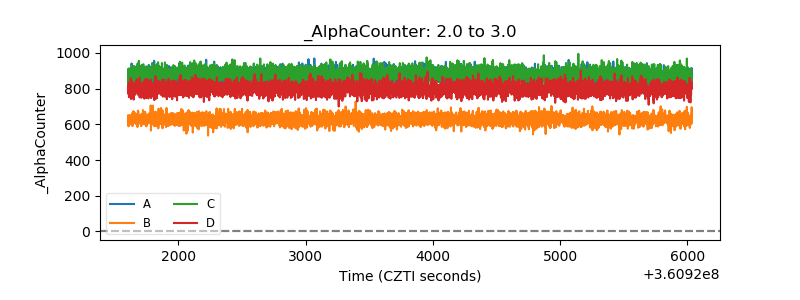 |
| _CPM_Rate | 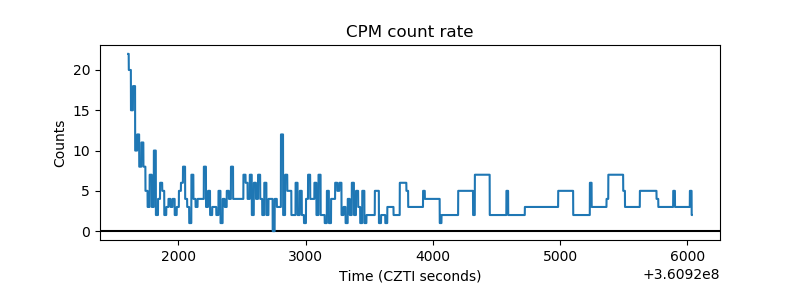 |
| CZT Counter | 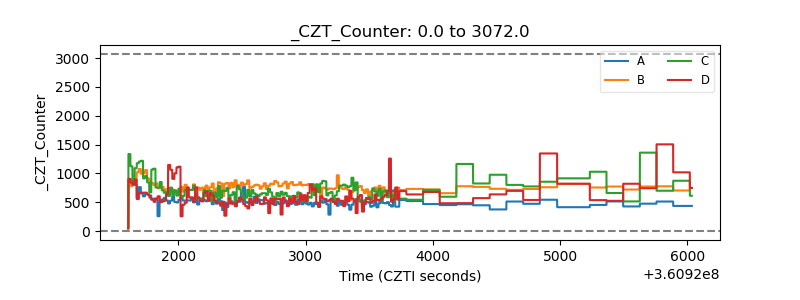 |
| +2.5 Volts monitor |  |
| +5 Volts monitor |  |
| _ROLL_ROT |  |
| _Roll_DEC | 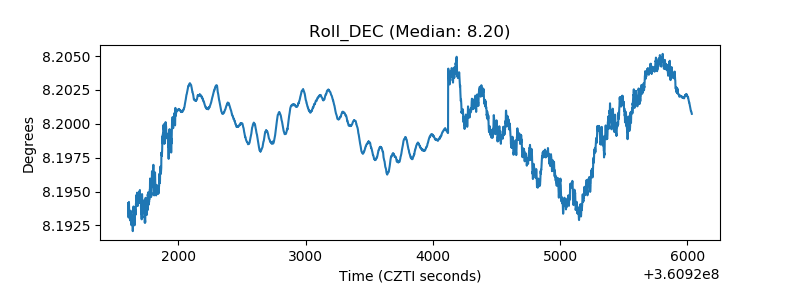 |
| _Roll_RA |  |
| Veto Counter | 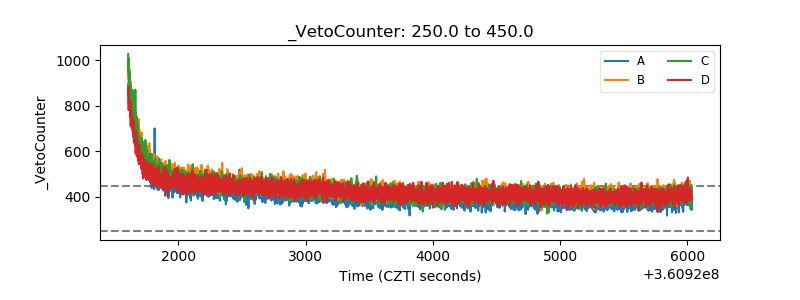 |