| Param | Original file | Final file |
|---|---|---|
| Filename | modeM0/AS1C06_003T01_9000004452cztM0_level2.fits | modeM0/AS1C06_003T01_9000004452cztM0_level2_quad_clean.evt |
| Size (bytes) | 765,501,120 | 864,996,480 |
| Size | 730.0 MB | 824.9 MB |
| Events in quadrant A | 4,851,570 | 5,666,135 |
| Events in quadrant B | 4,513,770 | 5,544,895 |
| Events in quadrant C | 4,582,892 | 5,301,412 |
| Events in quadrant D | 3,741,740 | 4,198,684 |
| Mode M9 | |||
|---|---|---|---|
| Quadrant | BADHDUFLAG | Total packets | Discarded packets |
| A | 0 | 125 | 0 |
| B | 0 | 125 | 0 |
| C | 0 | 125 | 0 |
| D | 0 | 125 | 0 |
| Mode M0 | |||
|---|---|---|---|
| Quadrant | BADHDUFLAG | Total packets | Discarded packets |
| A | 0 | 172849 | 0 |
| B | 0 | 252228 | 0 |
| C | 0 | 188066 | 0 |
| D | 0 | 299780 | 0 |
| Mode SS | |||
|---|---|---|---|
| Quadrant | BADHDUFLAG | Total packets | Discarded packets |
| A | 0 | 1630 | 0 |
| B | 0 | 1630 | 0 |
| C | 0 | 1630 | 0 |
| D | 0 | 1630 | 0 |
| Quadrant | Total seconds | Saturated seconds | Saturation percentage |
|---|---|---|---|
| A | 80033 | 1607 | 2.007922% |
| B | 80033 | 2965 | 3.704722% |
| C | 80033 | 2466 | 3.081229% |
| D | 80033 | 11325 | 14.150413% |
Noise dominated data is calculated using 1-second bins in cleaned event files. If a bin has >2000 counts, and if more than 50% of those come from <1% of pixels, then it is considered to be noise-dominated and hence unusable.
| Quadrant | # 1 sec bins | Bins with >0 counts | Bins with >2000 counts | High rate bins dominated by noise | Noise dominated (total time) | Noise dominated (detector-on time) | Marked lightcurve |
|---|---|---|---|---|---|---|---|
| A | 92328 | 80021 | 0 | 0 | 0.00% | 0.00% |  |
| B | 92328 | 79992 | 0 | 0 | 0.00% | 0.00% | 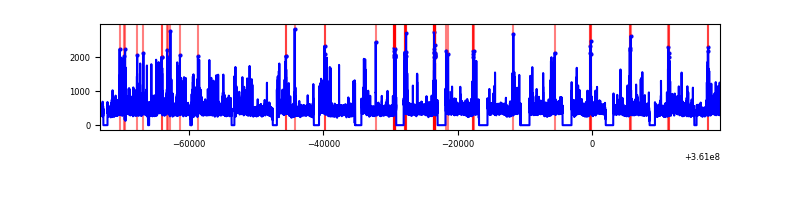 |
| C | 92328 | 80015 | 0 | 0 | 0.00% | 0.00% |  |
| D | 92328 | 79603 | 0 | 0 | 0.00% | 0.00% |  |
Top three noisy pixels from each quadrant. If the there are fewer than three noisy pixels in the level2.evt file, extra rows are filled as -1
| Pixel properties | Quadrant properties | ||||||
|---|---|---|---|---|---|---|---|
| Quadrant | DetID | PixID | Counts | Sigma | Mean | Median | Sigma |
| A | 0 | 29 | 3980 | 9.18 | 1263 | 1195 | 303.2 |
| A | 7 | 110 | 3922 | 8.99 | 1263 | 1195 | 303.2 |
| A | 9 | 19 | 3577 | 7.85 | 1263 | 1195 | 303.2 |
| B | 2 | 9 | 3591 | 10.5 | 1198 | 1150 | 232.5 |
| B | 3 | 80 | 3061 | 8.22 | 1198 | 1150 | 232.5 |
| B | 2 | 8 | 3026 | 8.07 | 1198 | 1150 | 232.5 |
| C | 12 | 241 | 3277 | 6.99 | 1214 | 1140 | 305.5 |
| C | 3 | 187 | 3176 | 6.66 | 1214 | 1140 | 305.5 |
| C | 9 | 209 | 3051 | 6.26 | 1214 | 1140 | 305.5 |
| D | 7 | 3 | 2651 | 5.89 | 1071 | 978 | 284.3 |
| D | 10 | 189 | 2617 | 5.77 | 1071 | 978 | 284.3 |
| D | 6 | 231 | 2594 | 5.68 | 1071 | 978 | 284.3 |
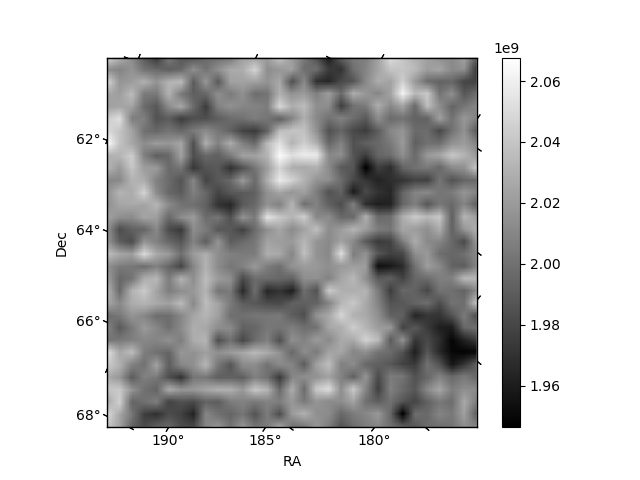
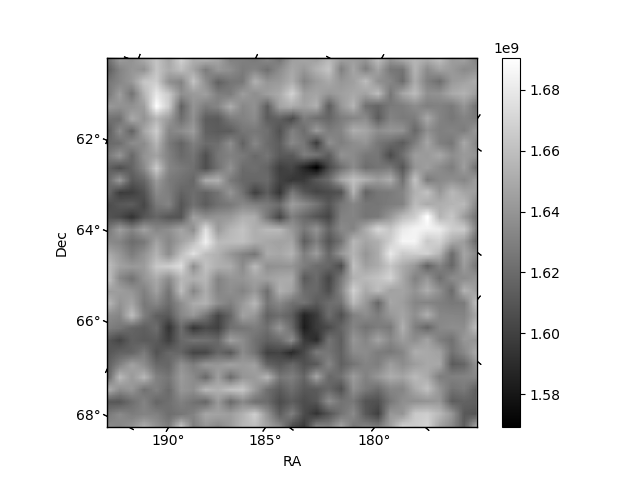
Histogram calculated using DETX and DETY for each event in the final _common_clean file
| Quadrant A |  |
 |
Quadrant B |
|---|---|---|---|
| Quadrant D |  |
 |
Quadrant C |
| Plot type | Count rate plots | Images |
|---|---|---|
| Comparison with Poisson distribution Blue bars denote a histogram of data divided into 1 sec bins. Red curve is a Poisson curve with rate = median count rate of data. |
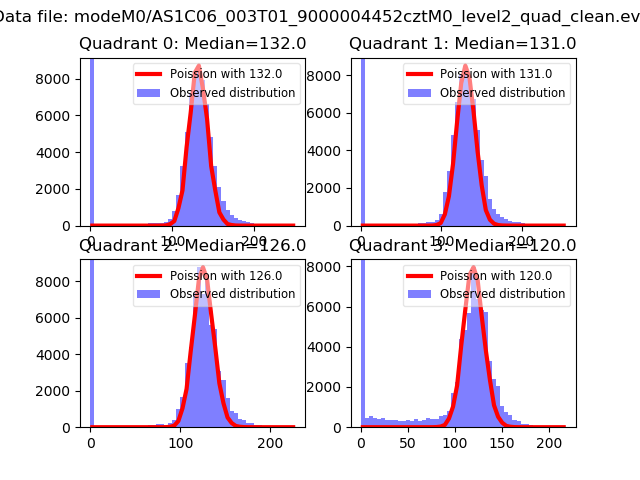 |
 |
| Quadrant-wise count rates Data is divided into 100 sec bins |
 |
|
| Module-wise count rates for Quadrant A Data is divided into 100 sec bins |
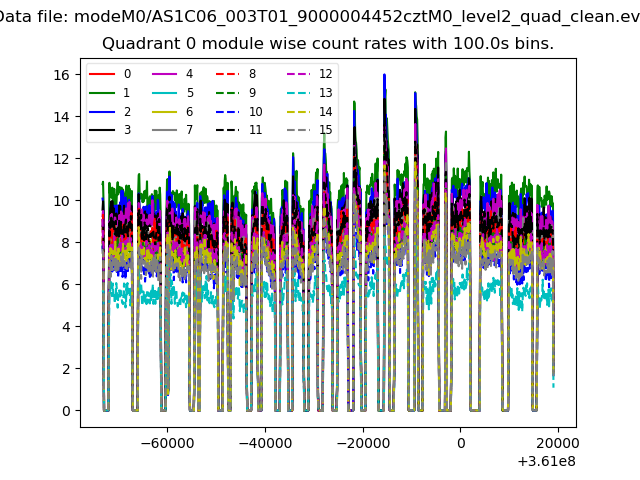 |
 |
| Module-wise count rates for Quadrant B Data is divided into 100 sec bins |
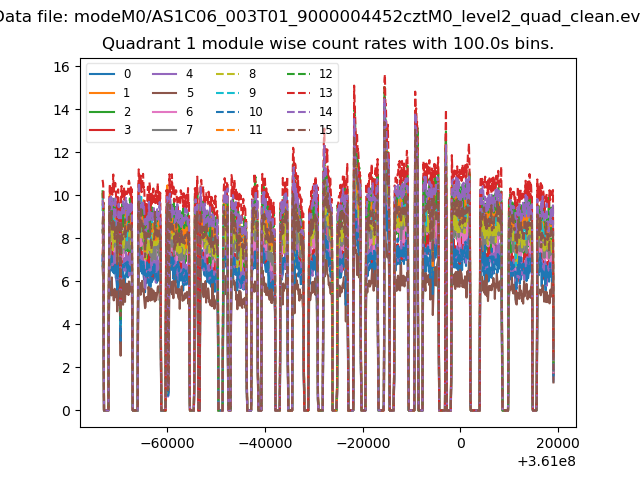 |
 |
| Module-wise count rates for Quadrant C Data is divided into 100 sec bins |
 |
 |
| Module-wise count rates for Quadrant D Data is divided into 100 sec bins |
 |
 |
| Parameter | Plot |
|---|---|
| CZT HV Monitor |  |
| D_VDD | 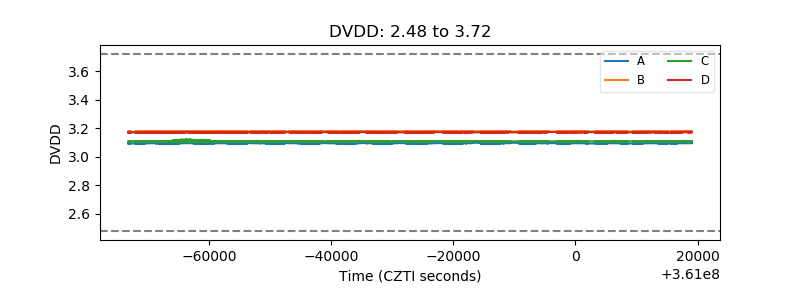 |
| Temperature 1 |  |
| Veto HV Monitor |  |
| Veto LLD | 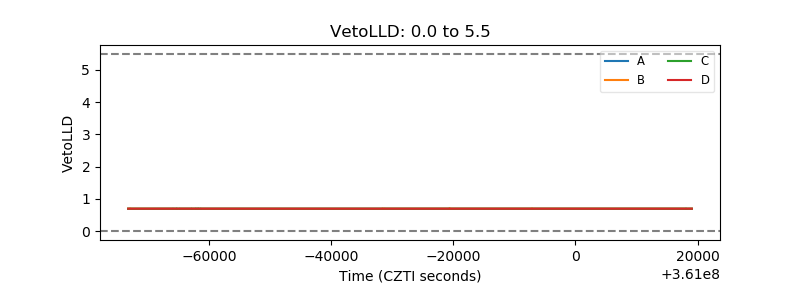 |
| Alpha Counter |  |
| _CPM_Rate | 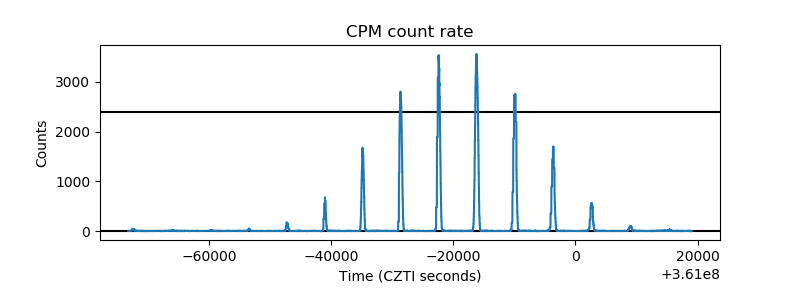 |
| CZT Counter | 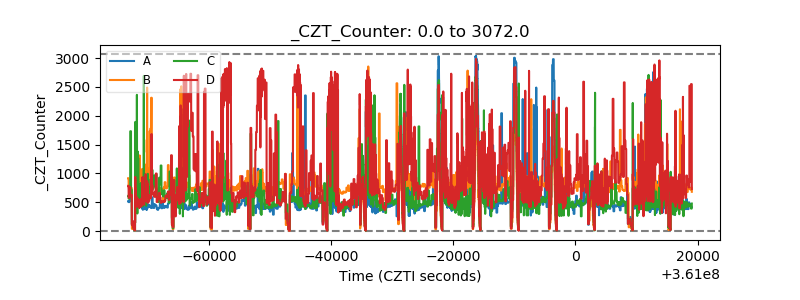 |
| +2.5 Volts monitor |  |
| +5 Volts monitor |  |
| _ROLL_ROT |  |
| _Roll_DEC |  |
| _Roll_RA | 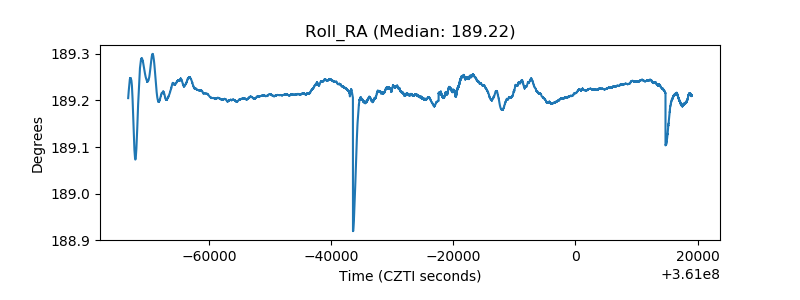 |
| Veto Counter |  |