| Param | Original file | Final file |
|---|---|---|
| Filename | modeM0/AS1C06_003T01_9000004452_30806cztM0_level2.evt | modeM0/AS1C06_003T01_9000004452_30806cztM0_level2_quad_clean.evt |
| Size (bytes) | 176,996,160 | 30,692,160 |
| Size | 168.8 MB | 29.3 MB |
| Events in quadrant A | 1,037,156 | 201,577 |
| Events in quadrant B | 1,511,864 | 204,691 |
| Events in quadrant C | 1,438,342 | 189,985 |
| Events in quadrant D | 1,237,676 | 190,354 |
| Mode M9 | |||
|---|---|---|---|
| Quadrant | BADHDUFLAG | Total packets | Discarded packets |
| A | 0 | 7 | 0 |
| B | 0 | 7 | 0 |
| C | 0 | 7 | 0 |
| D | 0 | 7 | 0 |
| Mode M0 | |||
|---|---|---|---|
| Quadrant | BADHDUFLAG | Total packets | Discarded packets |
| A | 0 | 4304 | 1 |
| B | 0 | 5971 | 1 |
| C | 0 | 5661 | 1 |
| D | 0 | 4853 | 1 |
| Mode SS | |||
|---|---|---|---|
| Quadrant | BADHDUFLAG | Total packets | Discarded packets |
| A | 0 | 40 | 0 |
| B | 0 | 40 | 0 |
| C | 0 | 40 | 0 |
| D | 0 | 40 | 0 |
| Quadrant | Total seconds | Saturated seconds | Saturation percentage |
|---|---|---|---|
| A | 1960 | 92 | 4.693878% |
| B | 1960 | 180 | 9.183673% |
| C | 1959 | 231 | 11.791730% |
| D | 1959 | 118 | 6.023481% |
Noise dominated data is calculated using 1-second bins in cleaned event files. If a bin has >2000 counts, and if more than 50% of those come from <1% of pixels, then it is considered to be noise-dominated and hence unusable.
| Quadrant | # 1 sec bins | Bins with >0 counts | Bins with >2000 counts | High rate bins dominated by noise | Noise dominated (total time) | Noise dominated (detector-on time) | Marked lightcurve |
|---|---|---|---|---|---|---|---|
| A | 2585 | 1960 | 0 | 0 | 0.00% | 0.00% | 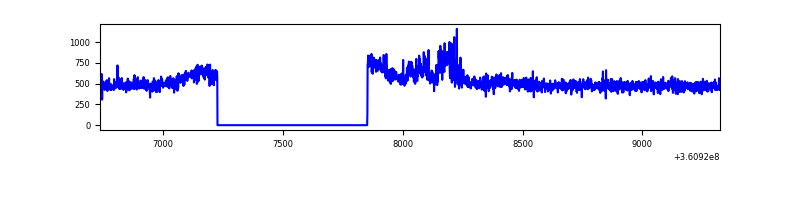 |
| B | 2585 | 1960 | 0 | 0 | 0.00% | 0.00% | 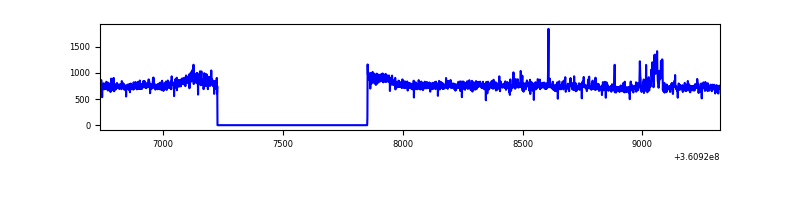 |
| C | 2584 | 1959 | 37 | 37 | 1.43% | 1.89% | 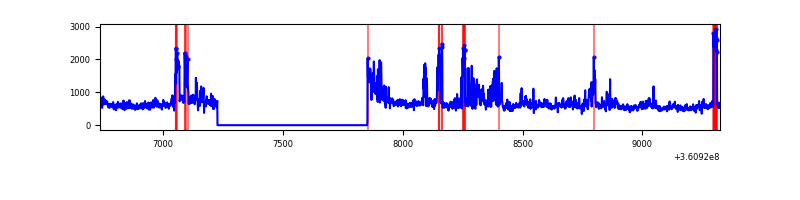 |
| D | 2584 | 1960 | 42 | 42 | 1.63% | 2.14% | 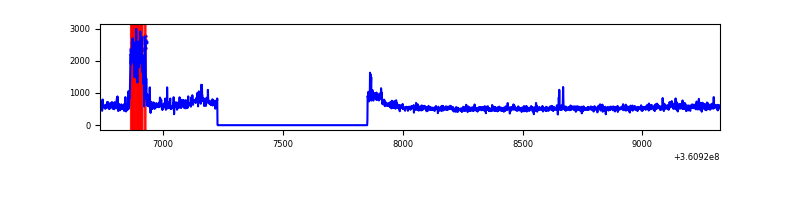 |
Top three noisy pixels from each quadrant. If the there are fewer than three noisy pixels in the level2.evt file, extra rows are filled as -1
| Pixel properties | Quadrant properties | ||||||
|---|---|---|---|---|---|---|---|
| Quadrant | DetID | PixID | Counts | Sigma | Mean | Median | Sigma |
| A | 12 | 96 | 49836 | 928.29 | 256 | 250 | 53.4 |
| A | 13 | 254 | 3172 | 54.7 | 256 | 250 | 53.4 |
| A | 3 | 137 | 2694 | 45.75 | 256 | 250 | 53.4 |
| B | 6 | 159 | 486366 | 9784.57 | 250 | 242 | 49.7 |
| B | 0 | 190 | 31274 | 624.6 | 250 | 242 | 49.7 |
| B | 12 | 111 | 6155 | 119.02 | 250 | 242 | 49.7 |
| C | 3 | 233 | 393391 | 7076.59 | 233 | 232 | 55.6 |
| C | 0 | 10 | 81574 | 1464.1 | 233 | 232 | 55.6 |
| C | 14 | 238 | 38725 | 692.85 | 233 | 232 | 55.6 |
| D | 8 | 195 | 188617 | 3202.62 | 241 | 233 | 58.8 |
| D | 10 | 253 | 121447 | 2060.69 | 241 | 233 | 58.8 |
| D | 2 | 234 | 6862 | 112.7 | 241 | 233 | 58.8 |
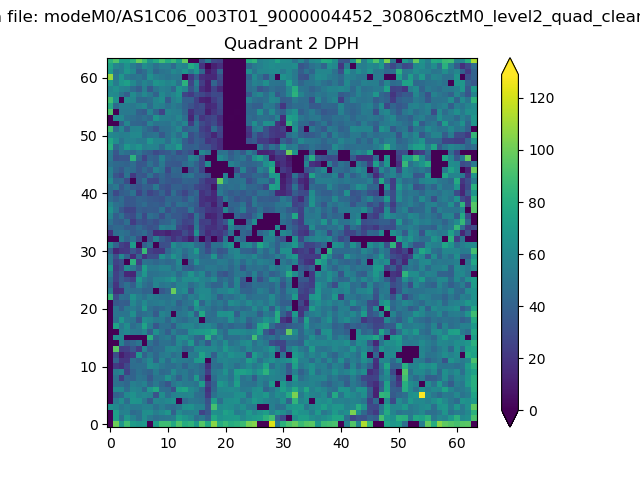
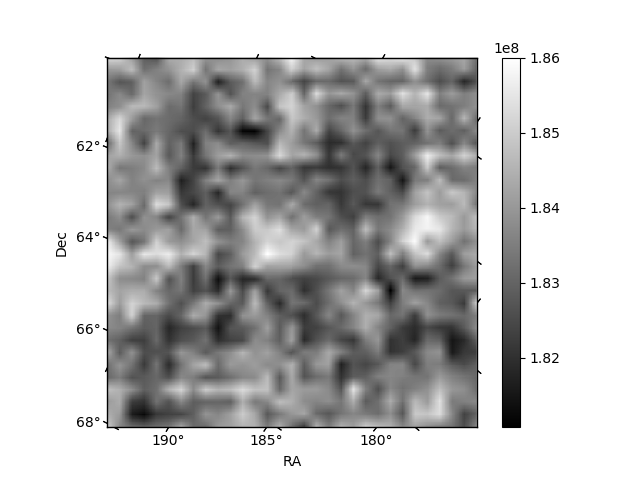
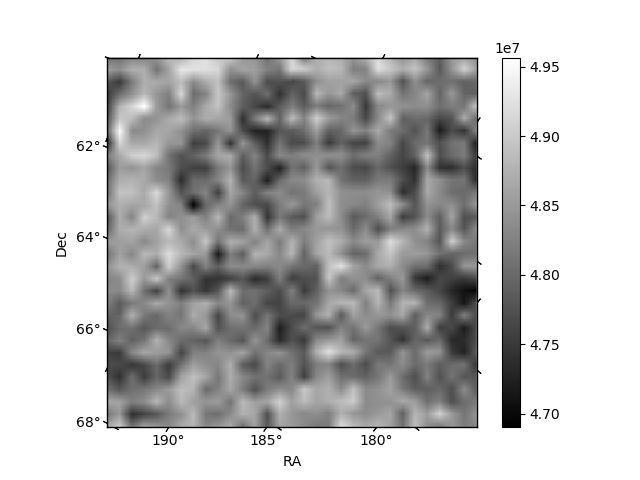
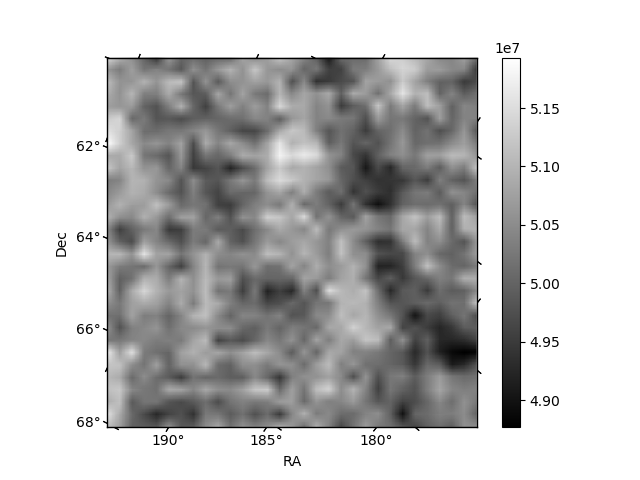
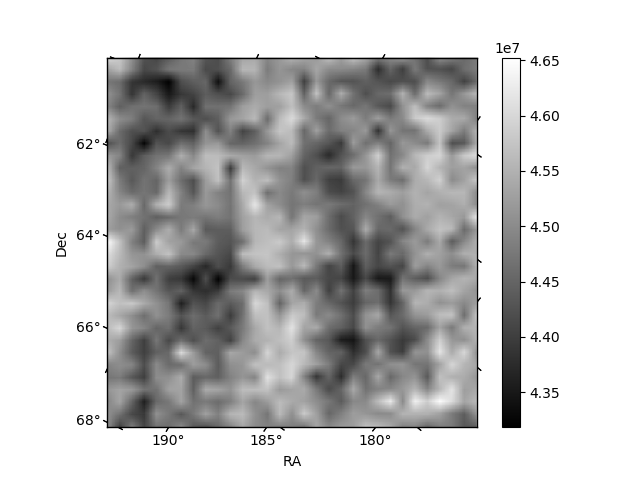
Histogram calculated using DETX and DETY for each event in the final _common_clean file
| Quadrant A | 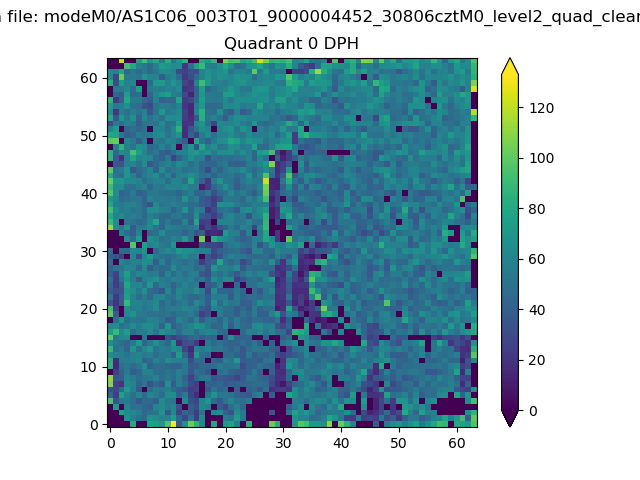 |
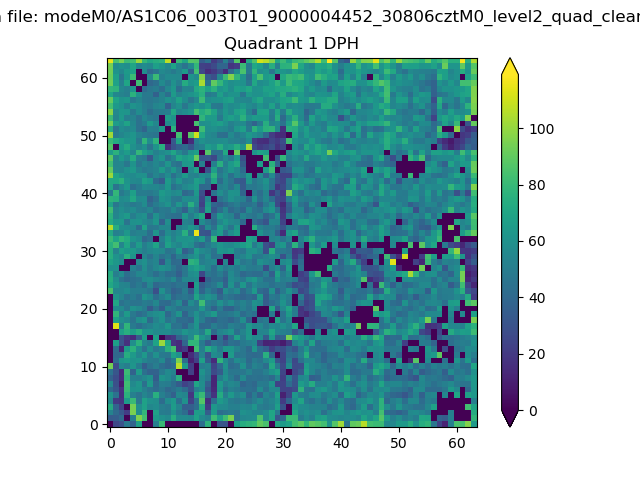 |
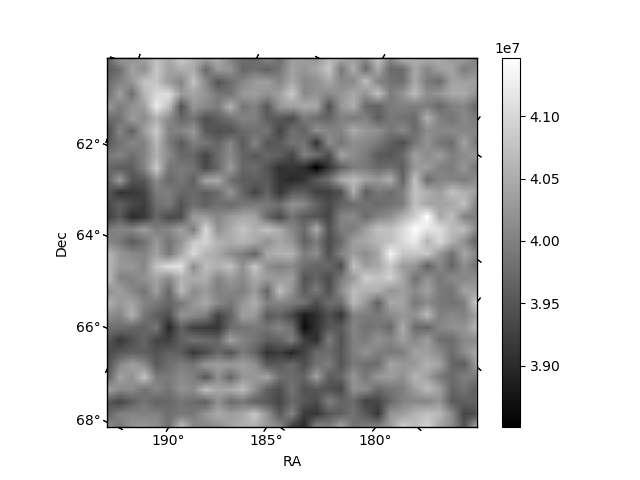
Quadrant B |
|---|---|---|---|
| Quadrant D | 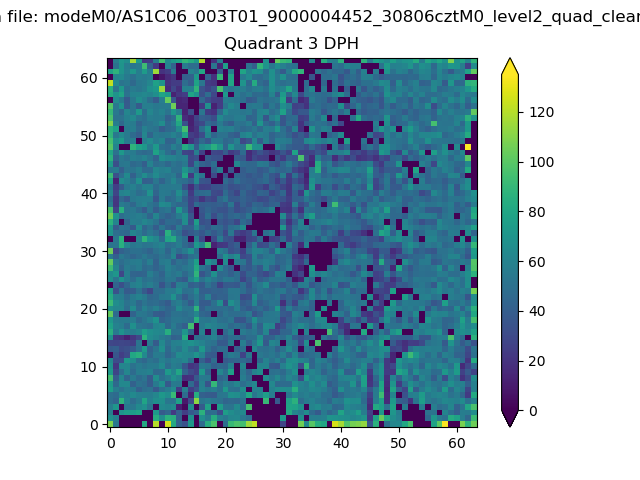 |
 |
Quadrant C |
| Plot type | Count rate plots | Images |
|---|---|---|
| Comparison with Poisson distribution Blue bars denote a histogram of data divided into 1 sec bins. Red curve is a Poisson curve with rate = median count rate of data. |
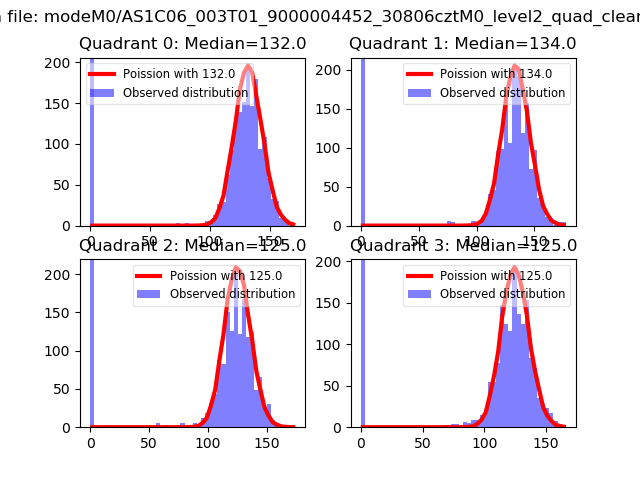 |
 |
| Quadrant-wise count rates Data is divided into 100 sec bins |
 |
|
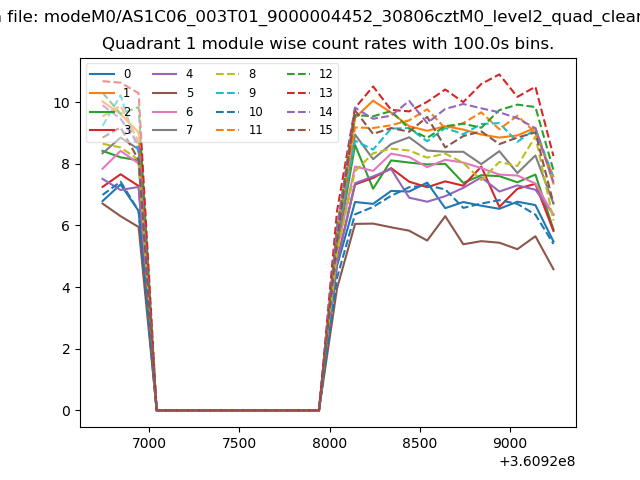
| Module-wise count rates for Quadrant A Data is divided into 100 sec bins |
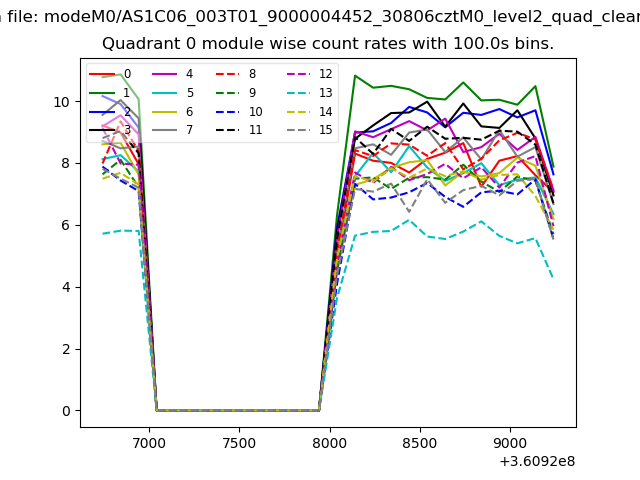 |
 |
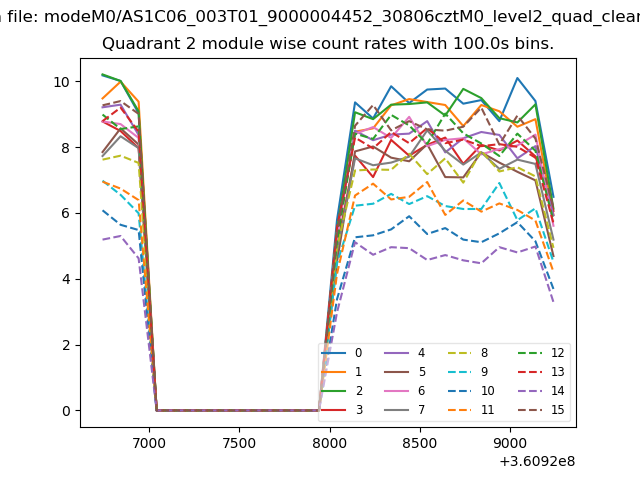
| Module-wise count rates for Quadrant B Data is divided into 100 sec bins |
 |
 |
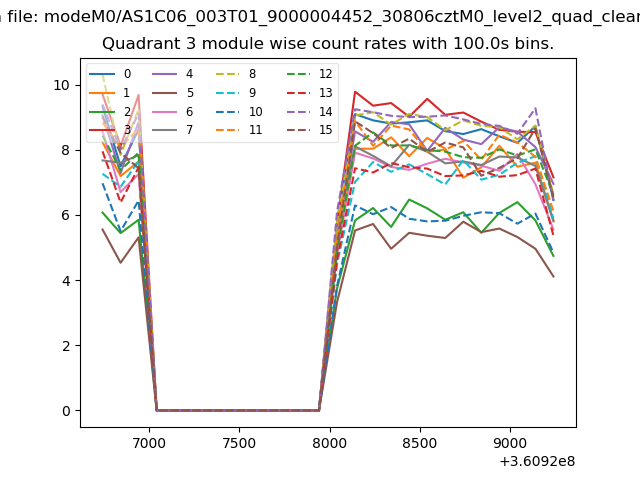
| Module-wise count rates for Quadrant C Data is divided into 100 sec bins |
 |
 |
| Module-wise count rates for Quadrant D Data is divided into 100 sec bins |
 |
 |
| Parameter | Plot |
|---|---|
| CZT HV Monitor | 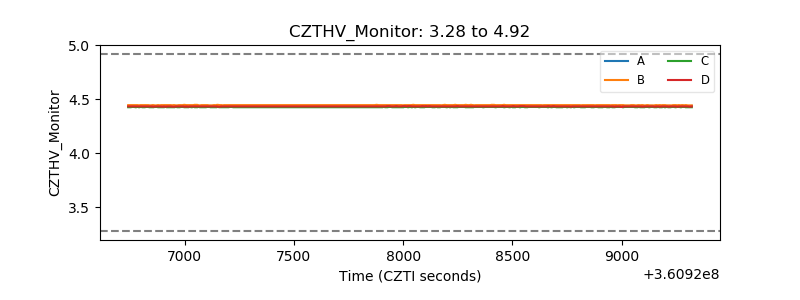 |
| D_VDD | 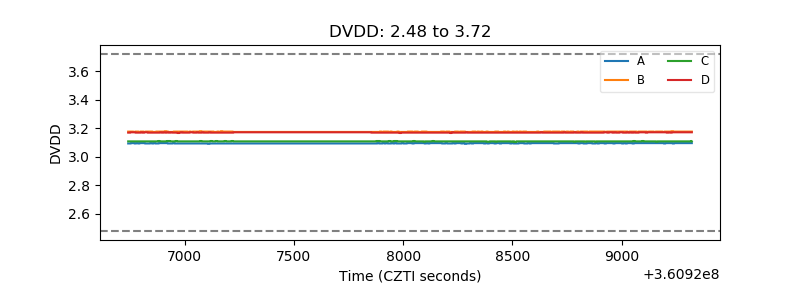 |
| Temperature 1 | 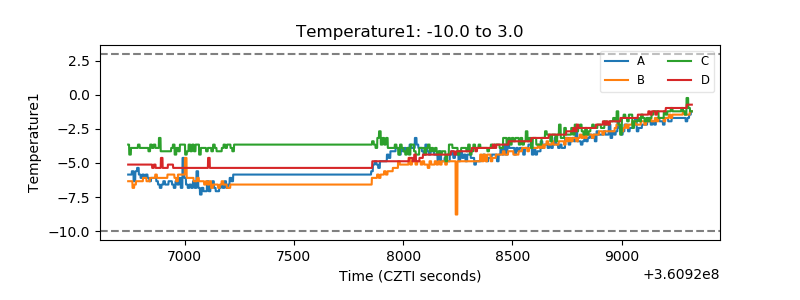 |
| Veto HV Monitor | 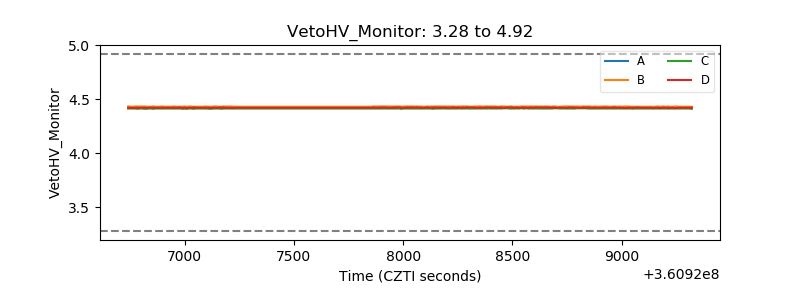 |
| Veto LLD | 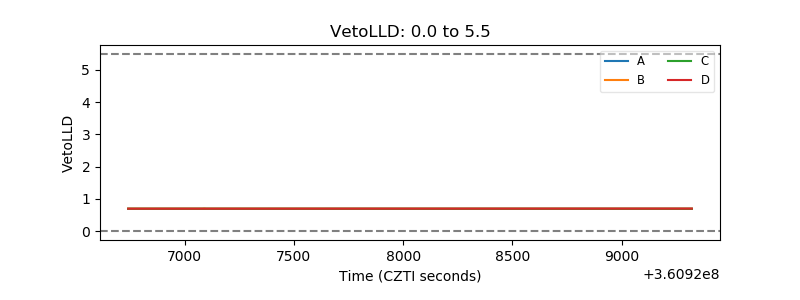 |
| Alpha Counter | 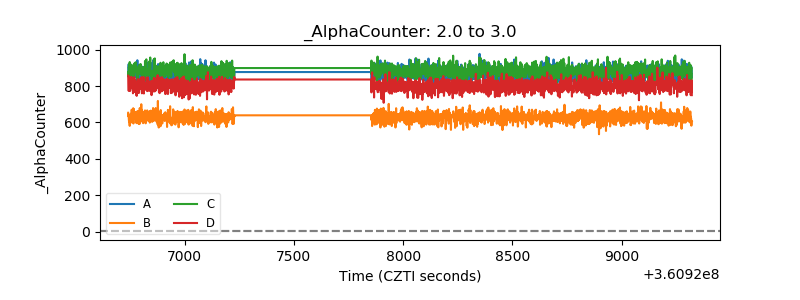 |
| _CPM_Rate | 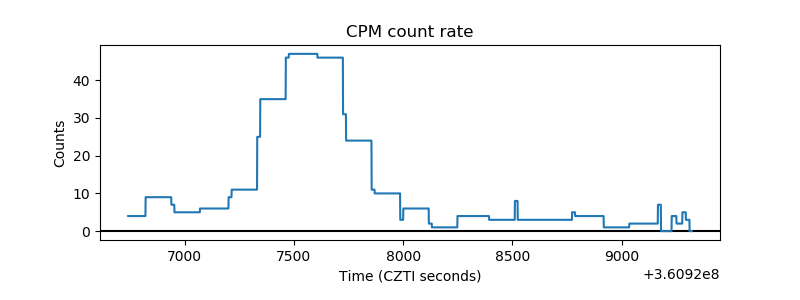 |
| CZT Counter | 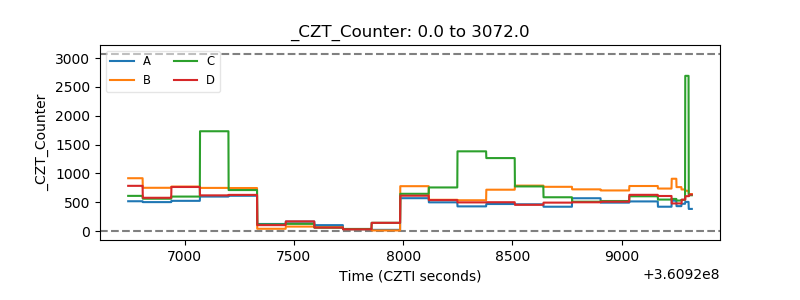 |
| +2.5 Volts monitor |  |
| +5 Volts monitor |  |
| _ROLL_ROT | 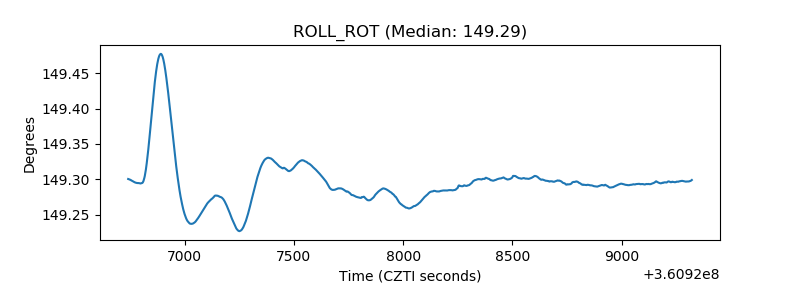 |
| _Roll_DEC | 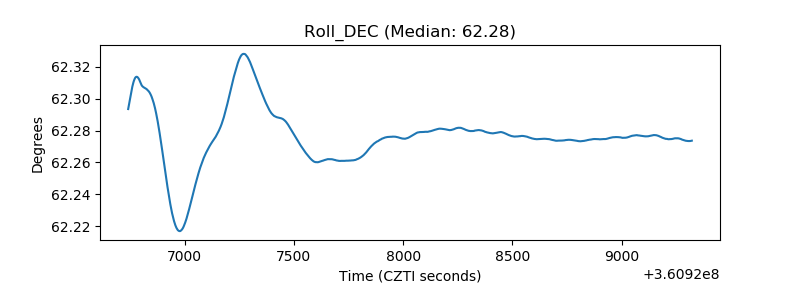 |
| _Roll_RA | 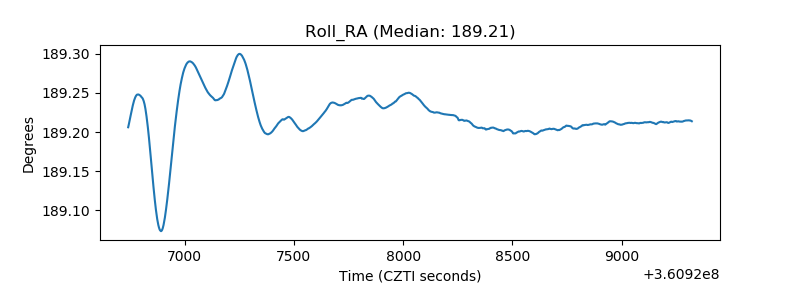 |
| Veto Counter | 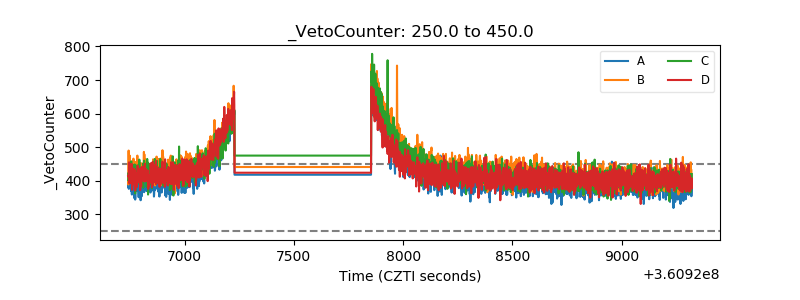 |