| Param | Original file | Final file |
|---|---|---|
| Filename | modeM0/AS1C06_003T01_9000004452_30811cztM0_level2.evt | modeM0/AS1C06_003T01_9000004452_30811cztM0_level2_quad_clean.evt |
| Size (bytes) | 1,895,060,160 | 267,505,920 |
| Size | 1.8 GB | 255.1 MB |
| Events in quadrant A | 8,953,915 | 1,871,349 |
| Events in quadrant B | 14,293,641 | 1,851,699 |
| Events in quadrant C | 10,307,219 | 1,782,669 |
| Events in quadrant D | 22,641,924 | 1,368,844 |
| Mode M9 | |||
|---|---|---|---|
| Quadrant | BADHDUFLAG | Total packets | Discarded packets |
| A | 0 | 19 | 0 |
| B | 0 | 19 | 0 |
| C | 0 | 19 | 0 |
| D | 0 | 19 | 0 |
| Mode M0 | |||
|---|---|---|---|
| Quadrant | BADHDUFLAG | Total packets | Discarded packets |
| A | 0 | 38538 | 3 |
| B | 0 | 55456 | 3 |
| C | 0 | 42408 | 3 |
| D | 0 | 79620 | 3 |
| Mode SS | |||
|---|---|---|---|
| Quadrant | BADHDUFLAG | Total packets | Discarded packets |
| A | 0 | 360 | 0 |
| B | 0 | 360 | 0 |
| C | 0 | 360 | 0 |
| D | 0 | 360 | 0 |
| Quadrant | Total seconds | Saturated seconds | Saturation percentage |
|---|---|---|---|
| A | 17783 | 288 | 1.619524% |
| B | 17783 | 366 | 2.058145% |
| C | 17783 | 407 | 2.288703% |
| D | 17783 | 5476 | 30.793454% |
Noise dominated data is calculated using 1-second bins in cleaned event files. If a bin has >2000 counts, and if more than 50% of those come from <1% of pixels, then it is considered to be noise-dominated and hence unusable.
| Quadrant | # 1 sec bins | Bins with >0 counts | Bins with >2000 counts | High rate bins dominated by noise | Noise dominated (total time) | Noise dominated (detector-on time) | Marked lightcurve |
|---|---|---|---|---|---|---|---|
| A | 19623 | 17784 | 147 | 147 | 0.75% | 0.83% | 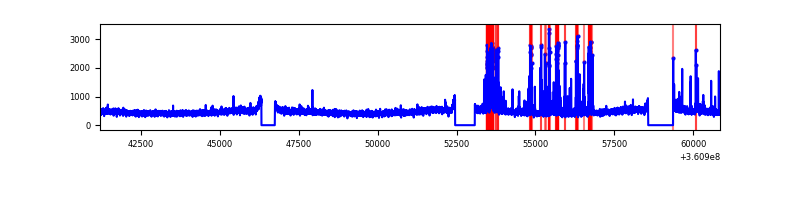 |
| B | 19623 | 17784 | 69 | 69 | 0.35% | 0.39% | 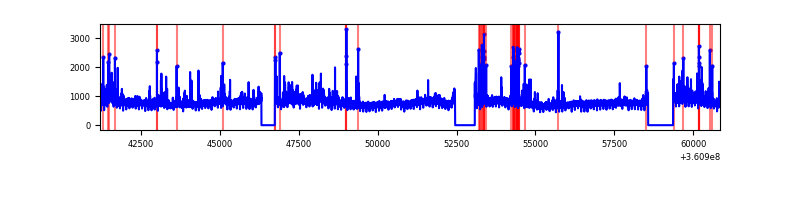 |
| C | 19623 | 17784 | 67 | 67 | 0.34% | 0.38% |  |
| D | 19623 | 17784 | 5129 | 5129 | 26.14% | 28.84% | 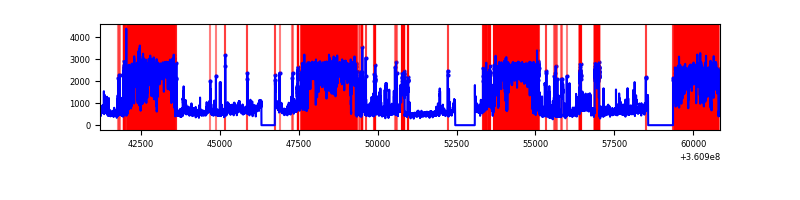 |
Top three noisy pixels from each quadrant. If the there are fewer than three noisy pixels in the level2.evt file, extra rows are filled as -1
| Pixel properties | Quadrant properties | ||||||
|---|---|---|---|---|---|---|---|
| Quadrant | DetID | PixID | Counts | Sigma | Mean | Median | Sigma |
| A | 0 | 13 | 830927 | 1966.39 | 2103 | 2057 | 421.5 |
| A | 13 | 254 | 33897 | 75.54 | 2103 | 2057 | 421.5 |
| A | 3 | 137 | 20756 | 44.36 | 2103 | 2057 | 421.5 |
| B | 6 | 159 | 5262787 | 13477.2 | 2079 | 2026 | 390.3 |
| B | 4 | 80 | 252287 | 641.13 | 2079 | 2026 | 390.3 |
| B | 5 | 172 | 169696 | 429.54 | 2079 | 2026 | 390.3 |
| C | 3 | 233 | 1703800 | 3625.74 | 2015 | 2029 | 469.4 |
| C | 0 | 10 | 362496 | 768.0 | 2015 | 2029 | 469.4 |
| C | 14 | 238 | 322400 | 682.57 | 2015 | 2029 | 469.4 |
| D | 12 | 218 | 9638294 | 23992.98 | 1696 | 1656 | 401.6 |
| D | 8 | 195 | 4456960 | 11092.66 | 1696 | 1656 | 401.6 |
| D | 2 | 250 | 855703 | 2126.38 | 1696 | 1656 | 401.6 |
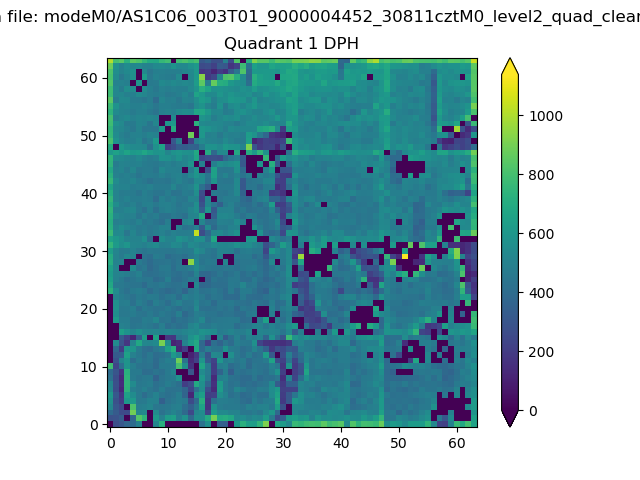
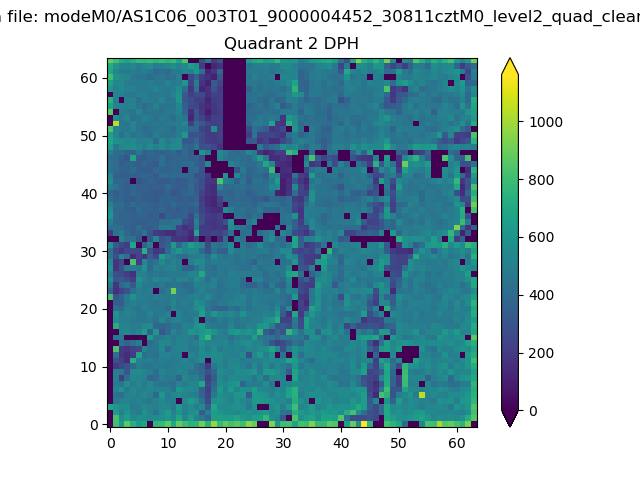
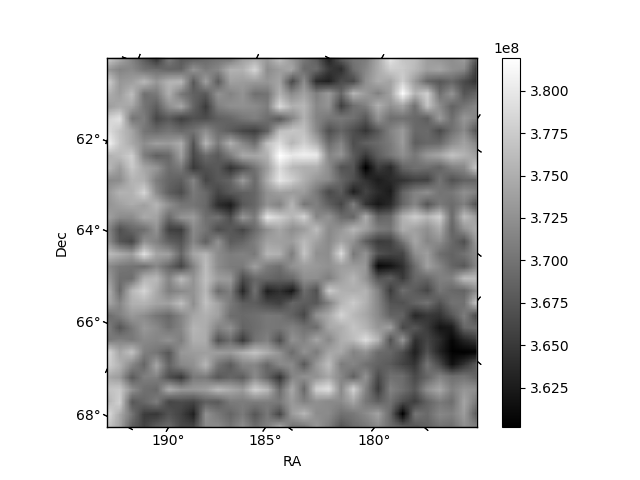
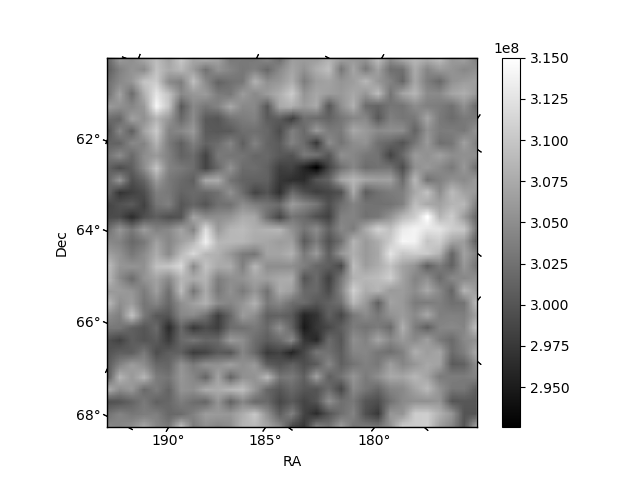
Histogram calculated using DETX and DETY for each event in the final _common_clean file
| Quadrant A | 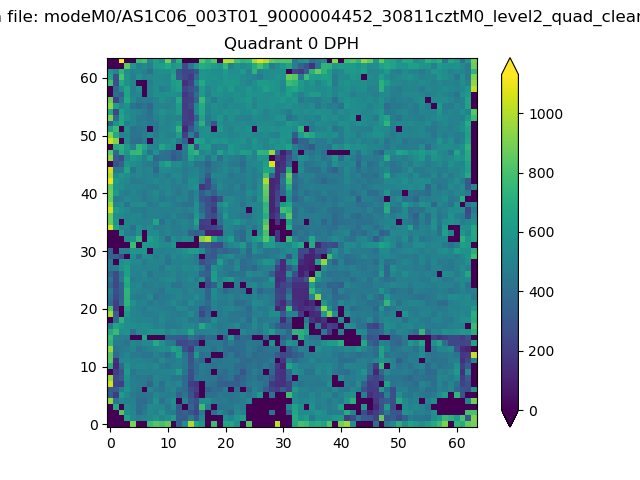 |
 |
Quadrant B |
|---|---|---|---|
| Quadrant D | 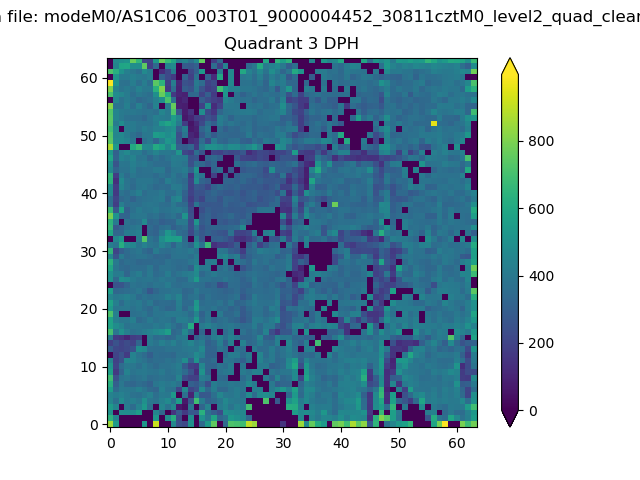 |
 |
Quadrant C |
| Plot type | Count rate plots | Images |
|---|---|---|
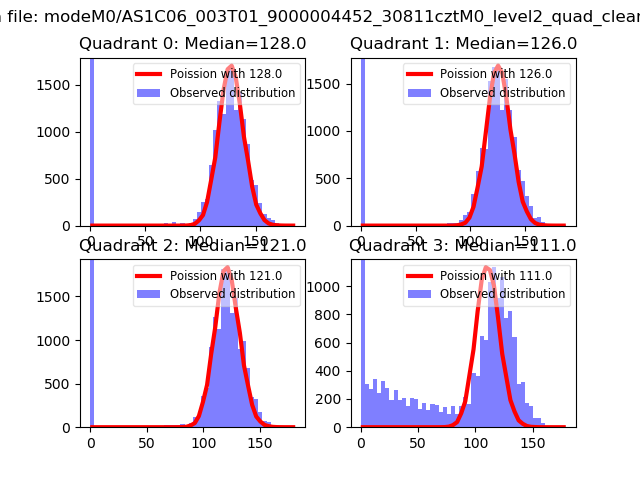
| Comparison with Poisson distribution Blue bars denote a histogram of data divided into 1 sec bins. Red curve is a Poisson curve with rate = median count rate of data. |
 |
 |
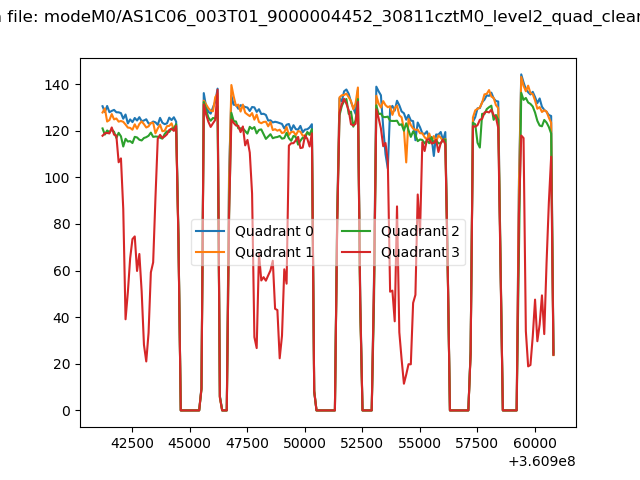
| Quadrant-wise count rates Data is divided into 100 sec bins |
 |
|
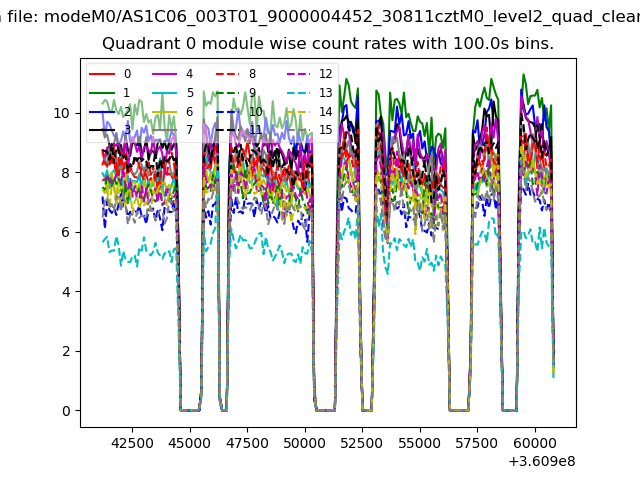
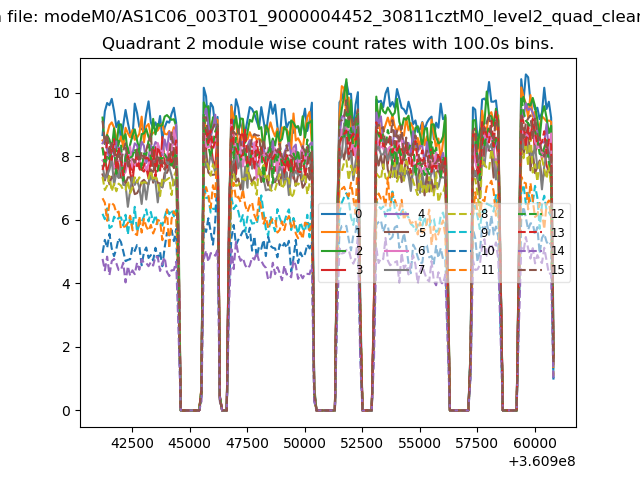
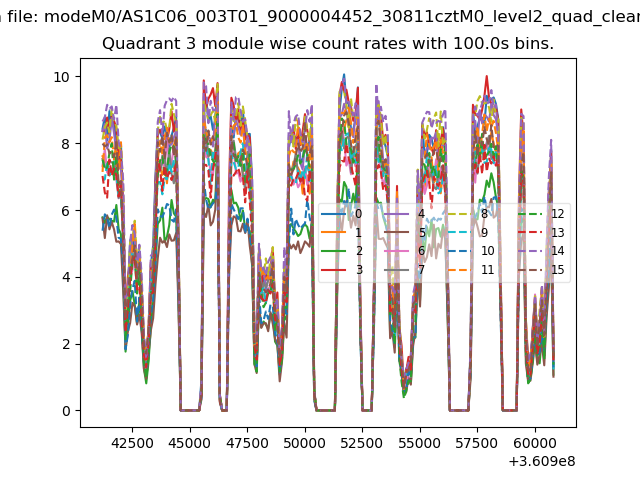
| Module-wise count rates for Quadrant A Data is divided into 100 sec bins |
 |
 |
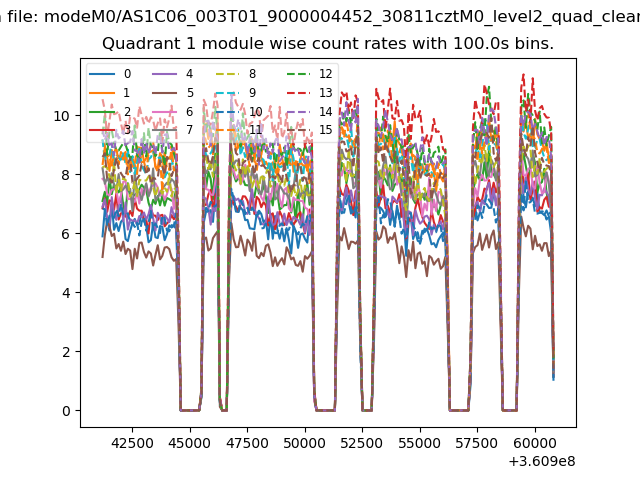
| Module-wise count rates for Quadrant B Data is divided into 100 sec bins |
 |
 |
| Module-wise count rates for Quadrant C Data is divided into 100 sec bins |
 |
 |
| Module-wise count rates for Quadrant D Data is divided into 100 sec bins |
 |
 |
| Parameter | Plot |
|---|---|
| CZT HV Monitor | 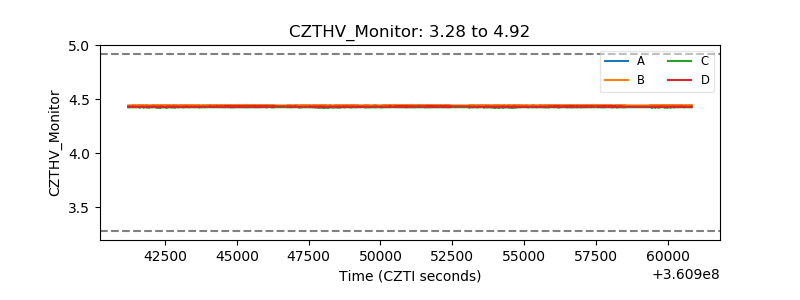 |
| D_VDD | 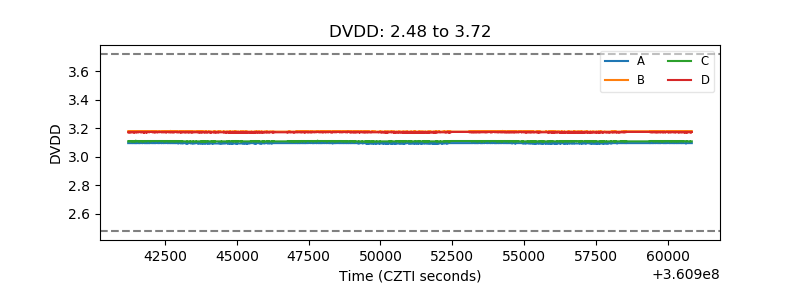 |
| Temperature 1 | 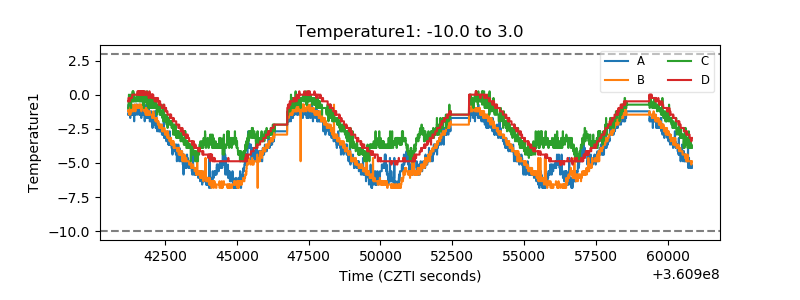 |
| Veto HV Monitor | 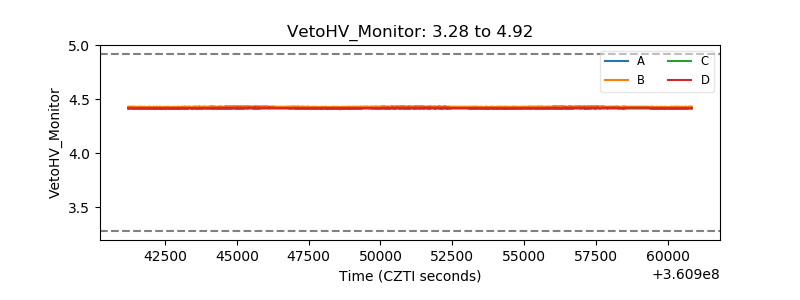 |
| Veto LLD | 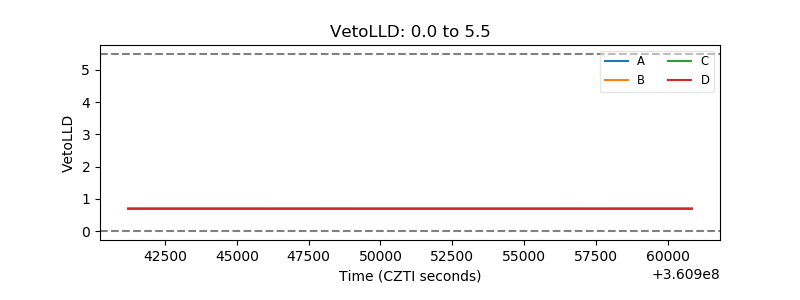 |
| Alpha Counter | 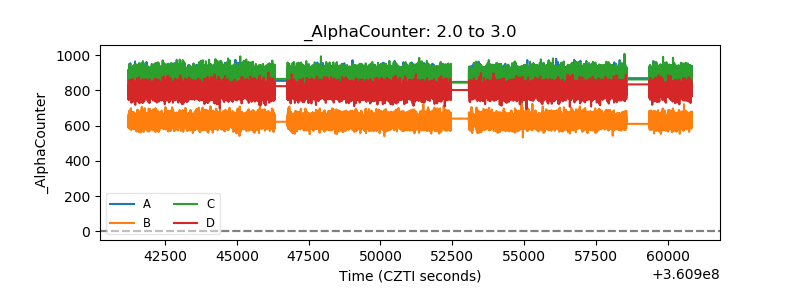 |
| _CPM_Rate | 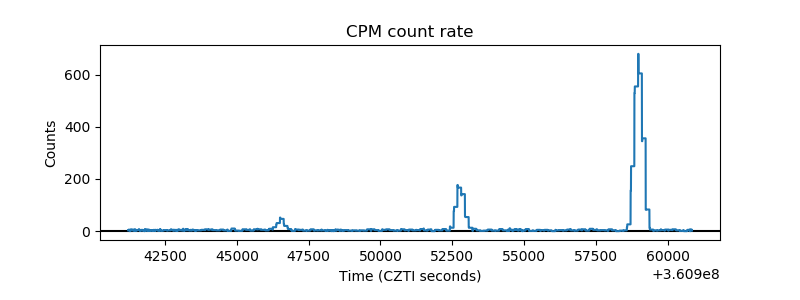 |
| CZT Counter | 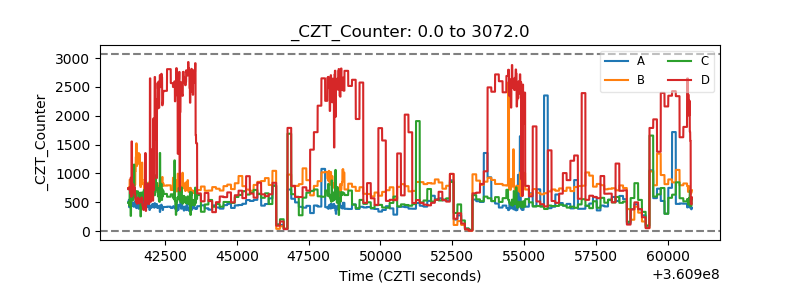 |
| +2.5 Volts monitor |  |
| +5 Volts monitor |  |
| _ROLL_ROT | 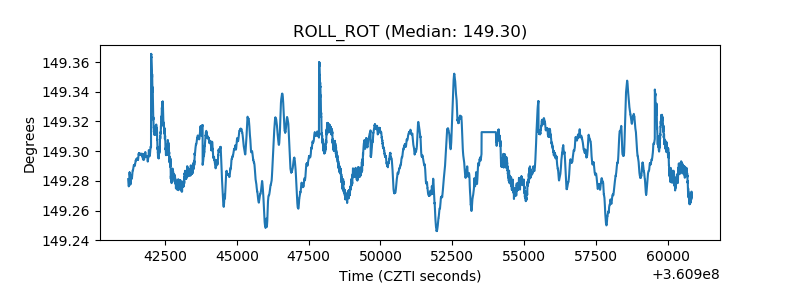 |
| _Roll_DEC | 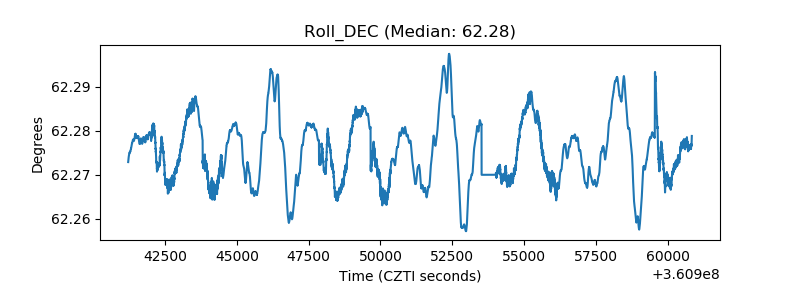 |
| _Roll_RA |  |
| Veto Counter | 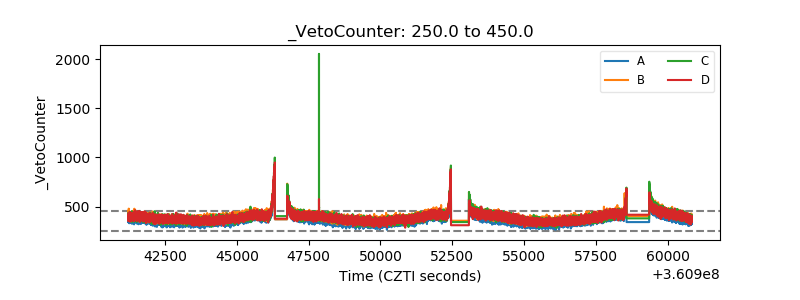 |