| Param | Original file | Final file |
|---|---|---|
| Filename | modeM0/AS1C06_003T01_9000004452_30813cztM0_level2.evt | modeM0/AS1C06_003T01_9000004452_30813cztM0_level2_quad_clean.evt |
| Size (bytes) | 662,120,640 | 105,511,680 |
| Size | 631.4 MB | 100.6 MB |
| Events in quadrant A | 3,228,691 | 730,185 |
| Events in quadrant B | 5,382,050 | 724,008 |
| Events in quadrant C | 4,163,438 | 698,530 |
| Events in quadrant D | 6,845,599 | 595,490 |
| Mode M9 | |||
|---|---|---|---|
| Quadrant | BADHDUFLAG | Total packets | Discarded packets |
| A | 0 | 15 | 0 |
| B | 0 | 16 | 0 |
| C | 0 | 16 | 0 |
| D | 0 | 16 | 0 |
| Mode M0 | |||
|---|---|---|---|
| Quadrant | BADHDUFLAG | Total packets | Discarded packets |
| A | 0 | 13875 | 2 |
| B | 0 | 20788 | 2 |
| C | 0 | 16517 | 2 |
| D | 0 | 24880 | 2 |
| Mode SS | |||
|---|---|---|---|
| Quadrant | BADHDUFLAG | Total packets | Discarded packets |
| A | 0 | 130 | 0 |
| B | 0 | 130 | 0 |
| C | 0 | 130 | 0 |
| D | 0 | 130 | 0 |
| Quadrant | Total seconds | Saturated seconds | Saturation percentage |
|---|---|---|---|
| A | 6403 | 66 | 1.030767% |
| B | 6403 | 282 | 4.404186% |
| C | 6403 | 279 | 4.357333% |
| D | 6403 | 1076 | 16.804623% |
Noise dominated data is calculated using 1-second bins in cleaned event files. If a bin has >2000 counts, and if more than 50% of those come from <1% of pixels, then it is considered to be noise-dominated and hence unusable.
| Quadrant | # 1 sec bins | Bins with >0 counts | Bins with >2000 counts | High rate bins dominated by noise | Noise dominated (total time) | Noise dominated (detector-on time) | Marked lightcurve |
|---|---|---|---|---|---|---|---|
| A | 7513 | 6404 | 43 | 43 | 0.57% | 0.67% | 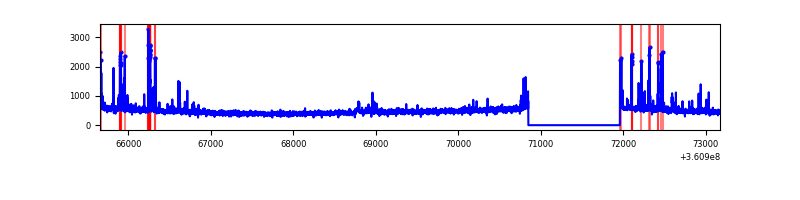 |
| B | 7513 | 6403 | 154 | 154 | 2.05% | 2.41% | 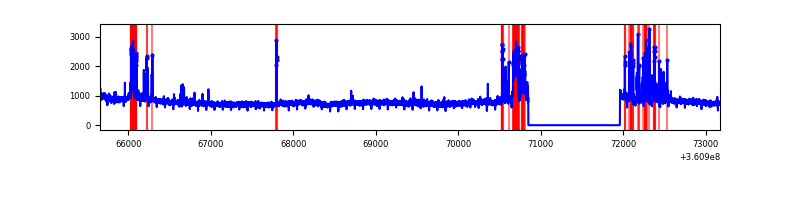 |
| C | 7513 | 6404 | 108 | 108 | 1.44% | 1.69% | 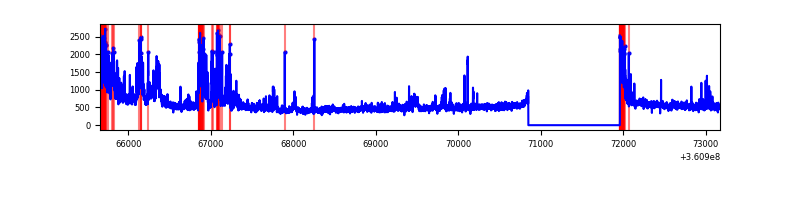 |
| D | 7513 | 6404 | 850 | 850 | 11.31% | 13.27% | 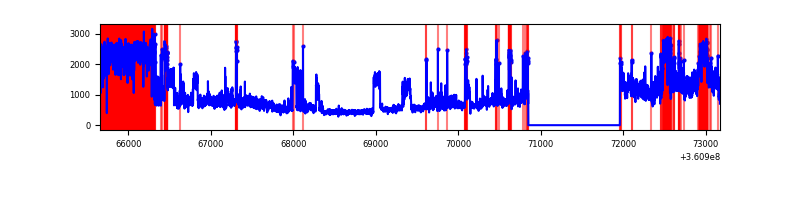 |
Top three noisy pixels from each quadrant. If the there are fewer than three noisy pixels in the level2.evt file, extra rows are filled as -1
| Pixel properties | Quadrant properties | ||||||
|---|---|---|---|---|---|---|---|
| Quadrant | DetID | PixID | Counts | Sigma | Mean | Median | Sigma |
| A | 0 | 13 | 253075 | 1645.81 | 768 | 753 | 153.3 |
| A | 13 | 254 | 12591 | 77.22 | 768 | 753 | 153.3 |
| A | 12 | 96 | 9748 | 58.67 | 768 | 753 | 153.3 |
| B | 6 | 159 | 1869627 | 13087.15 | 759 | 740 | 142.8 |
| B | 5 | 172 | 464221 | 3245.59 | 759 | 740 | 142.8 |
| B | 4 | 80 | 28352 | 193.36 | 759 | 740 | 142.8 |
| C | 3 | 233 | 909895 | 5278.34 | 738 | 745 | 172.2 |
| C | 0 | 10 | 193919 | 1121.53 | 738 | 745 | 172.2 |
| C | 14 | 238 | 117929 | 680.35 | 738 | 745 | 172.2 |
| D | 8 | 195 | 2568318 | 16128.53 | 664 | 648 | 159.2 |
| D | 12 | 218 | 1318924 | 8280.6 | 664 | 648 | 159.2 |
| D | 2 | 250 | 172593 | 1080.05 | 664 | 648 | 159.2 |
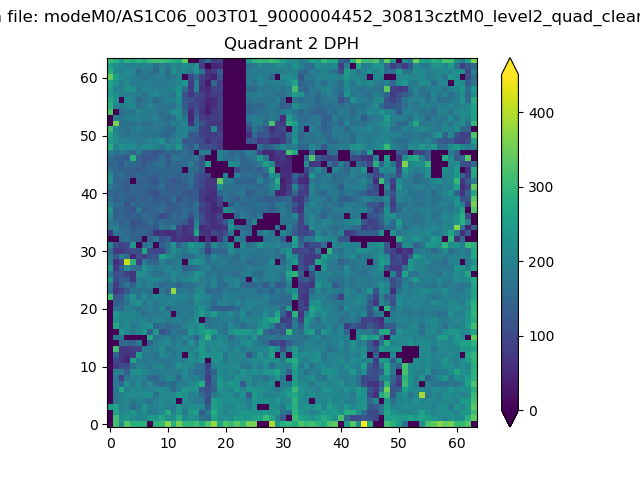
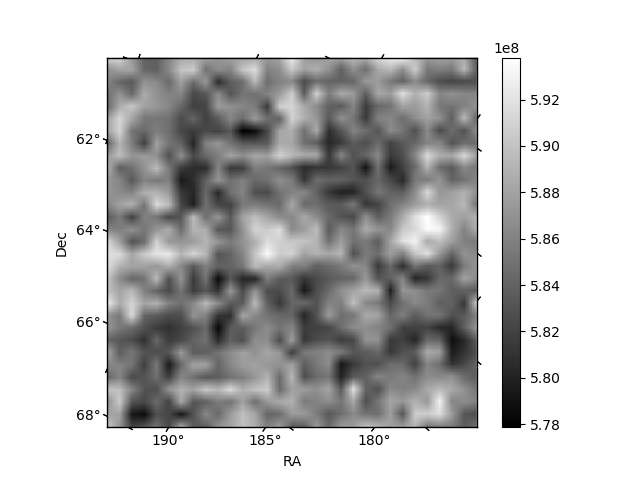
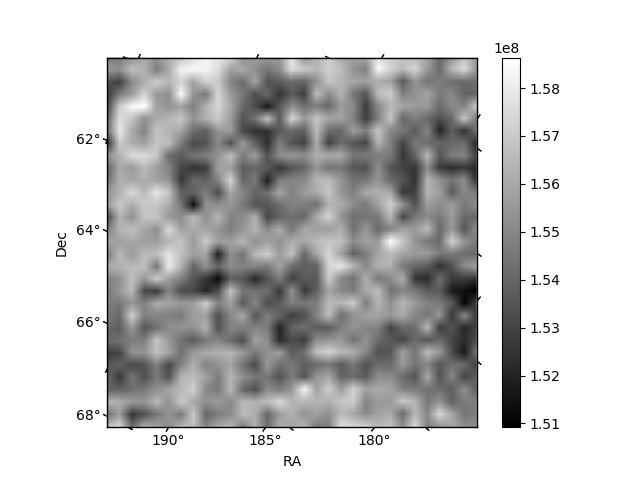
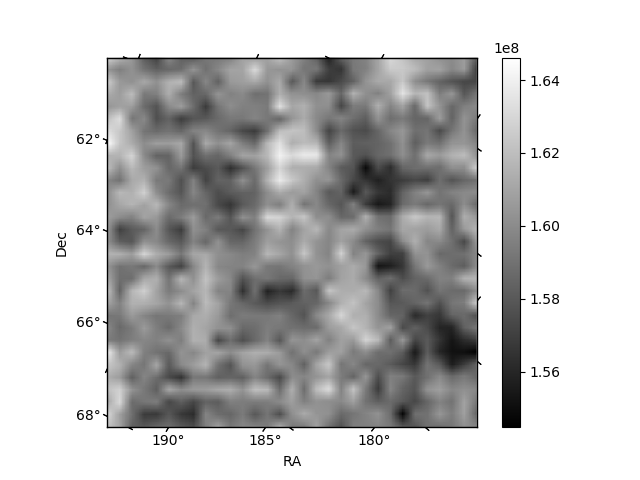
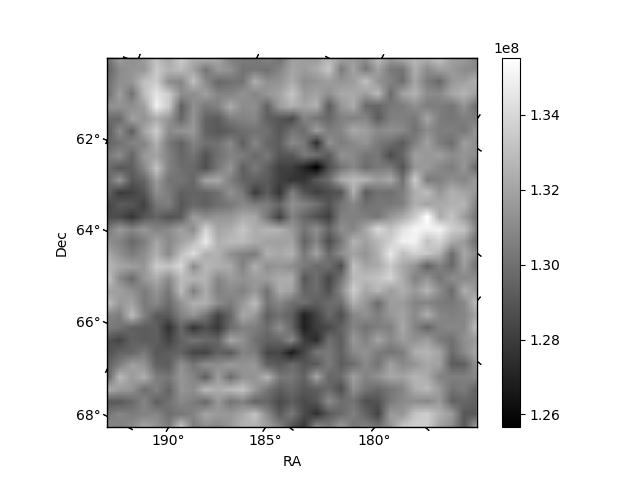
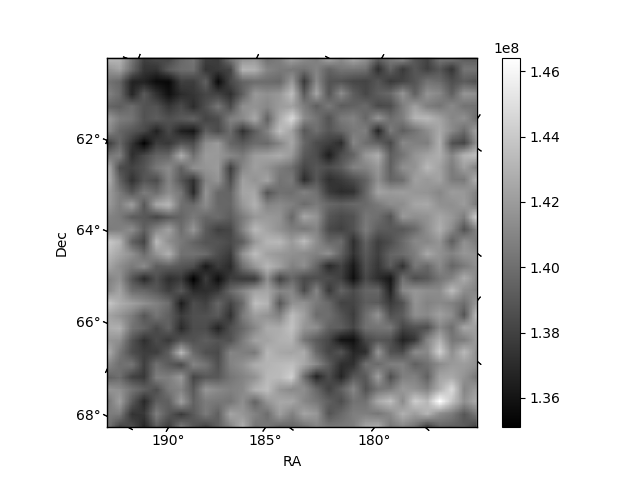
Histogram calculated using DETX and DETY for each event in the final _common_clean file
| Quadrant A | 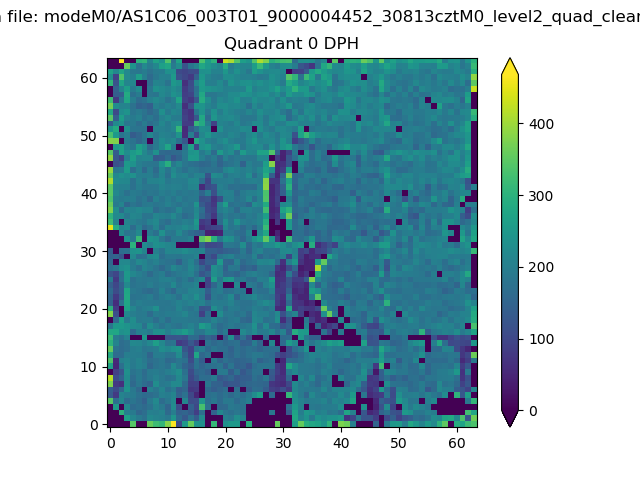 |
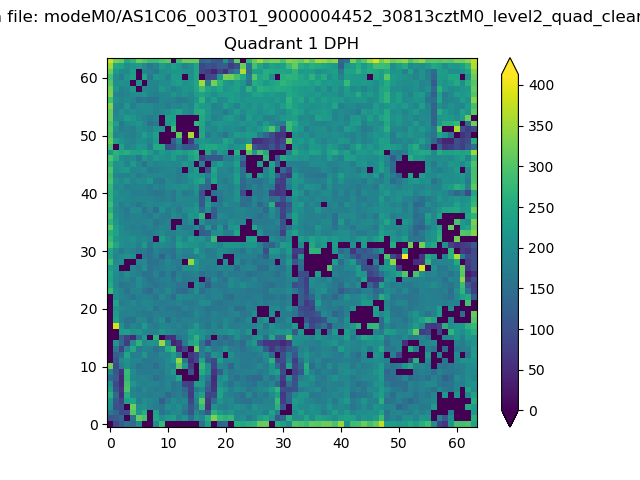 |
Quadrant B |
|---|---|---|---|
| Quadrant D | 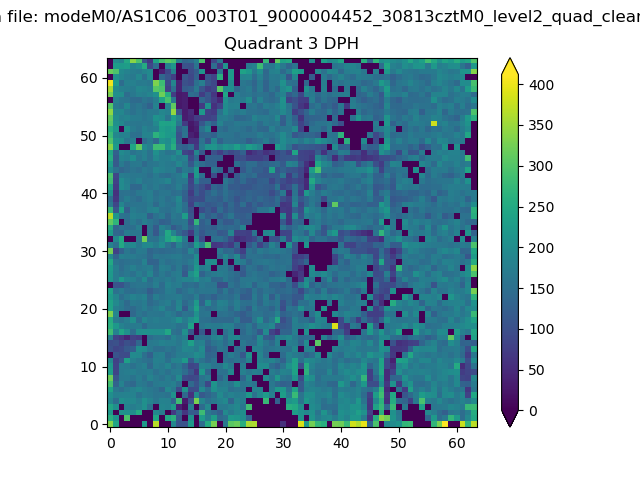 |
 |
Quadrant C |
| Plot type | Count rate plots | Images |
|---|---|---|
| Comparison with Poisson distribution Blue bars denote a histogram of data divided into 1 sec bins. Red curve is a Poisson curve with rate = median count rate of data. |
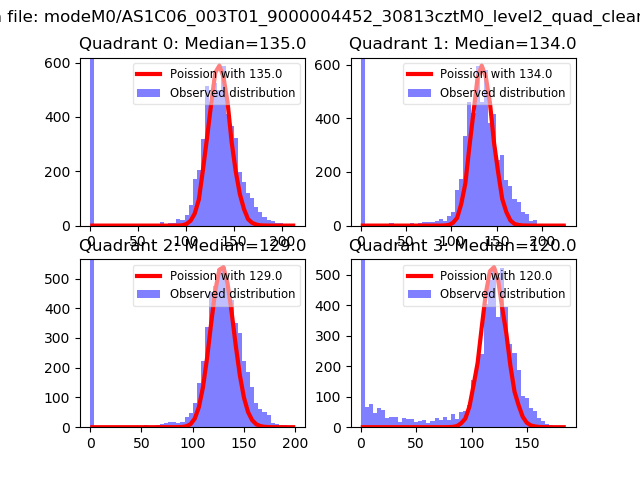 |
 |
| Quadrant-wise count rates Data is divided into 100 sec bins |
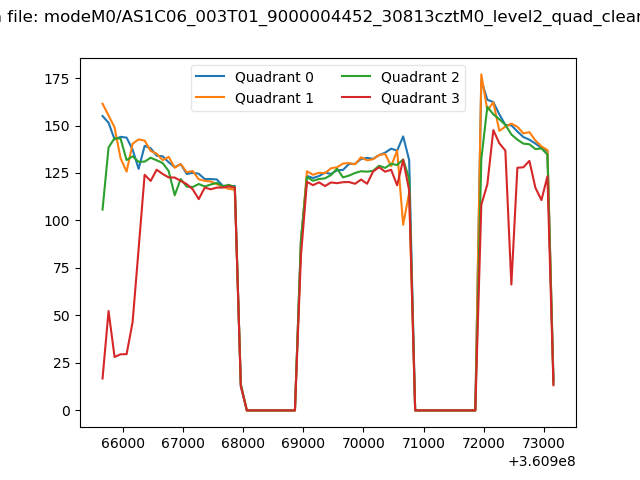 |
|
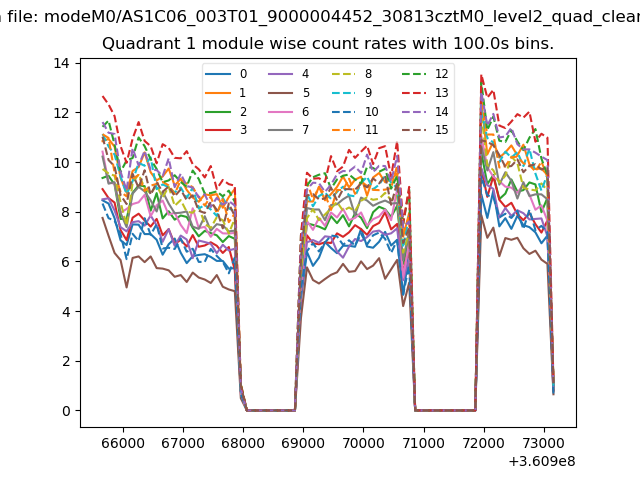
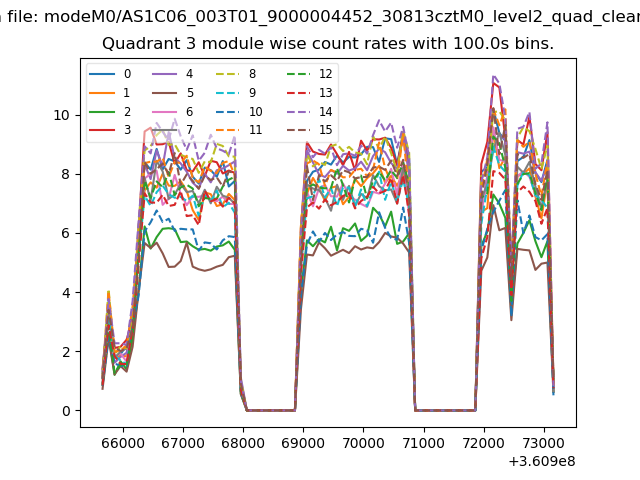
| Module-wise count rates for Quadrant A Data is divided into 100 sec bins |
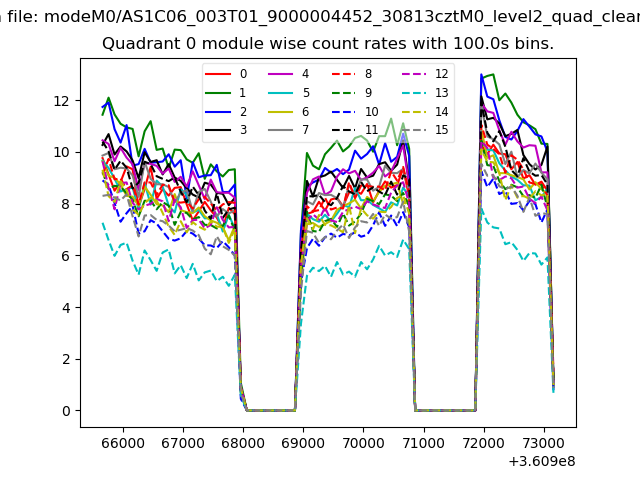 |
 |
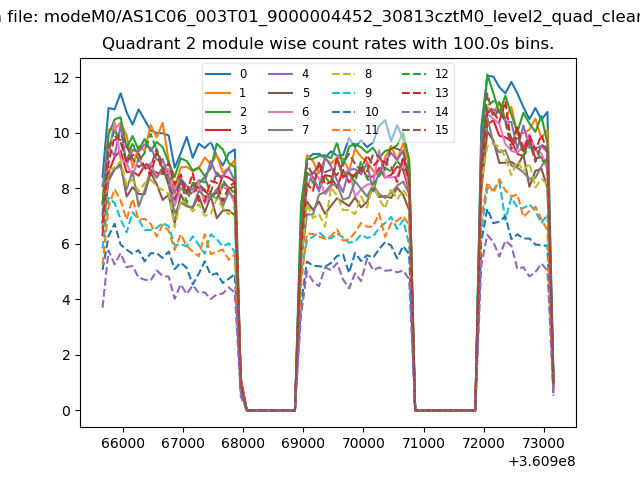
| Module-wise count rates for Quadrant B Data is divided into 100 sec bins |
 |
 |
| Module-wise count rates for Quadrant C Data is divided into 100 sec bins |
 |
 |
| Module-wise count rates for Quadrant D Data is divided into 100 sec bins |
 |
 |
| Parameter | Plot |
|---|---|
| CZT HV Monitor | 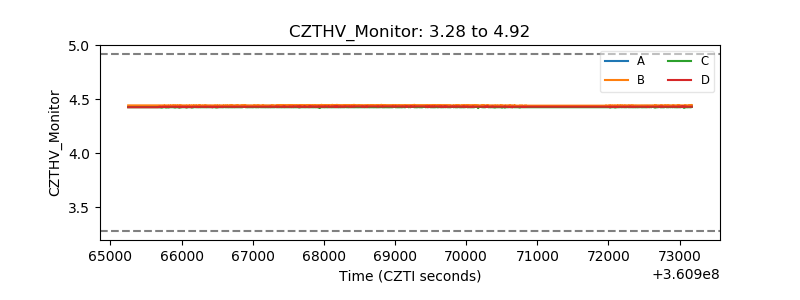 |
| D_VDD |  |
| Temperature 1 | 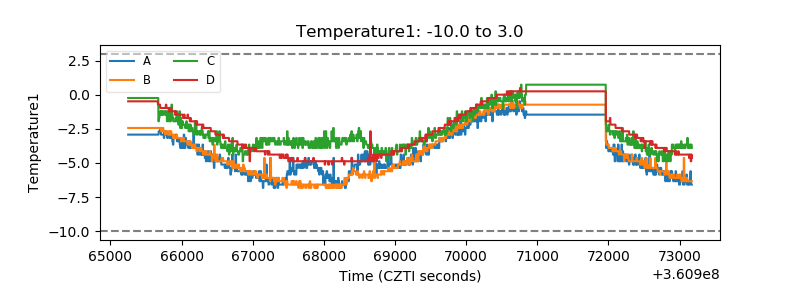 |
| Veto HV Monitor |  |
| Veto LLD | 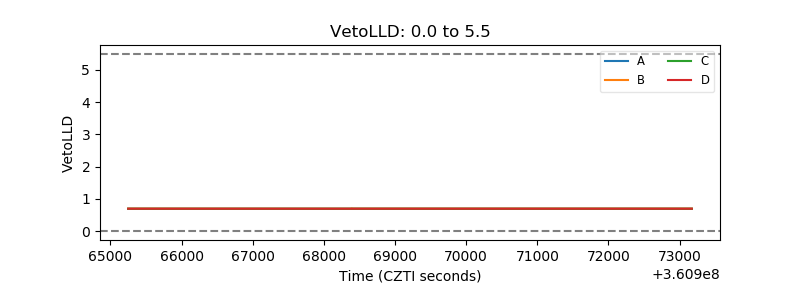 |
| Alpha Counter | 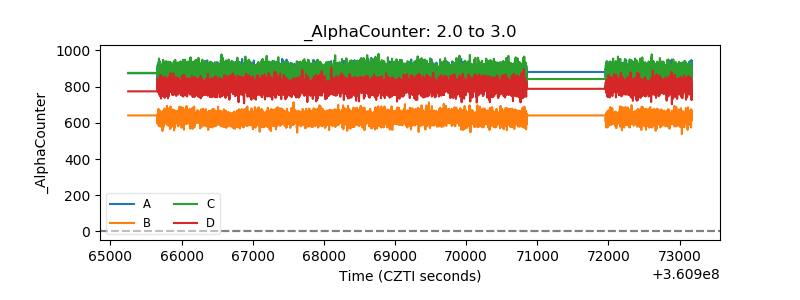 |
| _CPM_Rate | 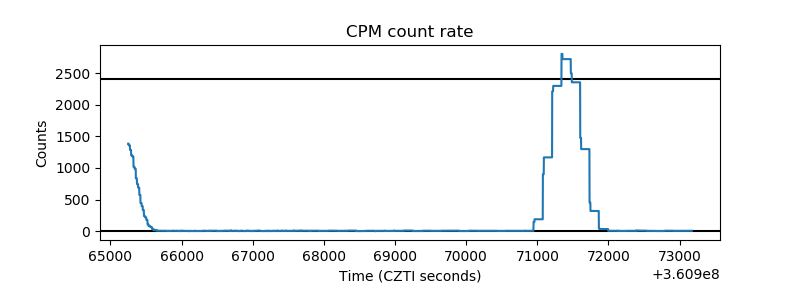 |
| CZT Counter | 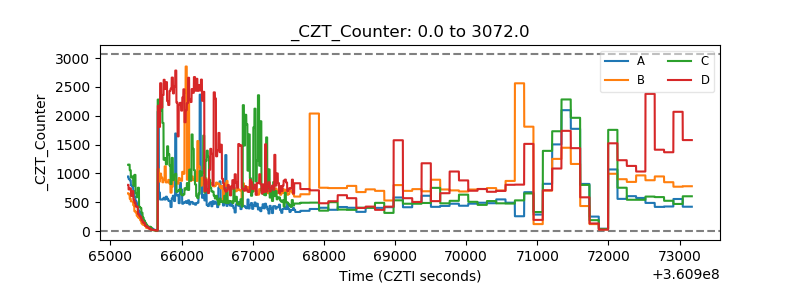 |
| +2.5 Volts monitor |  |
| +5 Volts monitor |  |
| _ROLL_ROT | 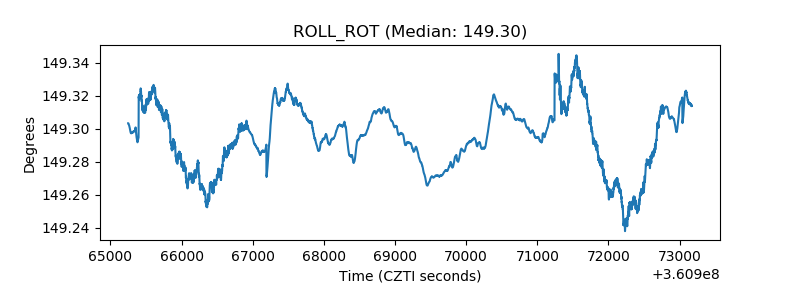 |
| _Roll_DEC | 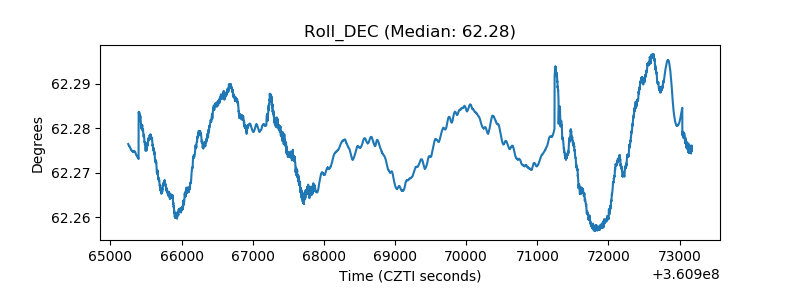 |
| _Roll_RA |  |
| Veto Counter | 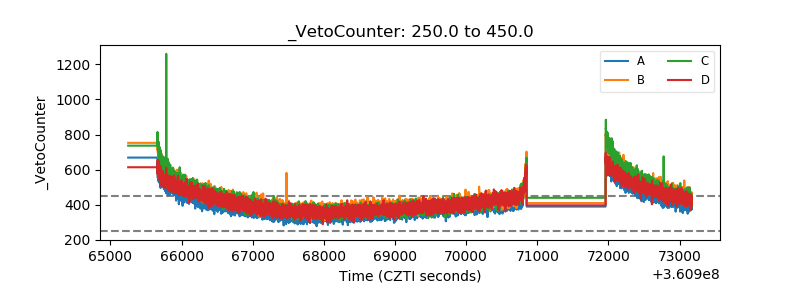 |