| Param | Original file | Final file |
|---|---|---|
| Filename | modeM0/AS1C06_003T01_9000004452_30815cztM0_level2.evt | modeM0/AS1C06_003T01_9000004452_30815cztM0_level2_quad_clean.evt |
| Size (bytes) | 626,434,560 | 112,524,480 |
| Size | 597.4 MB | 107.3 MB |
| Events in quadrant A | 3,219,500 | 769,367 |
| Events in quadrant B | 5,360,151 | 768,954 |
| Events in quadrant C | 3,554,815 | 739,749 |
| Events in quadrant D | 6,405,649 | 684,088 |
| Mode M9 | |||
|---|---|---|---|
| Quadrant | BADHDUFLAG | Total packets | Discarded packets |
| A | 0 | 14 | 0 |
| B | 0 | 15 | 0 |
| C | 0 | 15 | 0 |
| D | 0 | 15 | 0 |
| Mode M0 | |||
|---|---|---|---|
| Quadrant | BADHDUFLAG | Total packets | Discarded packets |
| A | 0 | 13716 | 3 |
| B | 0 | 20422 | 2 |
| C | 0 | 14648 | 2 |
| D | 0 | 23630 | 2 |
| Mode SS | |||
|---|---|---|---|
| Quadrant | BADHDUFLAG | Total packets | Discarded packets |
| A | 0 | 128 | 0 |
| B | 0 | 128 | 0 |
| C | 0 | 128 | 0 |
| D | 0 | 128 | 0 |
| Quadrant | Total seconds | Saturated seconds | Saturation percentage |
|---|---|---|---|
| A | 6391 | 44 | 0.688468% |
| B | 6391 | 200 | 3.129401% |
| C | 6391 | 172 | 2.691285% |
| D | 6391 | 533 | 8.339853% |
Noise dominated data is calculated using 1-second bins in cleaned event files. If a bin has >2000 counts, and if more than 50% of those come from <1% of pixels, then it is considered to be noise-dominated and hence unusable.
| Quadrant | # 1 sec bins | Bins with >0 counts | Bins with >2000 counts | High rate bins dominated by noise | Noise dominated (total time) | Noise dominated (detector-on time) | Marked lightcurve |
|---|---|---|---|---|---|---|---|
| A | 7571 | 6392 | 26 | 26 | 0.34% | 0.41% | 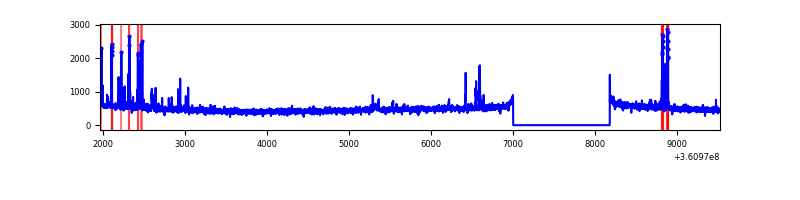 |
| B | 7571 | 6391 | 110 | 110 | 1.45% | 1.72% | 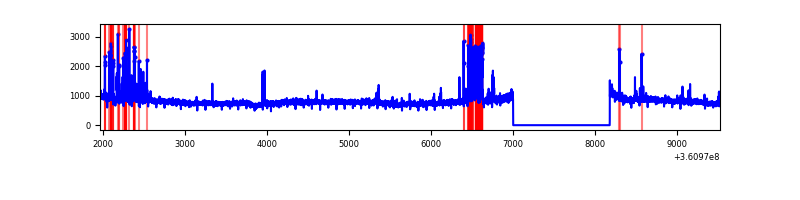 |
| C | 7571 | 6391 | 47 | 47 | 0.62% | 0.74% | 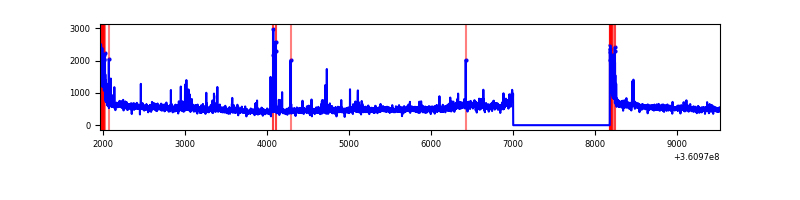 |
| D | 7571 | 6392 | 329 | 329 | 4.35% | 5.15% | 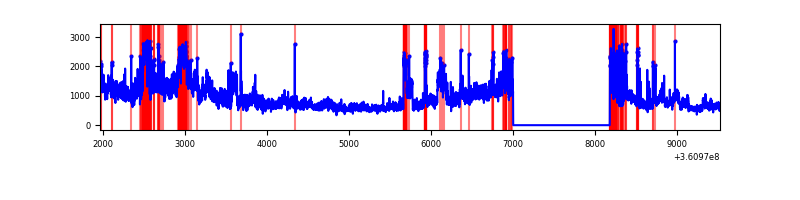 |
Top three noisy pixels from each quadrant. If the there are fewer than three noisy pixels in the level2.evt file, extra rows are filled as -1
| Pixel properties | Quadrant properties | ||||||
|---|---|---|---|---|---|---|---|
| Quadrant | DetID | PixID | Counts | Sigma | Mean | Median | Sigma |
| A | 0 | 13 | 168406 | 1078.52 | 787 | 774 | 155.4 |
| A | 13 | 254 | 12792 | 77.32 | 787 | 774 | 155.4 |
| A | 12 | 96 | 12775 | 77.21 | 787 | 774 | 155.4 |
| B | 6 | 159 | 1870980 | 12798.53 | 783 | 764 | 146.1 |
| B | 5 | 172 | 308785 | 2107.89 | 783 | 764 | 146.1 |
| B | 0 | 155 | 23853 | 158.01 | 783 | 764 | 146.1 |
| C | 0 | 10 | 228223 | 1280.12 | 759 | 764 | 177.7 |
| C | 3 | 233 | 220480 | 1236.54 | 759 | 764 | 177.7 |
| C | 14 | 238 | 123256 | 689.37 | 759 | 764 | 177.7 |
| D | 8 | 195 | 2908667 | 16594.34 | 731 | 716 | 175.2 |
| D | 12 | 218 | 244444 | 1390.84 | 731 | 716 | 175.2 |
| D | 2 | 250 | 190917 | 1085.39 | 731 | 716 | 175.2 |
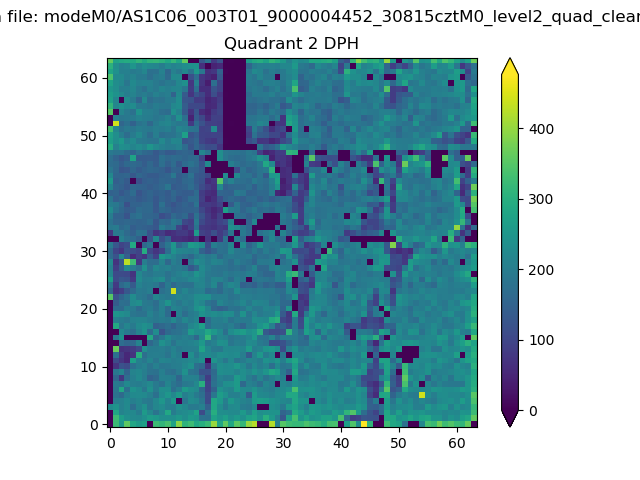
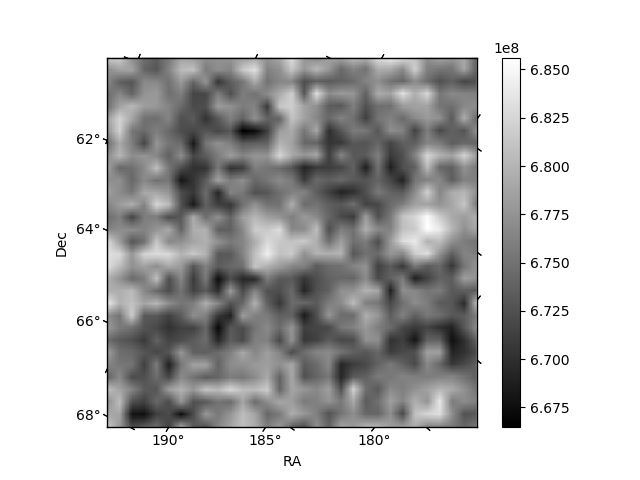
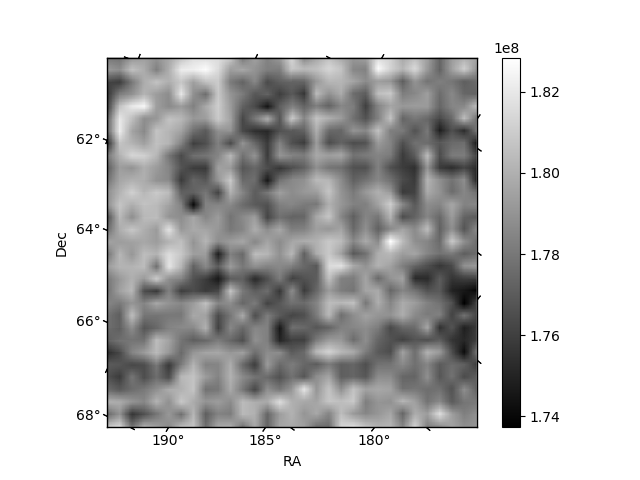
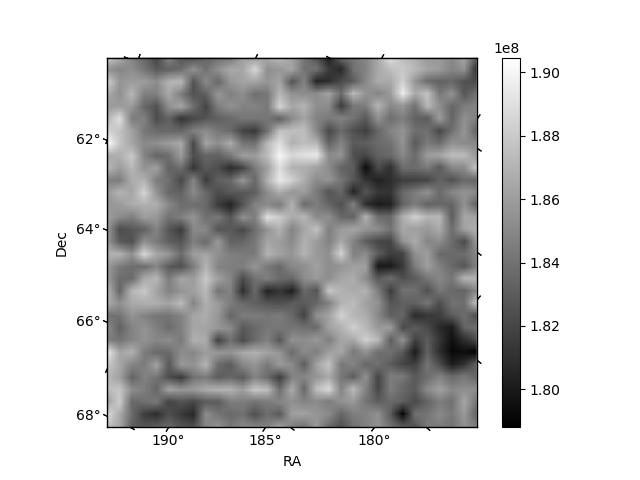
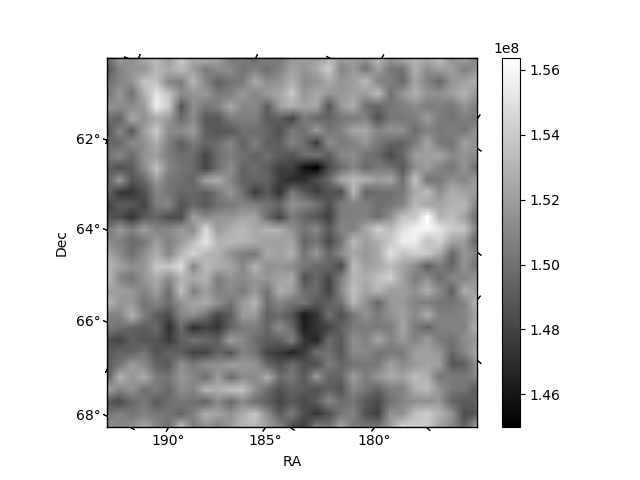
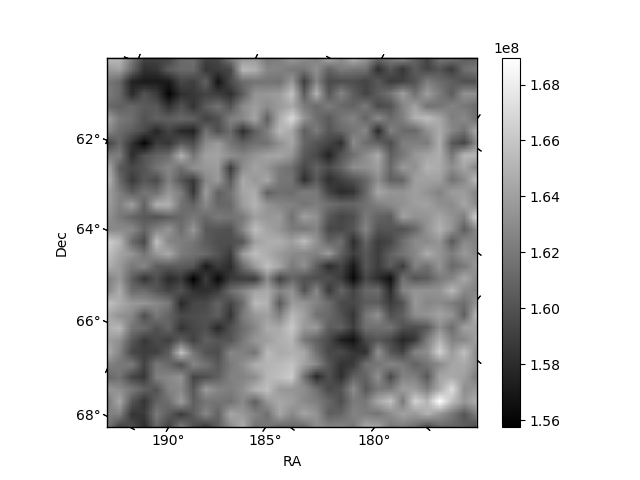
Histogram calculated using DETX and DETY for each event in the final _common_clean file
| Quadrant A | 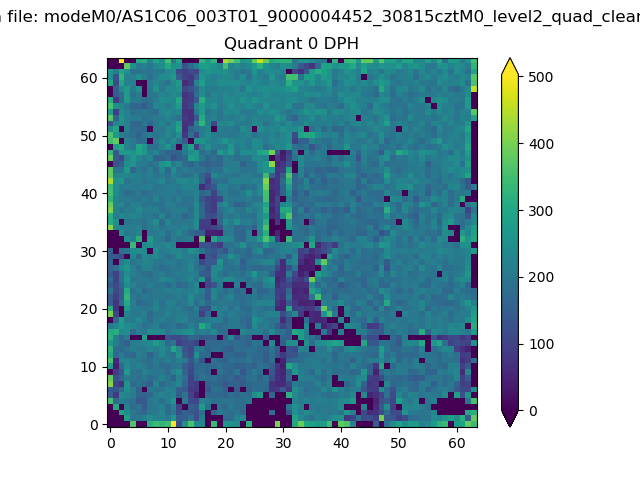 |
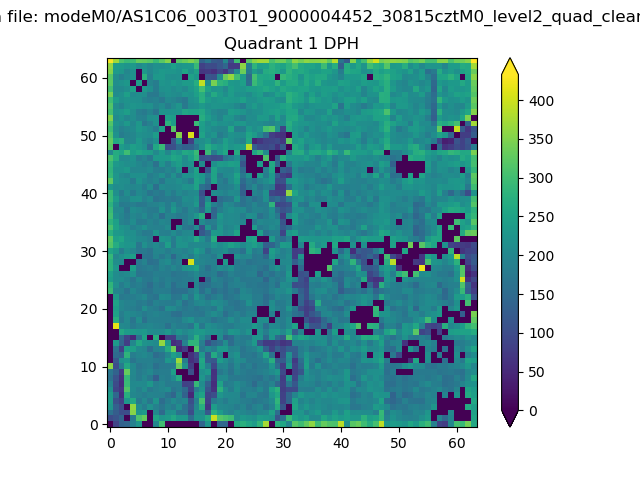 |
Quadrant B |
|---|---|---|---|
| Quadrant D | 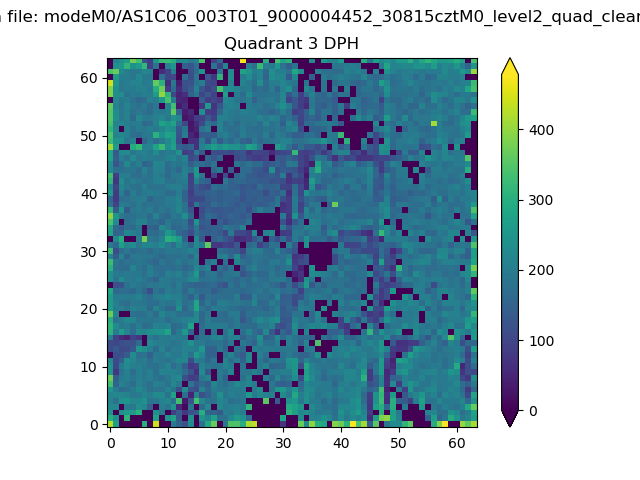 |
 |
Quadrant C |
| Plot type | Count rate plots | Images |
|---|---|---|
| Comparison with Poisson distribution Blue bars denote a histogram of data divided into 1 sec bins. Red curve is a Poisson curve with rate = median count rate of data. |
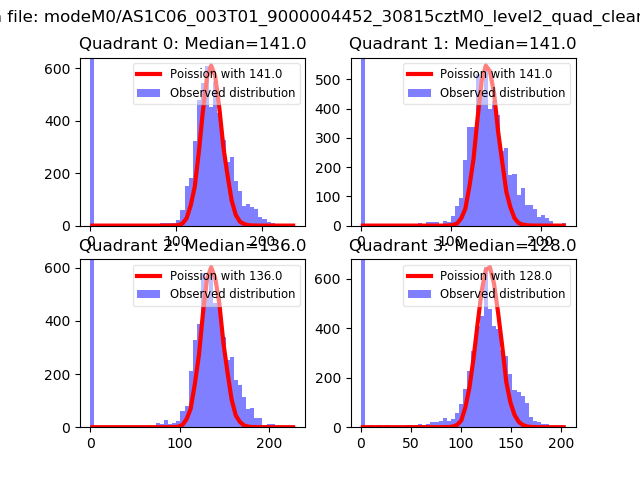 |
 |
| Quadrant-wise count rates Data is divided into 100 sec bins |
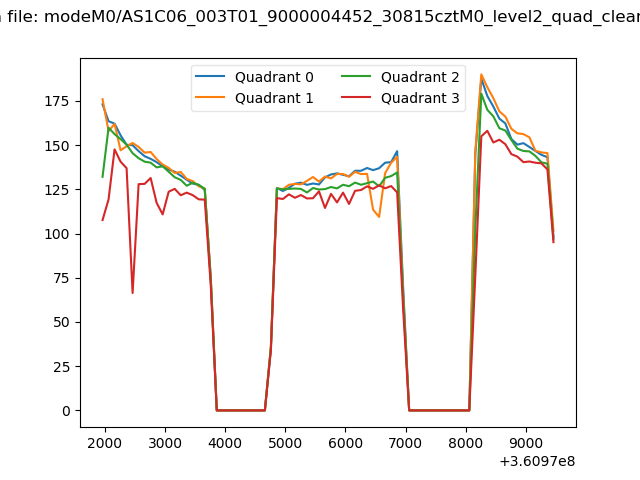 |
|
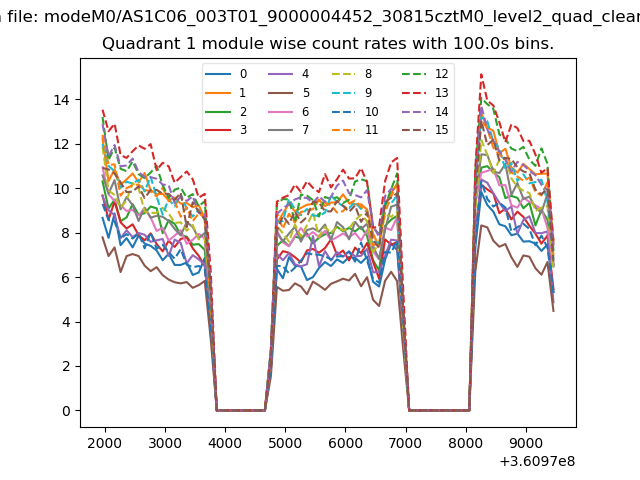
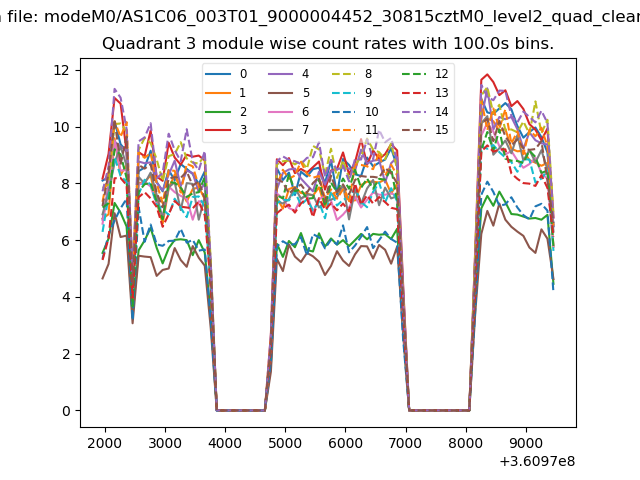
| Module-wise count rates for Quadrant A Data is divided into 100 sec bins |
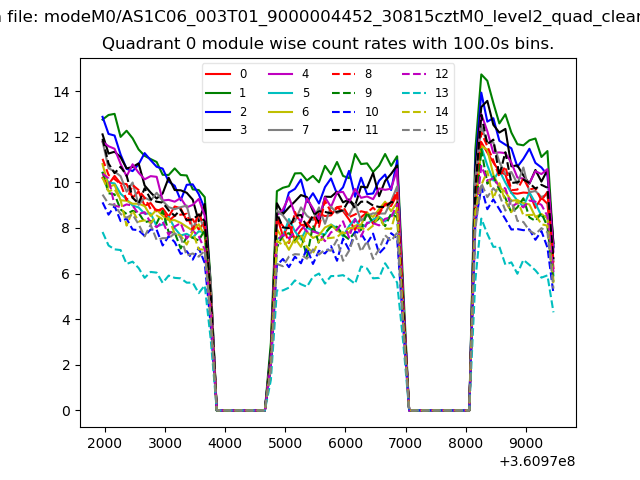 |
 |
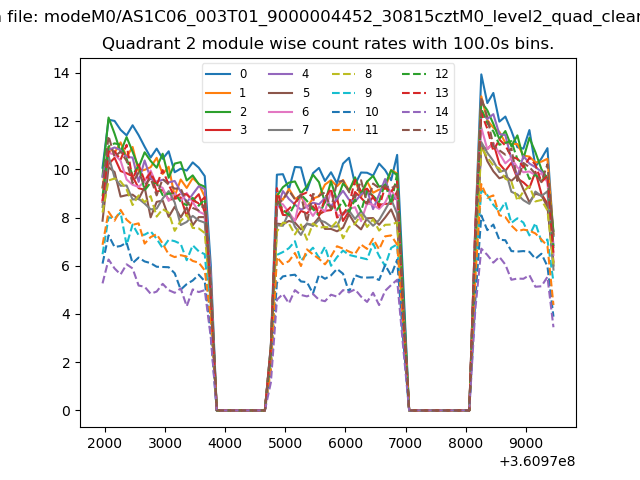
| Module-wise count rates for Quadrant B Data is divided into 100 sec bins |
 |
 |
| Module-wise count rates for Quadrant C Data is divided into 100 sec bins |
 |
 |
| Module-wise count rates for Quadrant D Data is divided into 100 sec bins |
 |
 |
| Parameter | Plot |
|---|---|
| CZT HV Monitor | 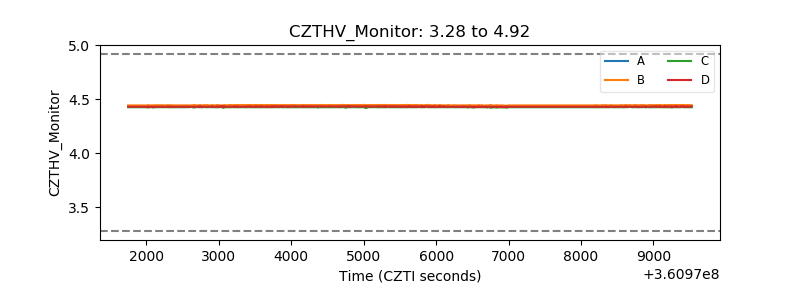 |
| D_VDD | 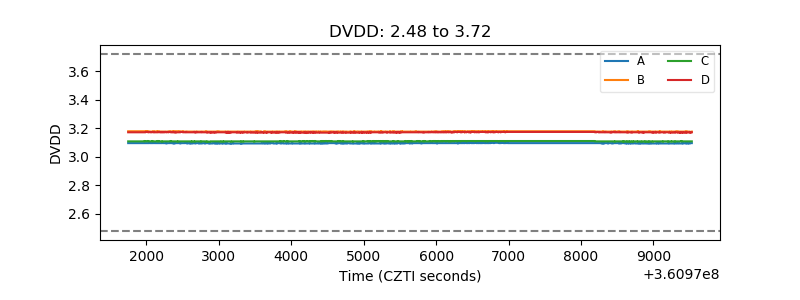 |
| Temperature 1 | 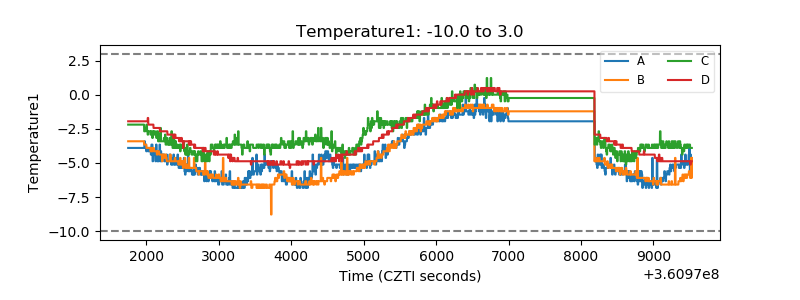 |
| Veto HV Monitor | 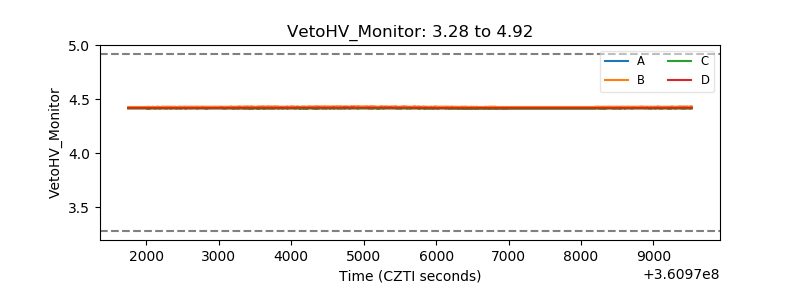 |
| Veto LLD | 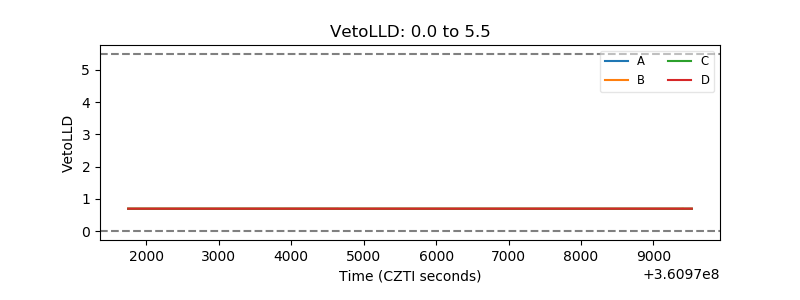 |
| Alpha Counter | 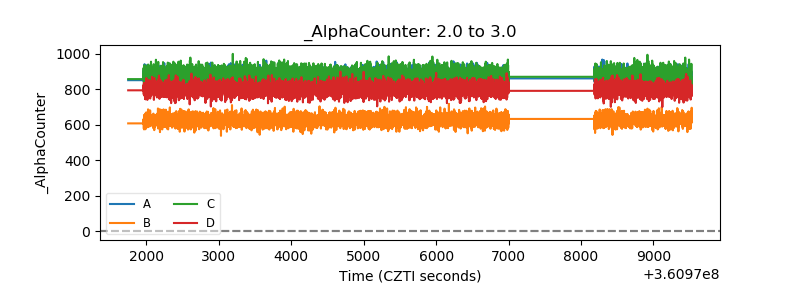 |
| _CPM_Rate | 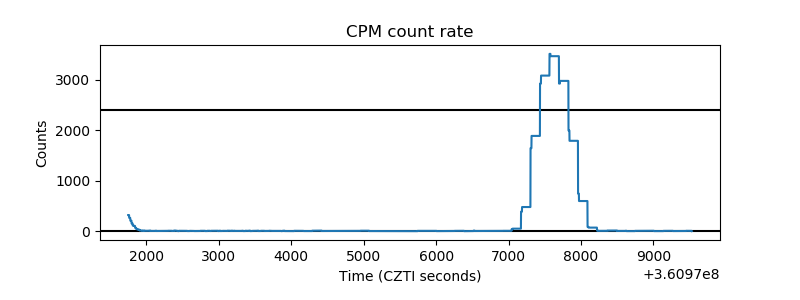 |
| CZT Counter | 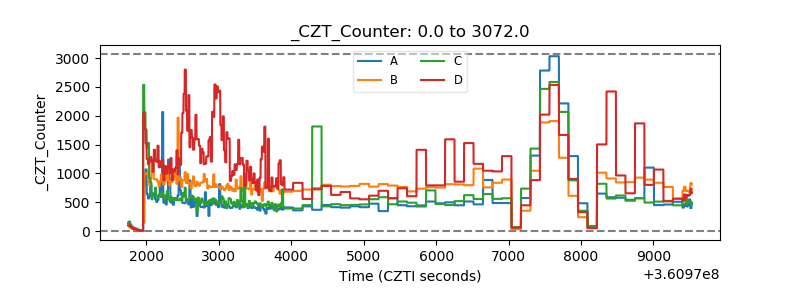 |
| +2.5 Volts monitor |  |
| +5 Volts monitor |  |
| _ROLL_ROT | 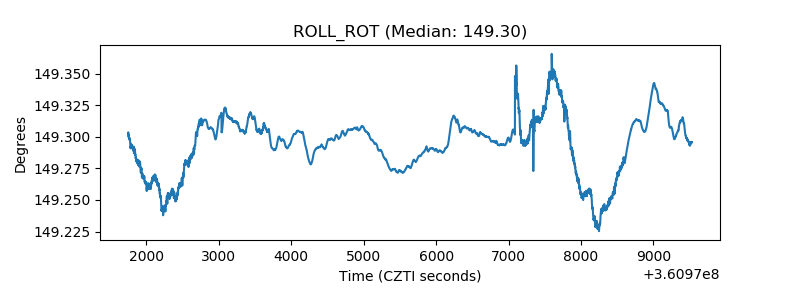 |
| _Roll_DEC | 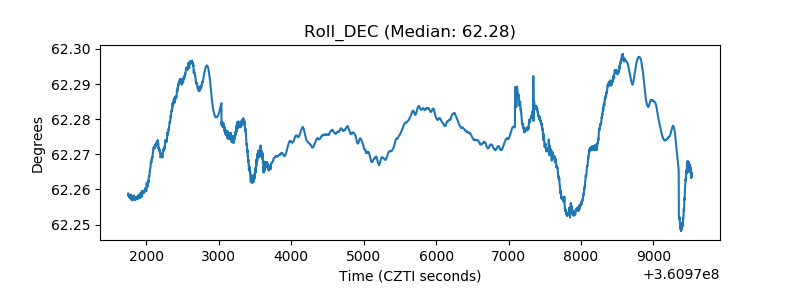 |
| _Roll_RA | 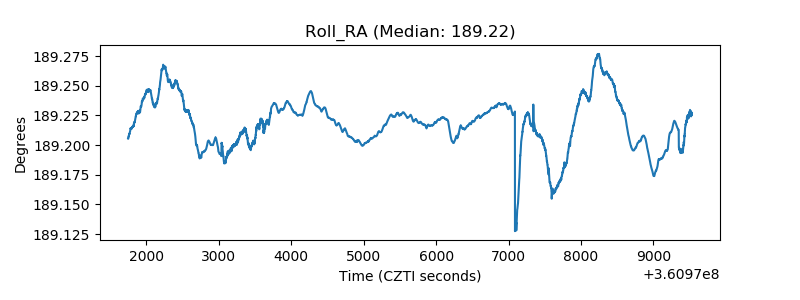 |
| Veto Counter | 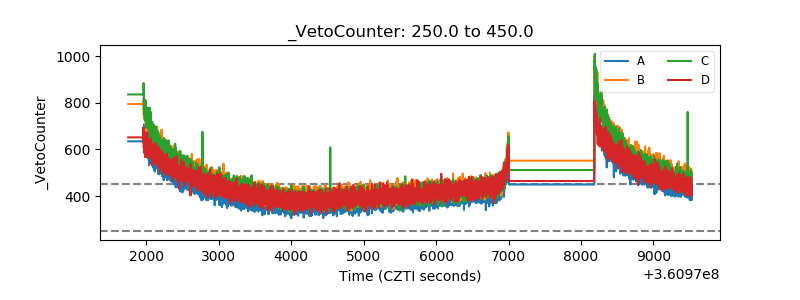 |