| Param | Original file | Final file |
|---|---|---|
| Filename | modeM0/AS1C06_003T01_9000004452_30817cztM0_level2.evt | modeM0/AS1C06_003T01_9000004452_30817cztM0_level2_quad_clean.evt |
| Size (bytes) | 637,067,520 | 96,865,920 |
| Size | 607.6 MB | 92.4 MB |
| Events in quadrant A | 3,399,368 | 652,452 |
| Events in quadrant B | 5,116,361 | 657,000 |
| Events in quadrant C | 3,753,455 | 613,013 |
| Events in quadrant D | 6,605,320 | 577,017 |
| Mode M9 | |||
|---|---|---|---|
| Quadrant | BADHDUFLAG | Total packets | Discarded packets |
| A | 0 | 13 | 0 |
| B | 0 | 13 | 0 |
| C | 0 | 13 | 0 |
| D | 0 | 13 | 0 |
| Mode M0 | |||
|---|---|---|---|
| Quadrant | BADHDUFLAG | Total packets | Discarded packets |
| A | 0 | 13814 | 2 |
| B | 0 | 19250 | 4 |
| C | 0 | 15036 | 2 |
| D | 0 | 24089 | 2 |
| Mode SS | |||
|---|---|---|---|
| Quadrant | BADHDUFLAG | Total packets | Discarded packets |
| A | 0 | 128 | 0 |
| B | 0 | 128 | 0 |
| C | 0 | 128 | 0 |
| D | 0 | 128 | 0 |
| Quadrant | Total seconds | Saturated seconds | Saturation percentage |
|---|---|---|---|
| A | 6209 | 65 | 1.046867% |
| B | 6209 | 88 | 1.417297% |
| C | 6209 | 113 | 1.819939% |
| D | 6209 | 331 | 5.330971% |
Noise dominated data is calculated using 1-second bins in cleaned event files. If a bin has >2000 counts, and if more than 50% of those come from <1% of pixels, then it is considered to be noise-dominated and hence unusable.
| Quadrant | # 1 sec bins | Bins with >0 counts | Bins with >2000 counts | High rate bins dominated by noise | Noise dominated (total time) | Noise dominated (detector-on time) | Marked lightcurve |
|---|---|---|---|---|---|---|---|
| A | 7554 | 6211 | 44 | 44 | 0.58% | 0.71% | 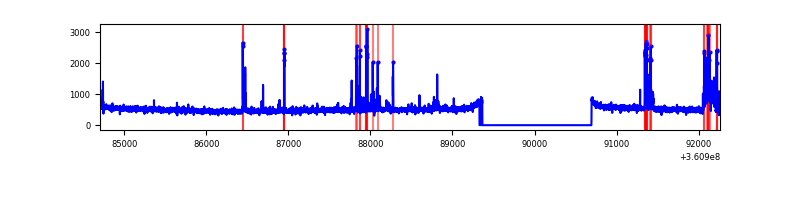 |
| B | 7554 | 6210 | 8 | 8 | 0.11% | 0.13% | 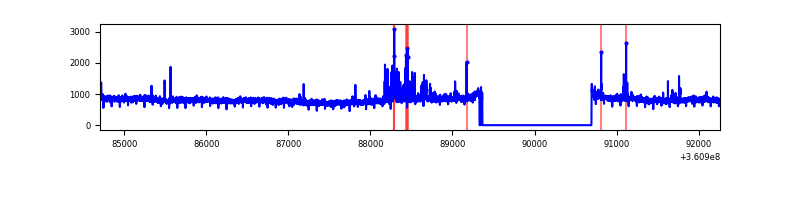 |
| C | 7554 | 6210 | 19 | 19 | 0.25% | 0.31% | 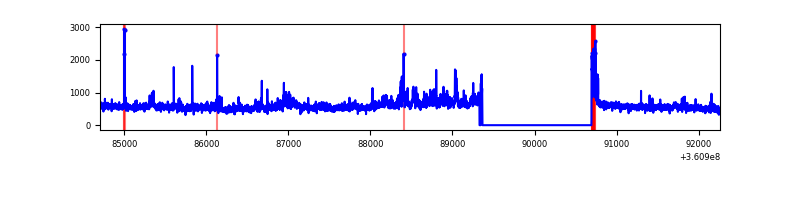 |
| D | 7554 | 6209 | 224 | 224 | 2.97% | 3.61% | 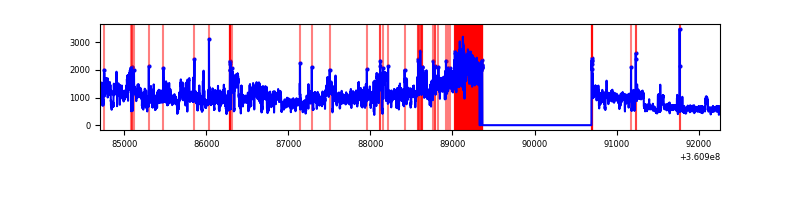 |
Top three noisy pixels from each quadrant. If the there are fewer than three noisy pixels in the level2.evt file, extra rows are filled as -1
| Pixel properties | Quadrant properties | ||||||
|---|---|---|---|---|---|---|---|
| Quadrant | DetID | PixID | Counts | Sigma | Mean | Median | Sigma |
| A | 0 | 13 | 311107 | 1954.85 | 800 | 787 | 158.7 |
| A | 13 | 254 | 11156 | 65.32 | 800 | 787 | 158.7 |
| A | 3 | 137 | 7318 | 41.14 | 800 | 787 | 158.7 |
| B | 6 | 159 | 1819914 | 12411.7 | 795 | 777 | 146.6 |
| B | 5 | 172 | 80326 | 542.75 | 795 | 777 | 146.6 |
| B | 0 | 230 | 19765 | 129.55 | 795 | 777 | 146.6 |
| C | 3 | 233 | 568378 | 3259.65 | 755 | 761 | 174.1 |
| C | 14 | 238 | 125096 | 714.02 | 755 | 761 | 174.1 |
| C | 0 | 10 | 79190 | 450.39 | 755 | 761 | 174.1 |
| D | 8 | 195 | 3336819 | 19122.25 | 741 | 724 | 174.5 |
| D | 12 | 218 | 275225 | 1573.42 | 741 | 724 | 174.5 |
| D | 2 | 250 | 56577 | 320.15 | 741 | 724 | 174.5 |
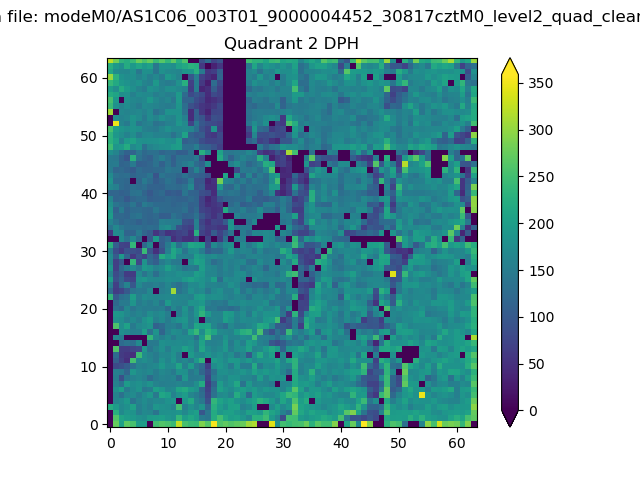
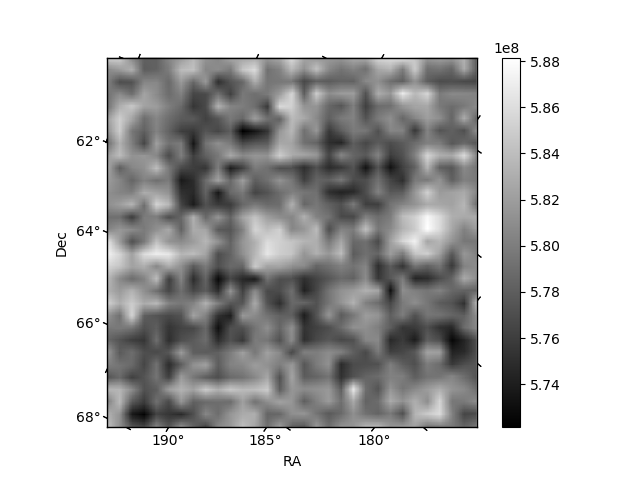
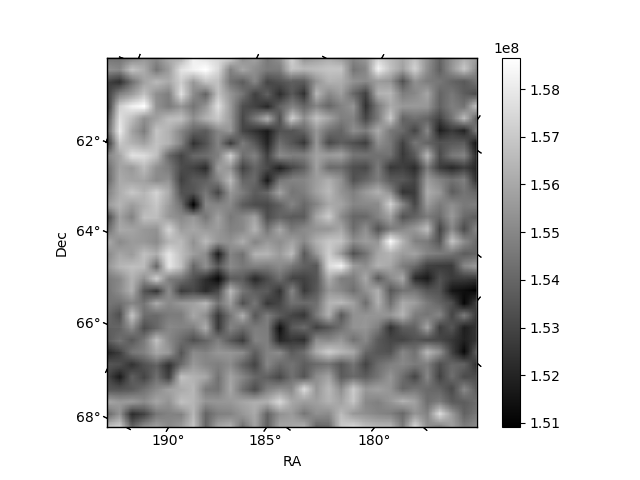
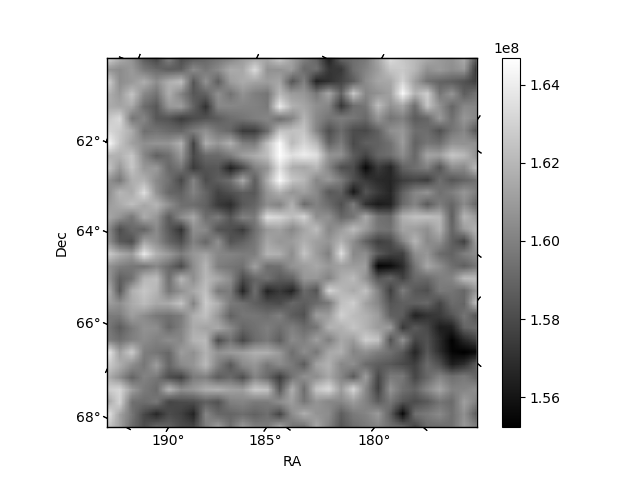
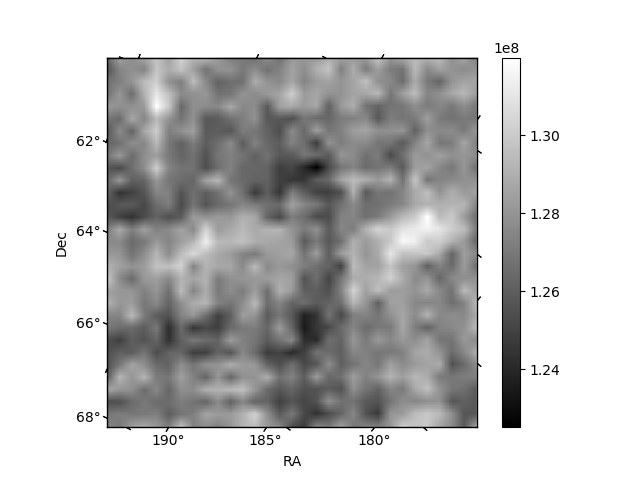
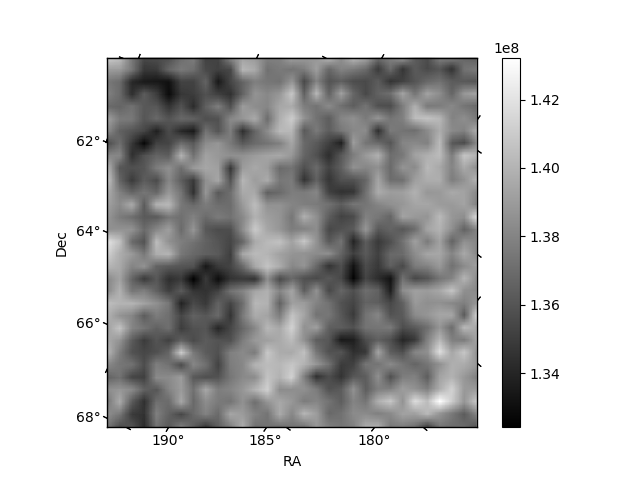
Histogram calculated using DETX and DETY for each event in the final _common_clean file
| Quadrant A | 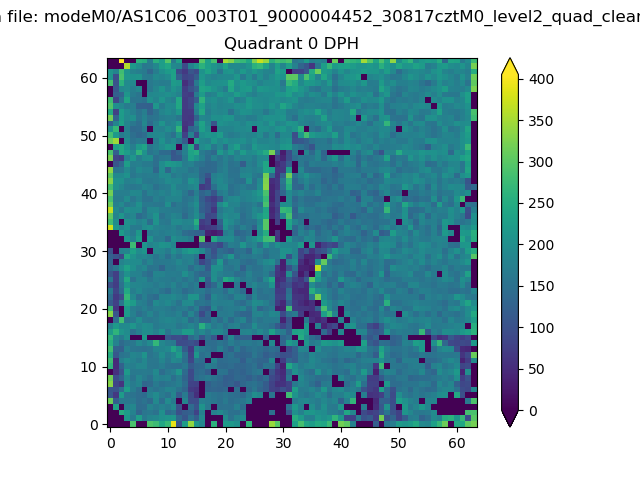 |
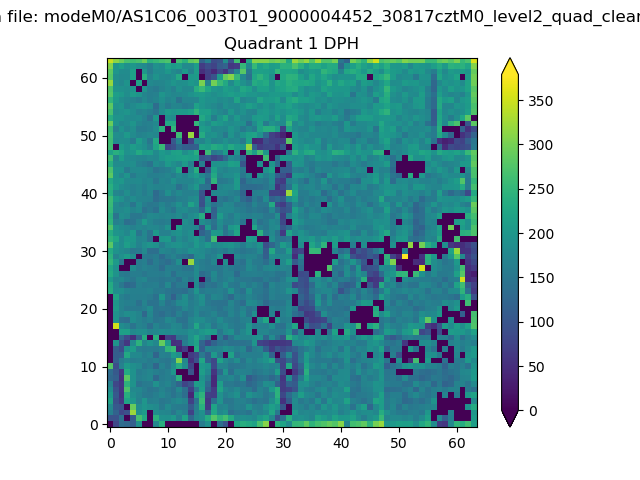 |
Quadrant B |
|---|---|---|---|
| Quadrant D | 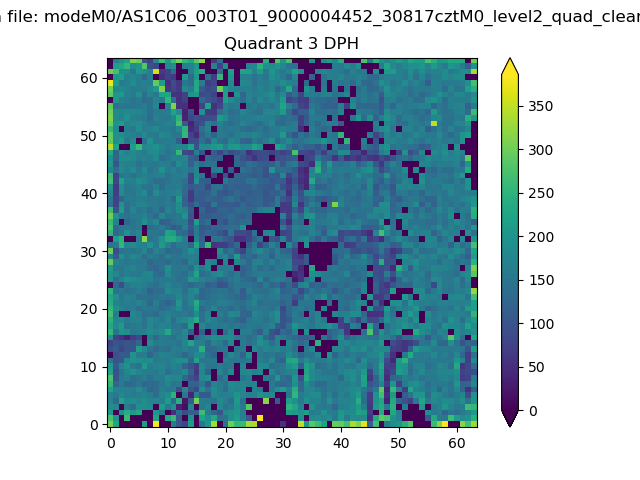 |
 |
Quadrant C |
| Plot type | Count rate plots | Images |
|---|---|---|
| Comparison with Poisson distribution Blue bars denote a histogram of data divided into 1 sec bins. Red curve is a Poisson curve with rate = median count rate of data. |
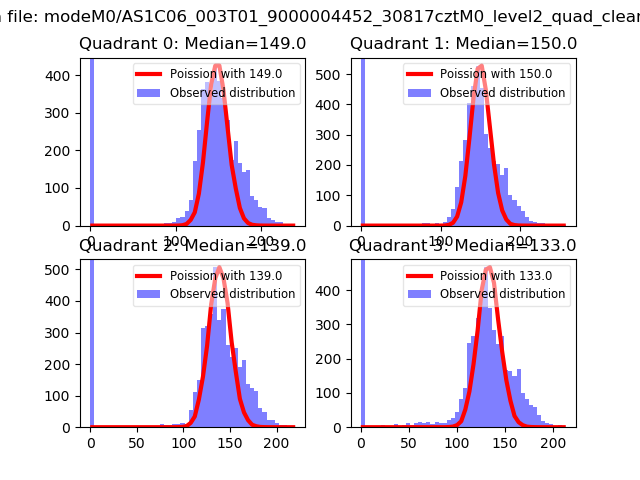 |
 |
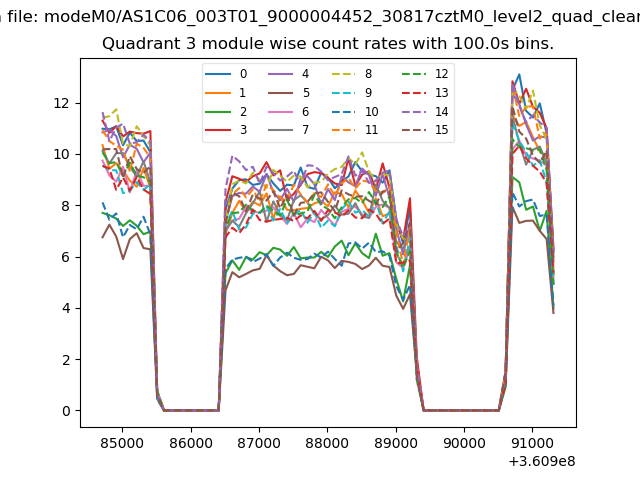
| Quadrant-wise count rates Data is divided into 100 sec bins |
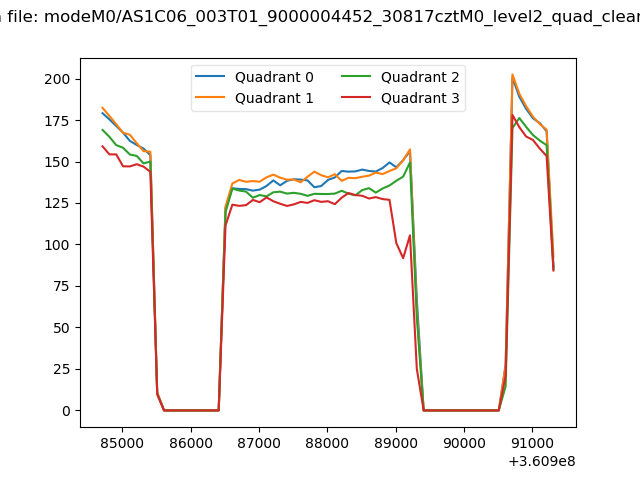 |
|
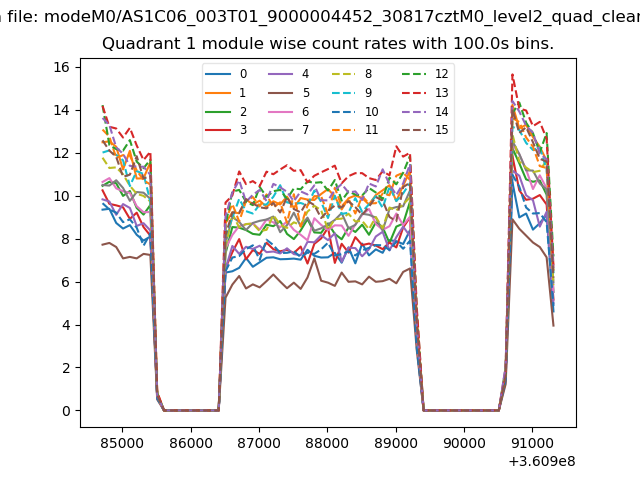
| Module-wise count rates for Quadrant A Data is divided into 100 sec bins |
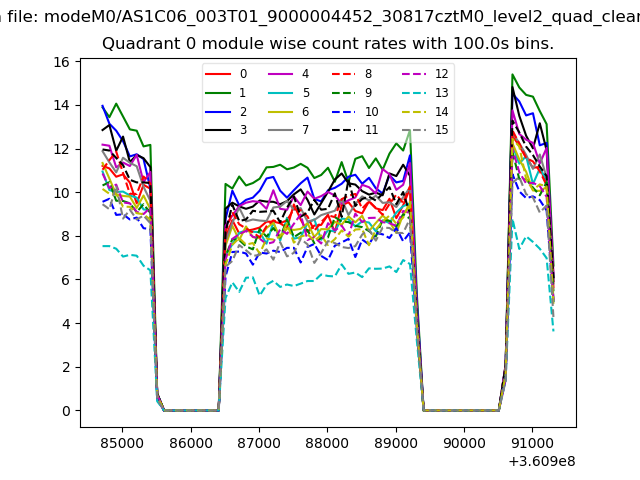 |
 |
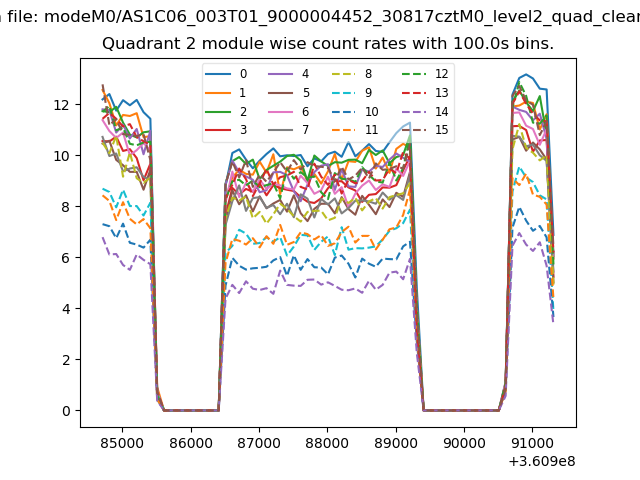
| Module-wise count rates for Quadrant B Data is divided into 100 sec bins |
 |
 |
| Module-wise count rates for Quadrant C Data is divided into 100 sec bins |
 |
 |
| Module-wise count rates for Quadrant D Data is divided into 100 sec bins |
 |
 |
| Parameter | Plot |
|---|---|
| CZT HV Monitor | 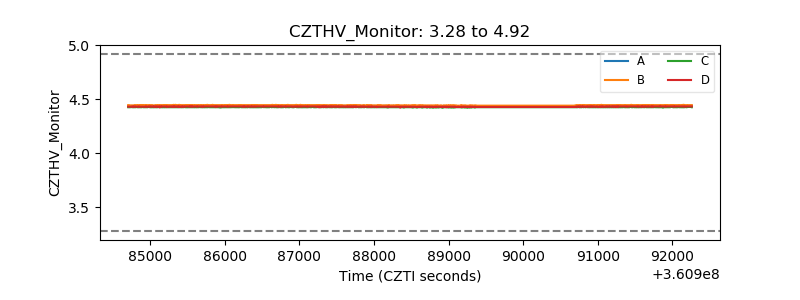 |
| D_VDD | 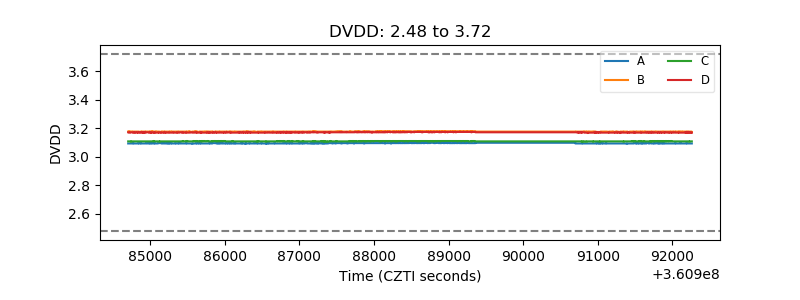 |
| Temperature 1 | 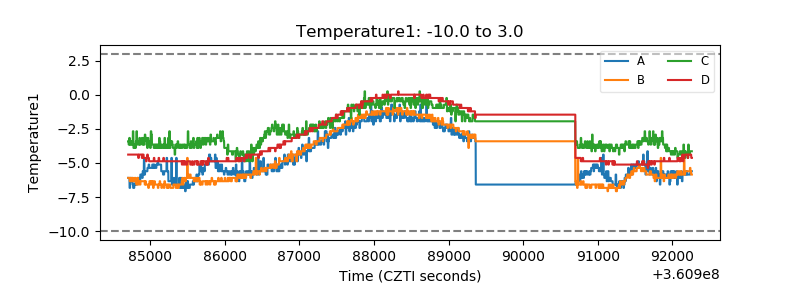 |
| Veto HV Monitor | 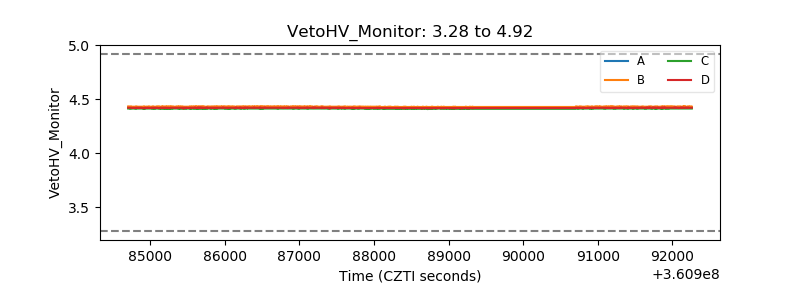 |
| Veto LLD | 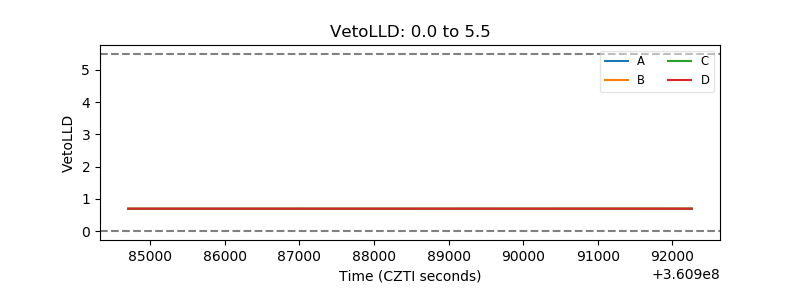 |
| Alpha Counter | 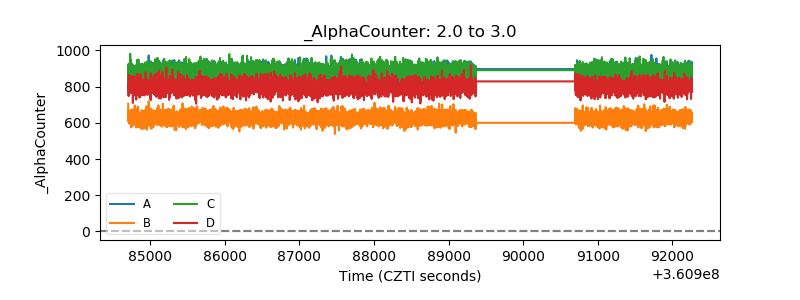 |
| _CPM_Rate | 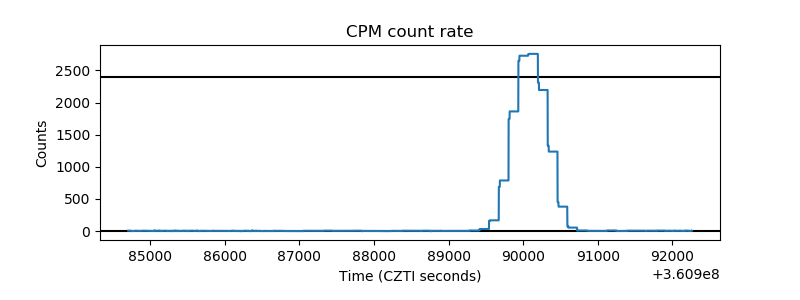 |
| CZT Counter | 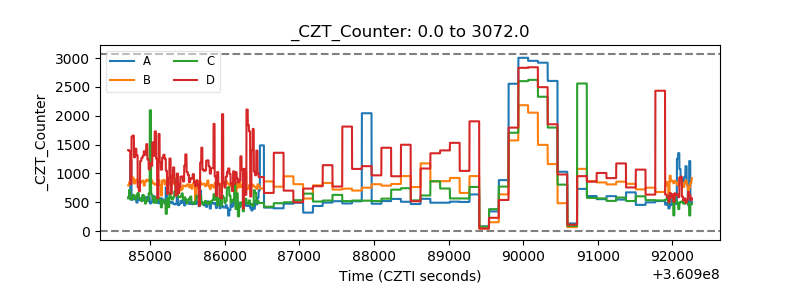 |
| +2.5 Volts monitor |  |
| +5 Volts monitor |  |
| _ROLL_ROT | 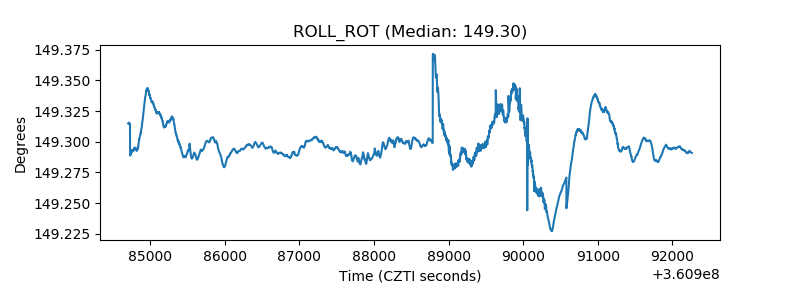 |
| _Roll_DEC | 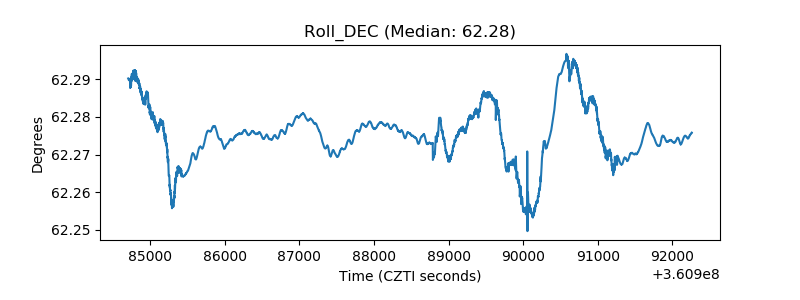 |
| _Roll_RA | 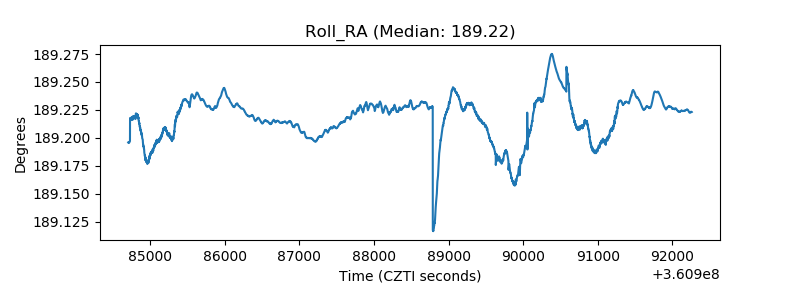 |
| Veto Counter | 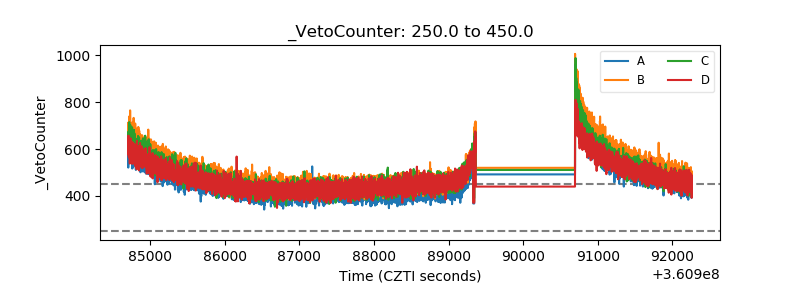 |