| Param | Original file | Final file |
|---|---|---|
| Filename | modeM0/AS1C06_003T01_9000004452_30818cztM0_level2.evt | modeM0/AS1C06_003T01_9000004452_30818cztM0_level2_quad_clean.evt |
| Size (bytes) | 594,794,880 | 90,956,160 |
| Size | 567.2 MB | 86.7 MB |
| Events in quadrant A | 3,825,470 | 601,193 |
| Events in quadrant B | 5,183,385 | 602,725 |
| Events in quadrant C | 3,345,162 | 573,767 |
| Events in quadrant D | 5,246,487 | 549,691 |
| Mode M9 | |||
|---|---|---|---|
| Quadrant | BADHDUFLAG | Total packets | Discarded packets |
| A | 0 | 14 | 0 |
| B | 0 | 14 | 0 |
| C | 0 | 14 | 0 |
| D | 0 | 14 | 0 |
| Mode M0 | |||
|---|---|---|---|
| Quadrant | BADHDUFLAG | Total packets | Discarded packets |
| A | 0 | 14960 | 1 |
| B | 0 | 19453 | 1 |
| C | 0 | 13567 | 1 |
| D | 0 | 19923 | 1 |
| Mode SS | |||
|---|---|---|---|
| Quadrant | BADHDUFLAG | Total packets | Discarded packets |
| A | 0 | 124 | 0 |
| B | 0 | 124 | 0 |
| C | 0 | 124 | 0 |
| D | 0 | 124 | 0 |
| Quadrant | Total seconds | Saturated seconds | Saturation percentage |
|---|---|---|---|
| A | 6114 | 194 | 3.173045% |
| B | 6115 | 206 | 3.368765% |
| C | 6115 | 99 | 1.618970% |
| D | 6115 | 293 | 4.791496% |
Noise dominated data is calculated using 1-second bins in cleaned event files. If a bin has >2000 counts, and if more than 50% of those come from <1% of pixels, then it is considered to be noise-dominated and hence unusable.
| Quadrant | # 1 sec bins | Bins with >0 counts | Bins with >2000 counts | High rate bins dominated by noise | Noise dominated (total time) | Noise dominated (detector-on time) | Marked lightcurve |
|---|---|---|---|---|---|---|---|
| A | 7449 | 6114 | 136 | 136 | 1.83% | 2.22% | 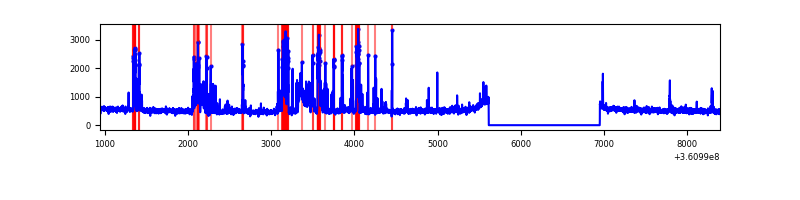 |
| B | 7450 | 6115 | 88 | 88 | 1.18% | 1.44% | 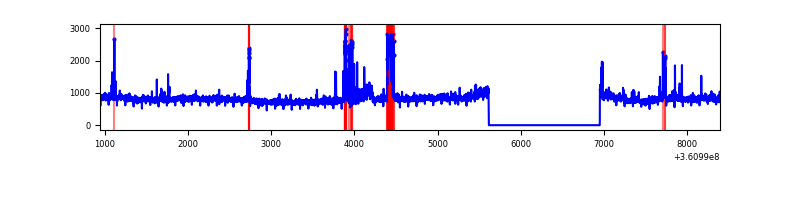 |
| C | 7450 | 6116 | 16 | 16 | 0.21% | 0.26% | 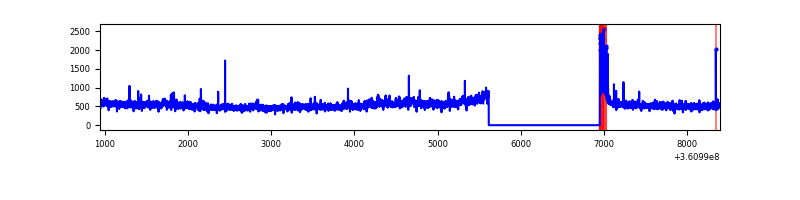 |
| D | 7450 | 6115 | 175 | 175 | 2.35% | 2.86% |  |
Top three noisy pixels from each quadrant. If the there are fewer than three noisy pixels in the level2.evt file, extra rows are filled as -1
| Pixel properties | Quadrant properties | ||||||
|---|---|---|---|---|---|---|---|
| Quadrant | DetID | PixID | Counts | Sigma | Mean | Median | Sigma |
| A | 0 | 13 | 788879 | 5058.81 | 788 | 774 | 155.8 |
| A | 13 | 254 | 11078 | 66.14 | 788 | 774 | 155.8 |
| A | 3 | 137 | 7279 | 41.76 | 788 | 774 | 155.8 |
| B | 6 | 159 | 1745389 | 12092.67 | 779 | 761 | 144.3 |
| B | 5 | 172 | 204414 | 1411.6 | 779 | 761 | 144.3 |
| B | 4 | 80 | 64944 | 444.88 | 779 | 761 | 144.3 |
| C | 3 | 233 | 187056 | 1091.12 | 745 | 750 | 170.7 |
| C | 14 | 238 | 123092 | 716.51 | 745 | 750 | 170.7 |
| C | 0 | 10 | 92663 | 538.3 | 745 | 750 | 170.7 |
| D | 8 | 195 | 1825654 | 10548.2 | 739 | 725 | 173.0 |
| D | 12 | 218 | 326735 | 1884.36 | 739 | 725 | 173.0 |
| D | 10 | 1 | 90963 | 521.58 | 739 | 725 | 173.0 |
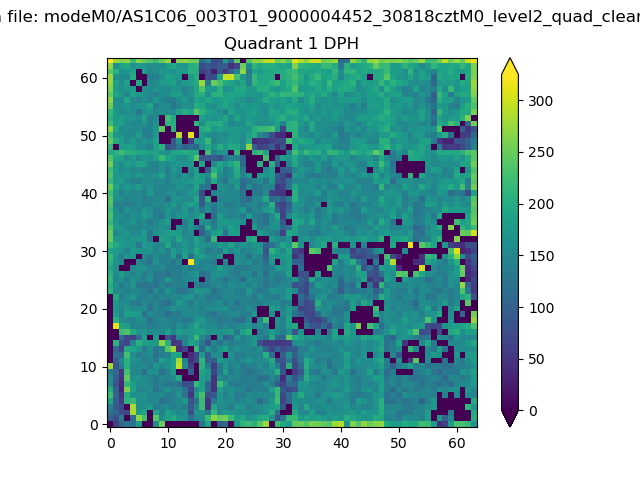
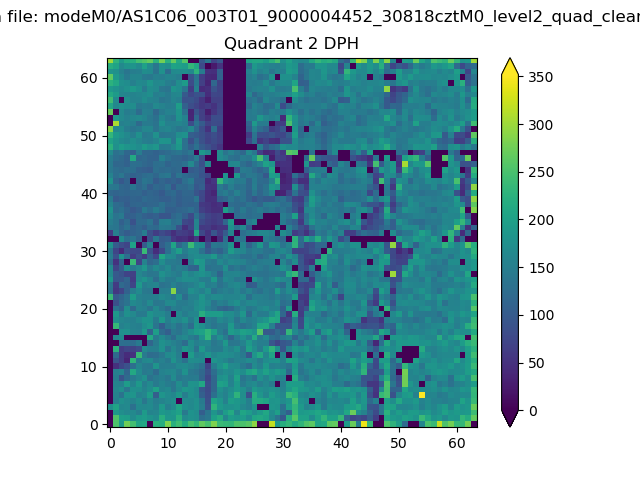
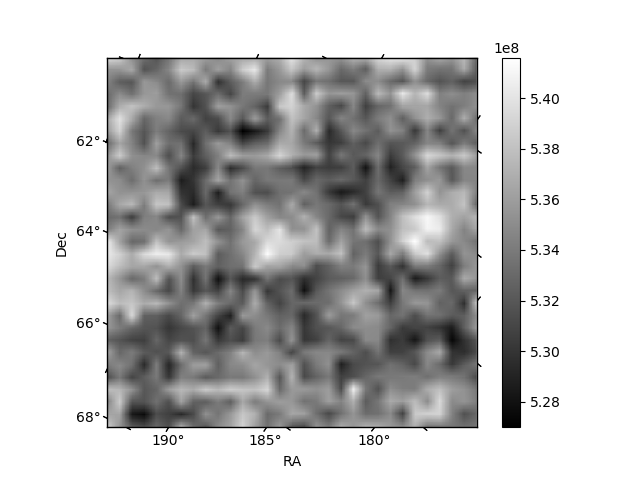
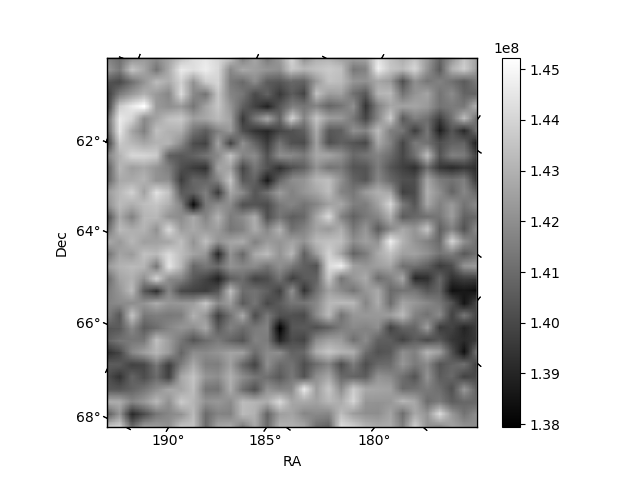
Histogram calculated using DETX and DETY for each event in the final _common_clean file
| Quadrant A | 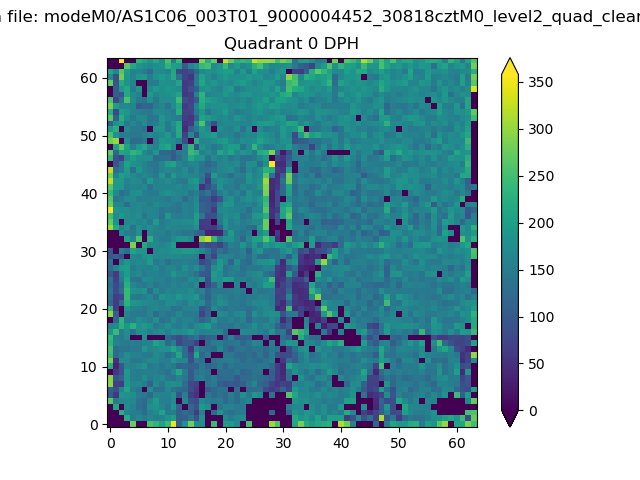 |
 |
Quadrant B |
|---|---|---|---|
| Quadrant D | 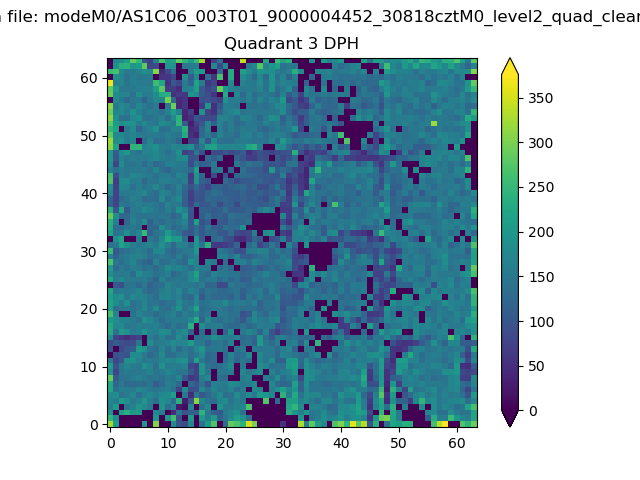 |
 |
Quadrant C |
| Plot type | Count rate plots | Images |
|---|---|---|
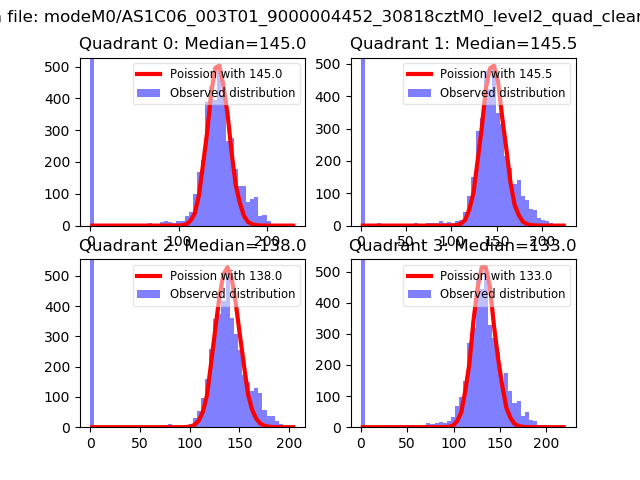
| Comparison with Poisson distribution Blue bars denote a histogram of data divided into 1 sec bins. Red curve is a Poisson curve with rate = median count rate of data. |
 |
 |
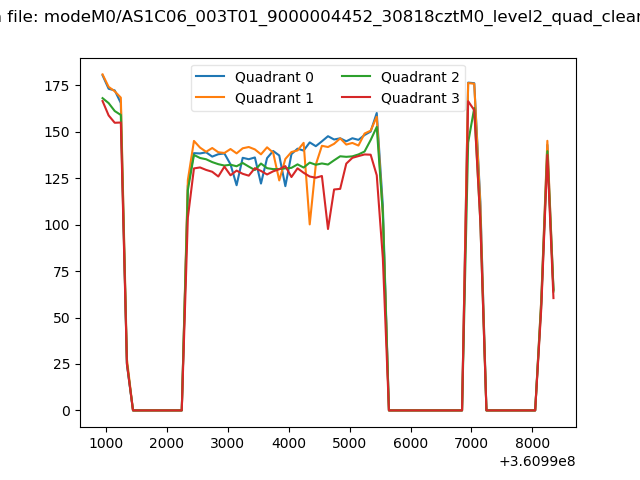
| Quadrant-wise count rates Data is divided into 100 sec bins |
 |
|
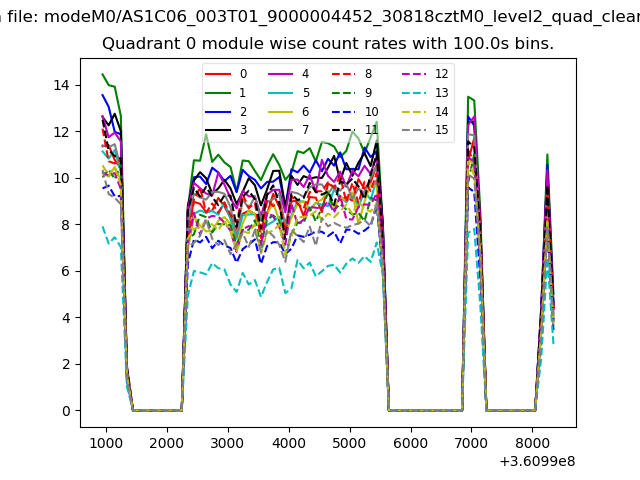
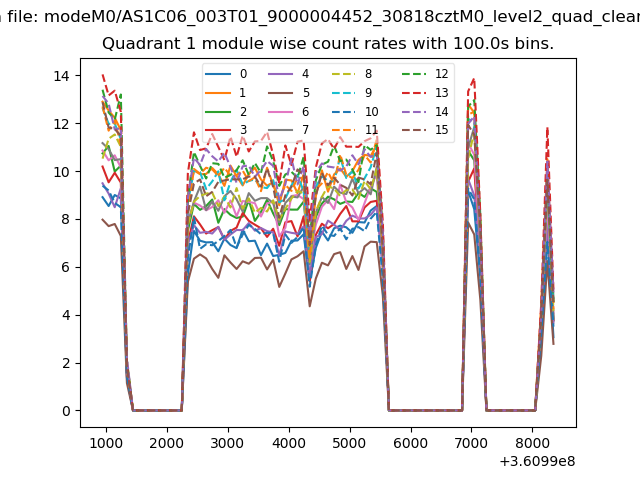
| Module-wise count rates for Quadrant A Data is divided into 100 sec bins |
 |
 |
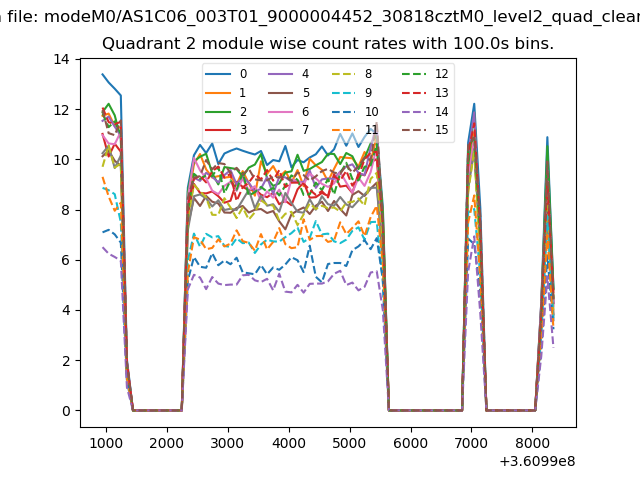
| Module-wise count rates for Quadrant B Data is divided into 100 sec bins |
 |
 |
| Module-wise count rates for Quadrant C Data is divided into 100 sec bins |
 |
 |
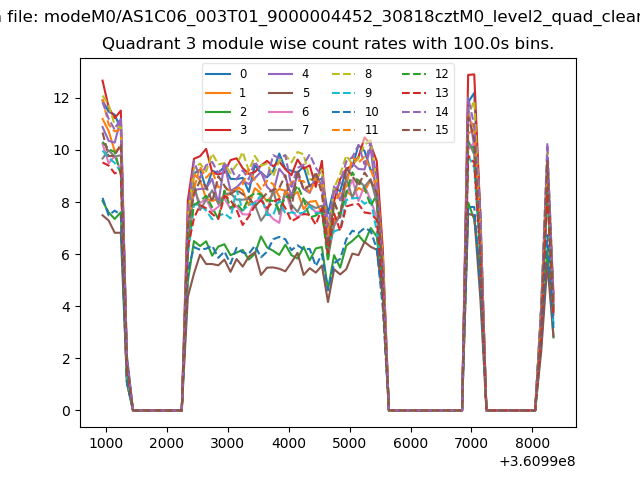
| Module-wise count rates for Quadrant D Data is divided into 100 sec bins |
 |
 |
| Parameter | Plot |
|---|---|
| CZT HV Monitor |  |
| D_VDD | 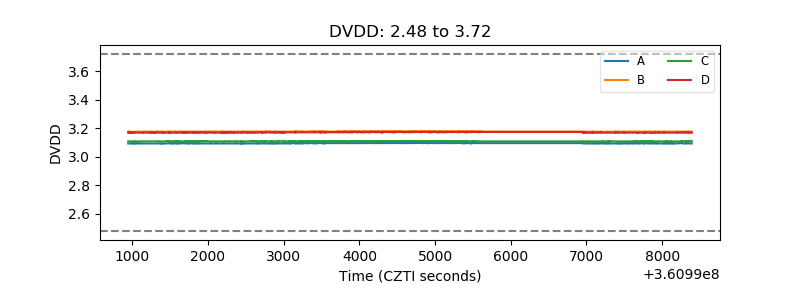 |
| Temperature 1 | 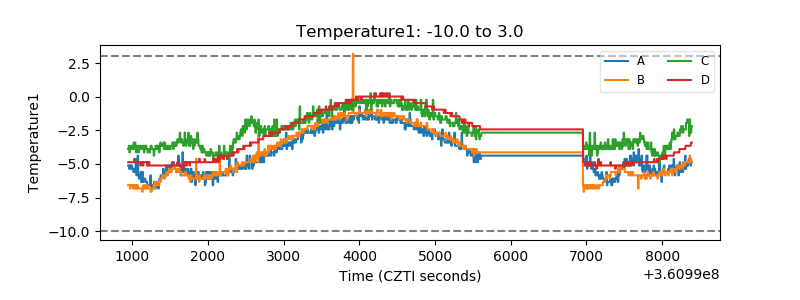 |
| Veto HV Monitor | 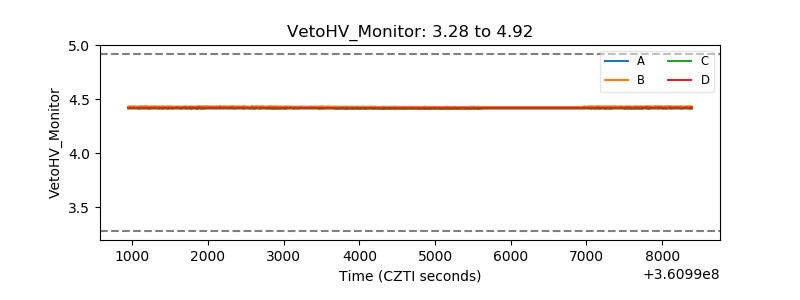 |
| Veto LLD | 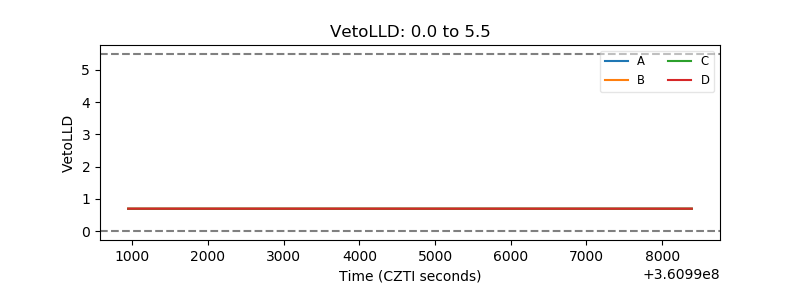 |
| Alpha Counter | 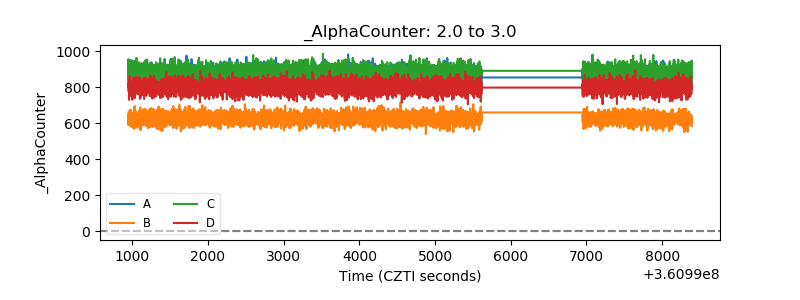 |
| _CPM_Rate | 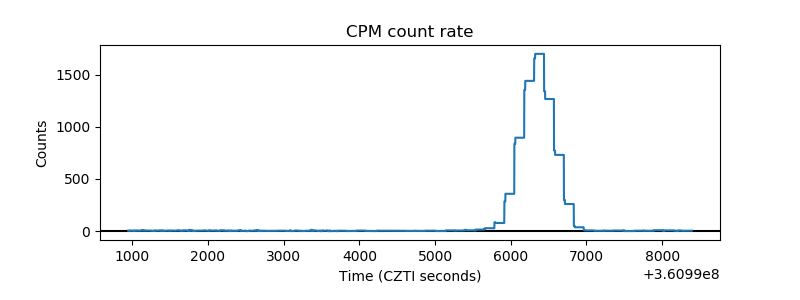 |
| CZT Counter | 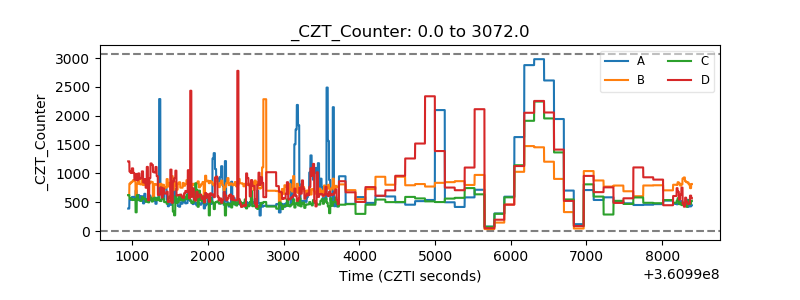 |
| +2.5 Volts monitor |  |
| +5 Volts monitor |  |
| _ROLL_ROT | 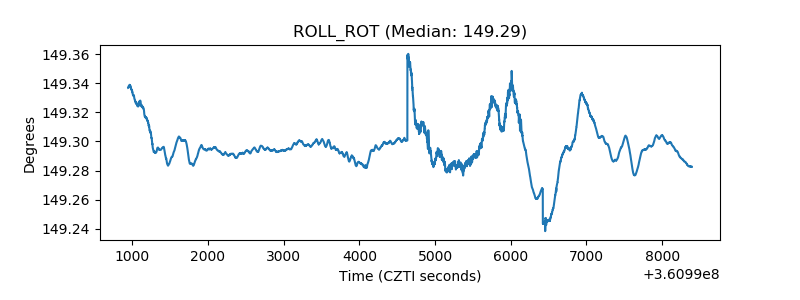 |
| _Roll_DEC | 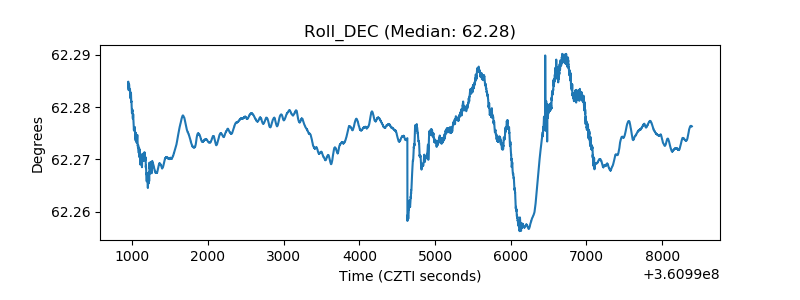 |
| _Roll_RA | 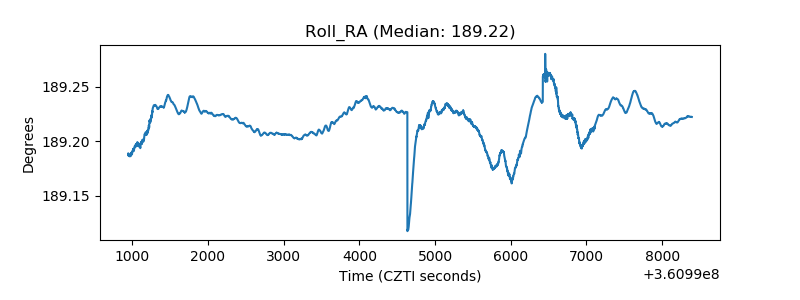 |
| Veto Counter | 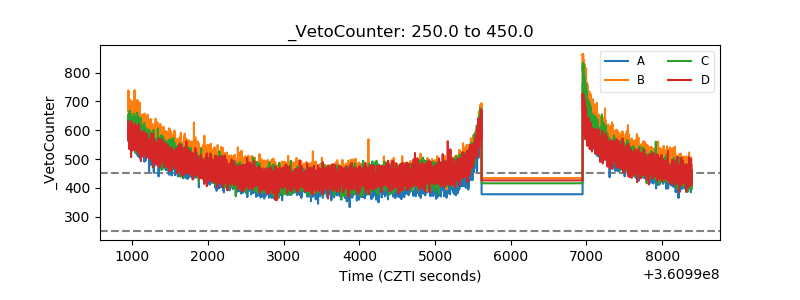 |