| Param | Original file | Final file |
|---|---|---|
| Filename | modeM0/AS1C06_003T01_9000004452_30820cztM0_level2.evt | modeM0/AS1C06_003T01_9000004452_30820cztM0_level2_quad_clean.evt |
| Size (bytes) | 603,031,680 | 107,714,880 |
| Size | 575.1 MB | 102.7 MB |
| Events in quadrant A | 3,162,815 | 729,727 |
| Events in quadrant B | 5,168,154 | 724,551 |
| Events in quadrant C | 3,275,437 | 697,291 |
| Events in quadrant D | 6,212,288 | 652,704 |
| Mode M9 | |||
|---|---|---|---|
| Quadrant | BADHDUFLAG | Total packets | Discarded packets |
| A | 0 | 8 | 0 |
| B | 0 | 8 | 0 |
| C | 0 | 8 | 0 |
| D | 0 | 8 | 0 |
| Mode M0 | |||
|---|---|---|---|
| Quadrant | BADHDUFLAG | Total packets | Discarded packets |
| A | 0 | 13535 | 1 |
| B | 0 | 20178 | 1 |
| C | 0 | 13714 | 1 |
| D | 0 | 23044 | 1 |
| Mode SS | |||
|---|---|---|---|
| Quadrant | BADHDUFLAG | Total packets | Discarded packets |
| A | 0 | 132 | 0 |
| B | 0 | 132 | 0 |
| C | 0 | 132 | 0 |
| D | 0 | 132 | 0 |
| Quadrant | Total seconds | Saturated seconds | Saturation percentage |
|---|---|---|---|
| A | 6568 | 114 | 1.735688% |
| B | 6569 | 189 | 2.877150% |
| C | 6569 | 147 | 2.237784% |
| D | 6568 | 546 | 8.313033% |
Noise dominated data is calculated using 1-second bins in cleaned event files. If a bin has >2000 counts, and if more than 50% of those come from <1% of pixels, then it is considered to be noise-dominated and hence unusable.
| Quadrant | # 1 sec bins | Bins with >0 counts | Bins with >2000 counts | High rate bins dominated by noise | Noise dominated (total time) | Noise dominated (detector-on time) | Marked lightcurve |
|---|---|---|---|---|---|---|---|
| A | 7378 | 6568 | 1 | 1 | 0.01% | 0.02% | 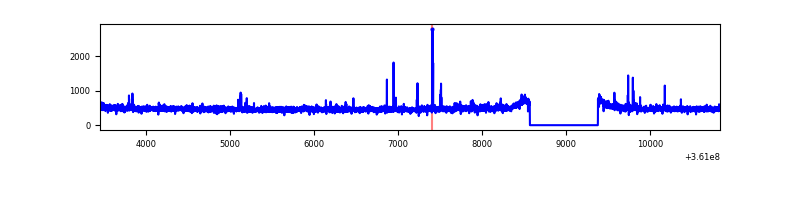 |
| B | 7379 | 6569 | 11 | 11 | 0.15% | 0.17% | 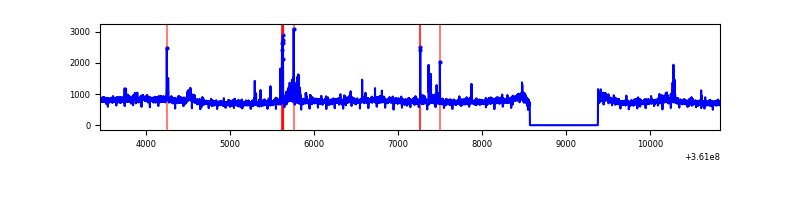 |
| C | 7379 | 6569 | 3 | 3 | 0.04% | 0.05% |  |
| D | 7378 | 6568 | 441 | 441 | 5.98% | 6.71% | 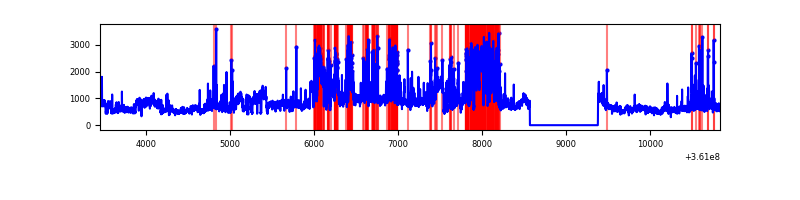 |
Top three noisy pixels from each quadrant. If the there are fewer than three noisy pixels in the level2.evt file, extra rows are filled as -1
| Pixel properties | Quadrant properties | ||||||
|---|---|---|---|---|---|---|---|
| Quadrant | DetID | PixID | Counts | Sigma | Mean | Median | Sigma |
| A | 0 | 13 | 36513 | 221.73 | 806 | 788 | 161.1 |
| A | 12 | 96 | 16602 | 98.15 | 806 | 788 | 161.1 |
| A | 13 | 254 | 12653 | 73.64 | 806 | 788 | 161.1 |
| B | 6 | 159 | 1847605 | 12306.68 | 792 | 769 | 150.1 |
| B | 0 | 155 | 48267 | 316.51 | 792 | 769 | 150.1 |
| B | 5 | 172 | 47261 | 309.81 | 792 | 769 | 150.1 |
| C | 14 | 238 | 125825 | 709.39 | 761 | 765 | 176.3 |
| C | 3 | 233 | 109687 | 617.85 | 761 | 765 | 176.3 |
| C | 0 | 10 | 35043 | 194.44 | 761 | 765 | 176.3 |
| D | 8 | 195 | 2001206 | 11313.01 | 751 | 733 | 176.8 |
| D | 12 | 218 | 768395 | 4341.26 | 751 | 733 | 176.8 |
| D | 2 | 250 | 314448 | 1774.11 | 751 | 733 | 176.8 |
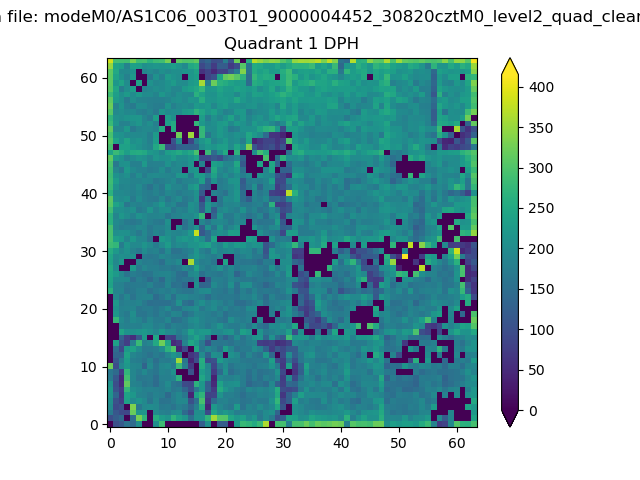
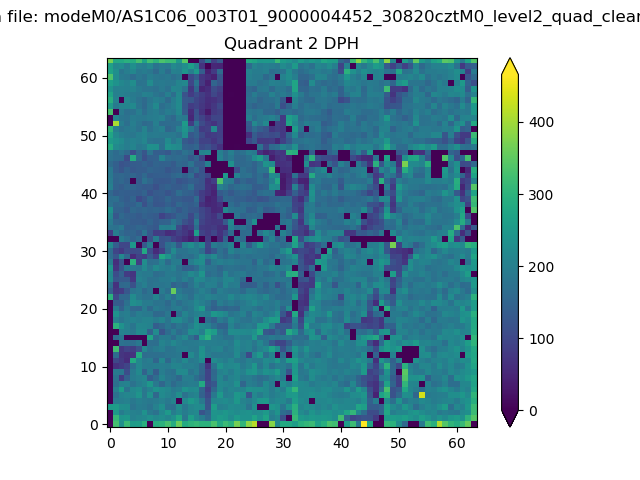
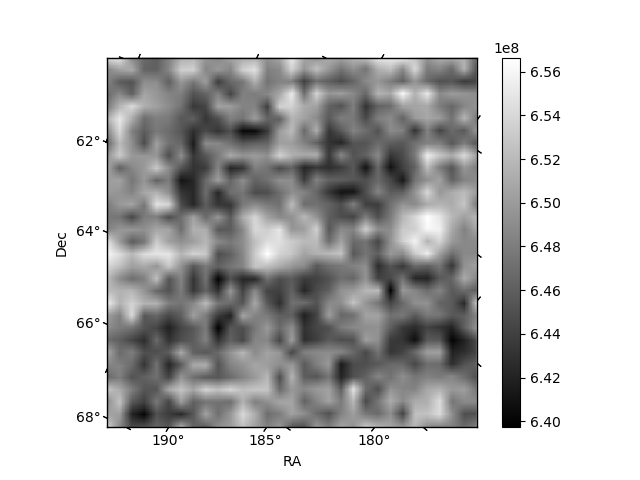
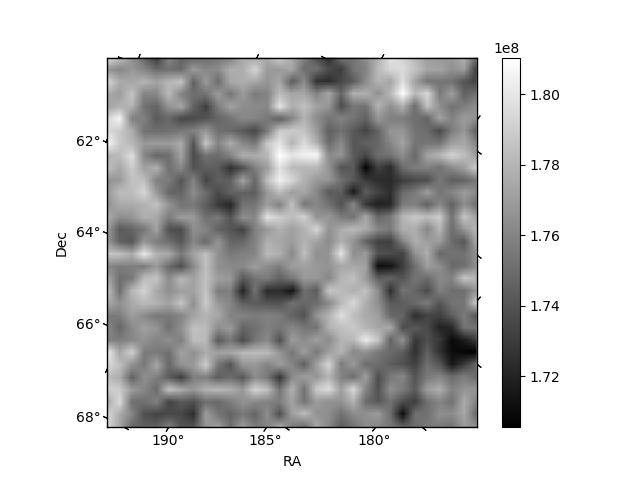
Histogram calculated using DETX and DETY for each event in the final _common_clean file
| Quadrant A | 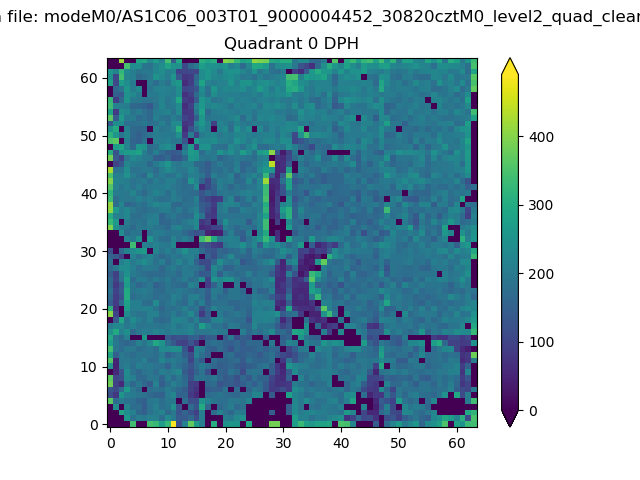 |
 |
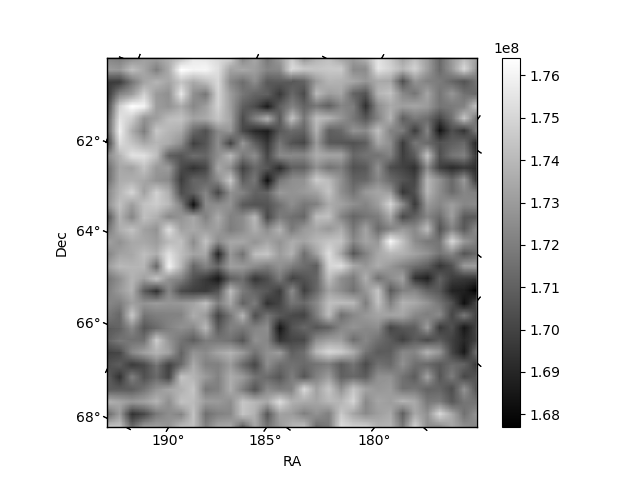
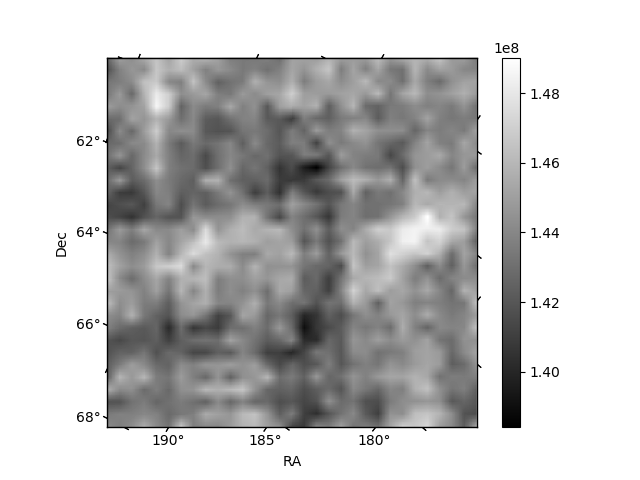
Quadrant B |
|---|---|---|---|
| Quadrant D | 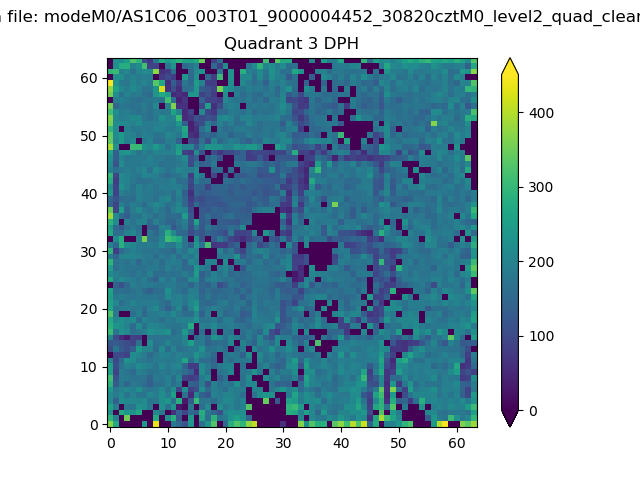 |
 |
Quadrant C |
| Plot type | Count rate plots | Images |
|---|---|---|
| Comparison with Poisson distribution Blue bars denote a histogram of data divided into 1 sec bins. Red curve is a Poisson curve with rate = median count rate of data. |
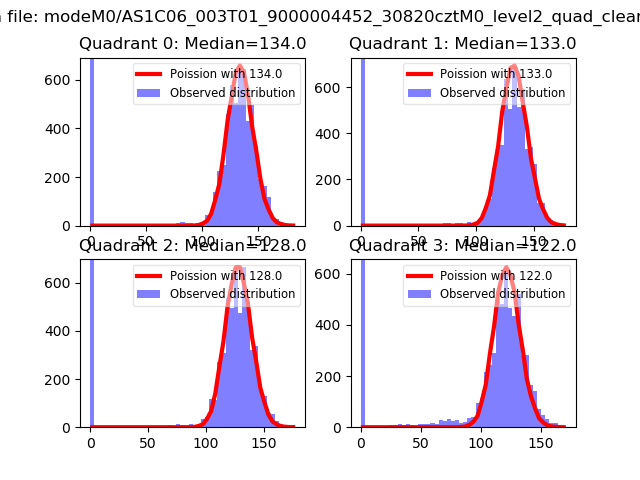 |
 |
| Quadrant-wise count rates Data is divided into 100 sec bins |
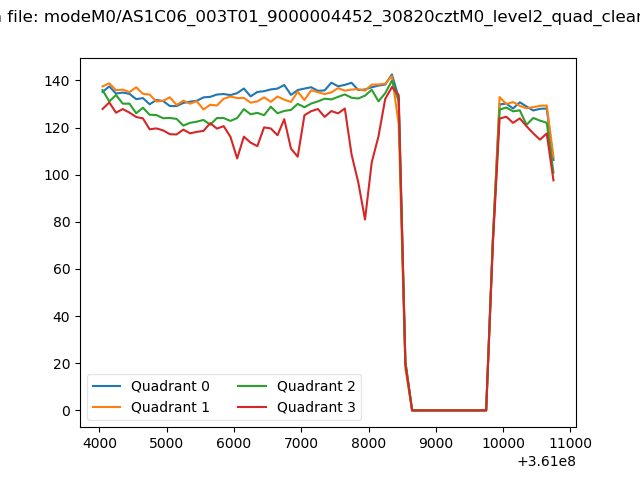 |
|
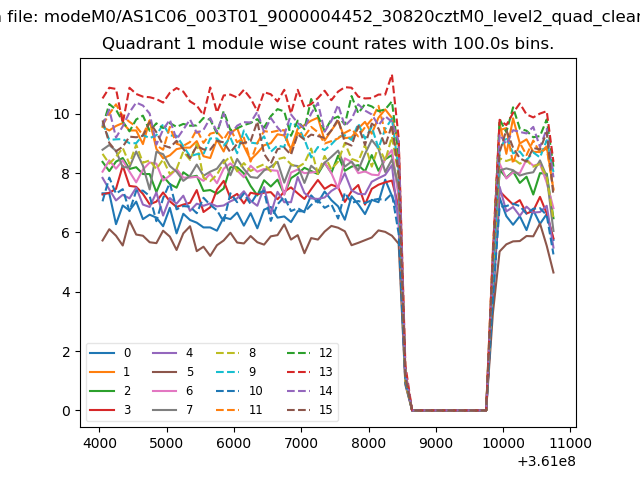
| Module-wise count rates for Quadrant A Data is divided into 100 sec bins |
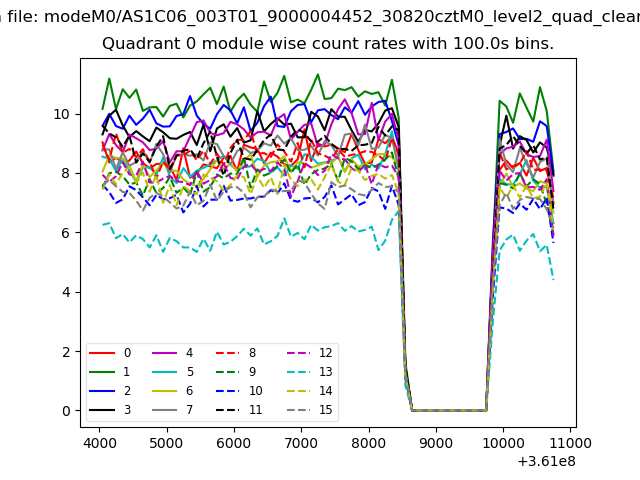 |
 |
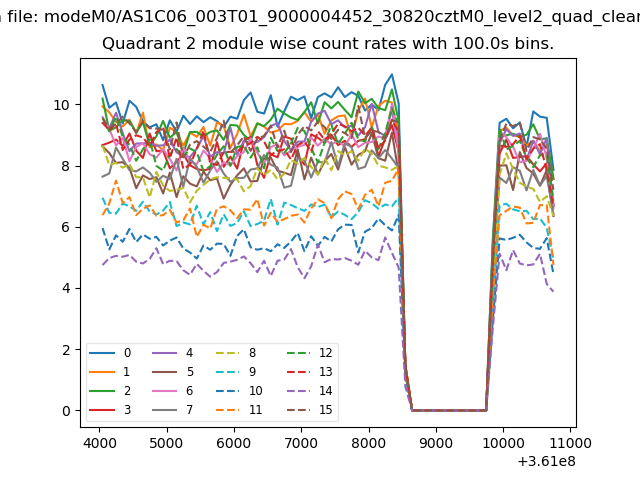
| Module-wise count rates for Quadrant B Data is divided into 100 sec bins |
 |
 |
| Module-wise count rates for Quadrant C Data is divided into 100 sec bins |
 |
 |
| Module-wise count rates for Quadrant D Data is divided into 100 sec bins |
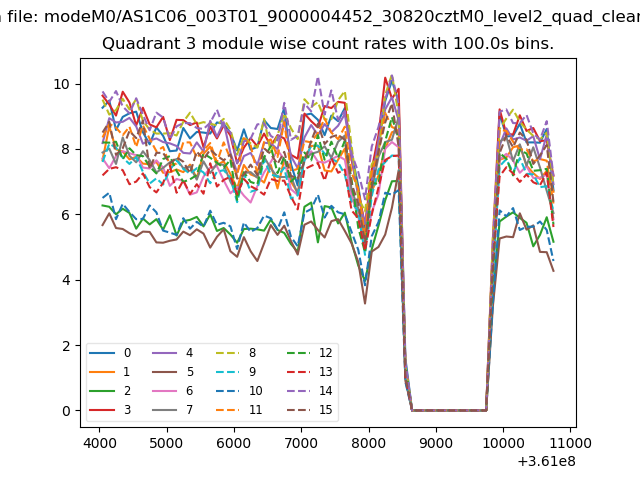 |
 |
| Parameter | Plot |
|---|---|
| CZT HV Monitor | 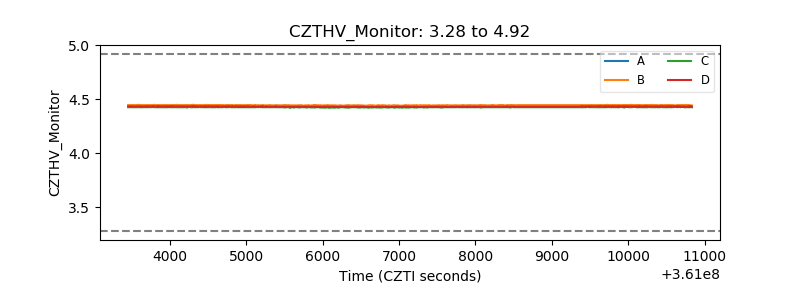 |
| D_VDD | 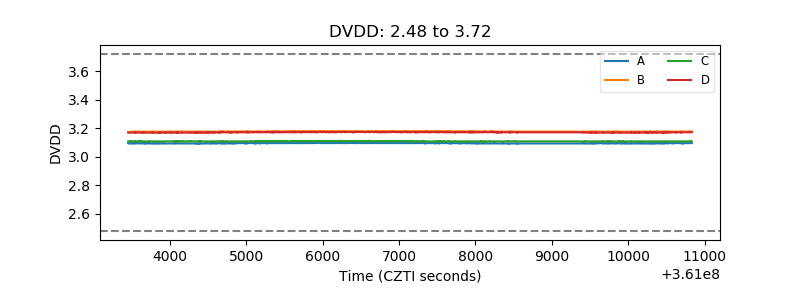 |
| Temperature 1 | 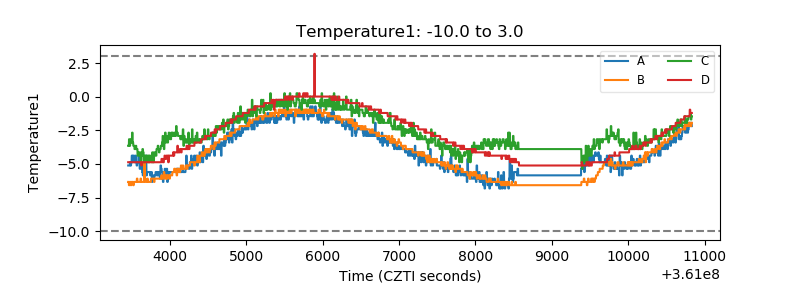 |
| Veto HV Monitor |  |
| Veto LLD | 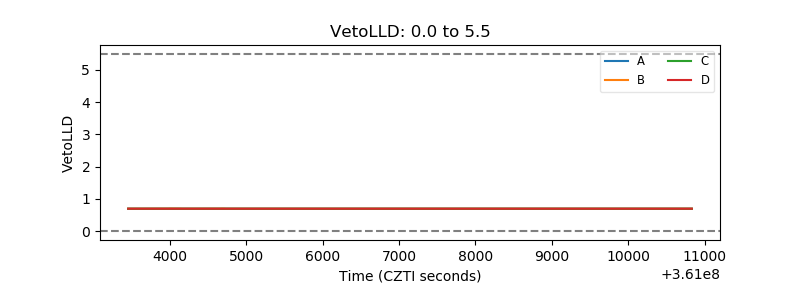 |
| Alpha Counter | 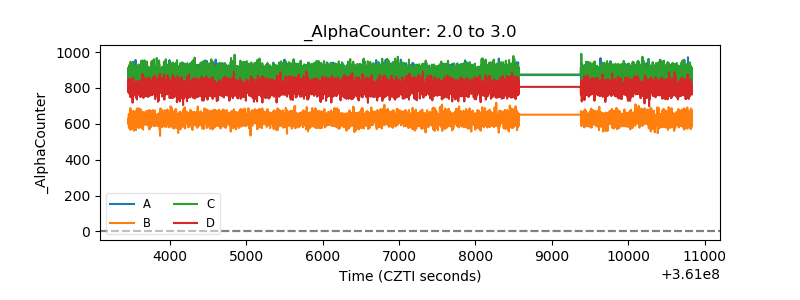 |
| _CPM_Rate | 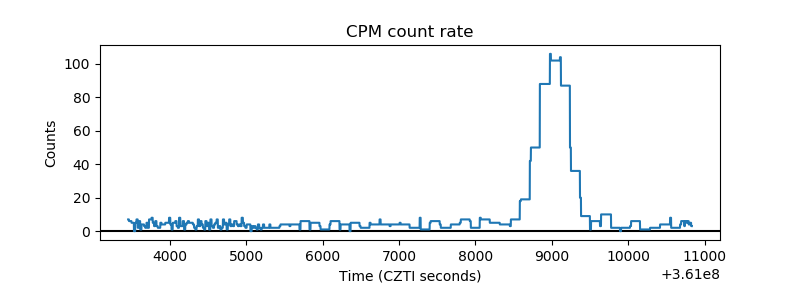 |
| CZT Counter | 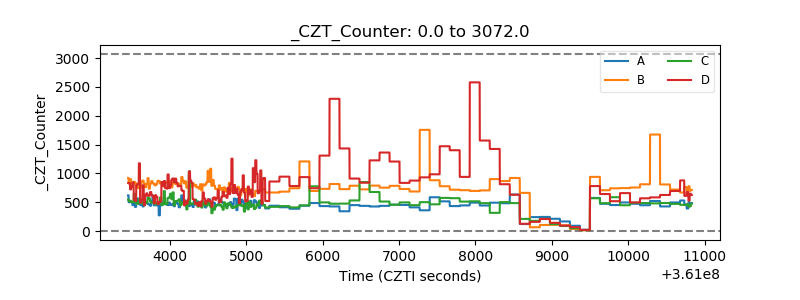 |
| +2.5 Volts monitor |  |
| +5 Volts monitor | 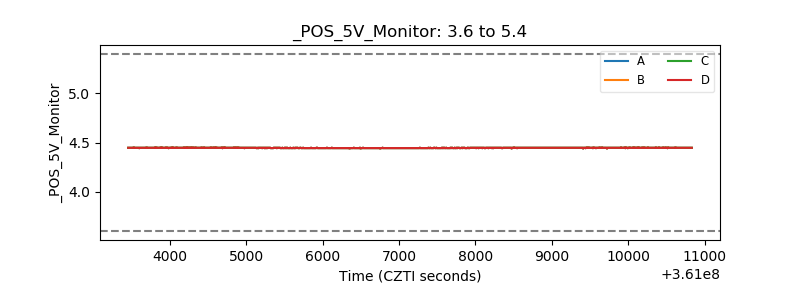 |
| _ROLL_ROT | 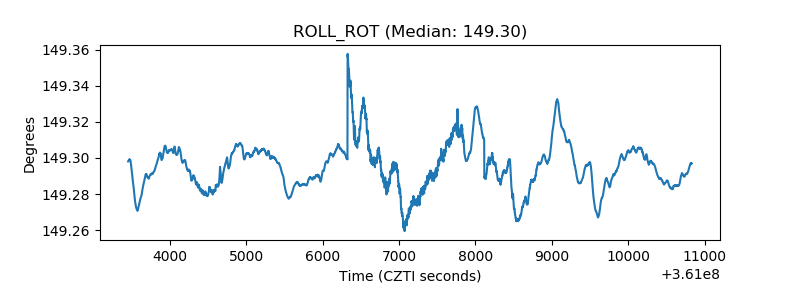 |
| _Roll_DEC | 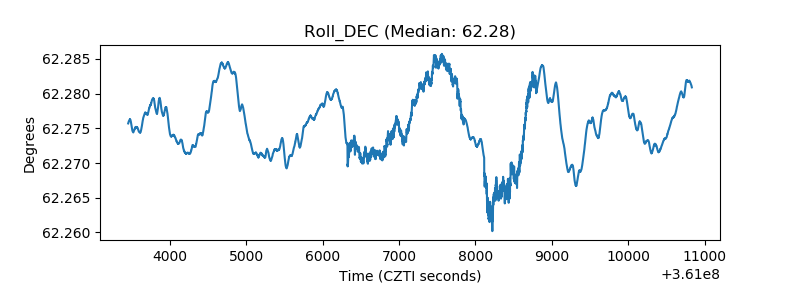 |
| _Roll_RA | 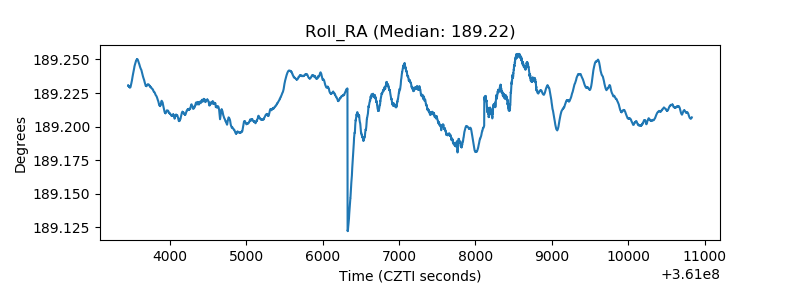 |
| Veto Counter | 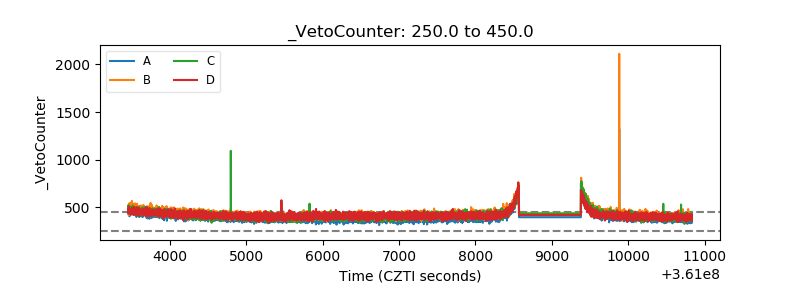 |