| Param | Original file | Final file |
|---|---|---|
| Filename | modeM0/AS1C06_003T01_9000004452_30821cztM0_level2.evt | modeM0/AS1C06_003T01_9000004452_30821cztM0_level2_quad_clean.evt |
| Size (bytes) | 670,374,720 | 118,802,880 |
| Size | 639.3 MB | 113.3 MB |
| Events in quadrant A | 3,708,698 | 803,741 |
| Events in quadrant B | 5,613,920 | 800,931 |
| Events in quadrant C | 3,489,651 | 775,396 |
| Events in quadrant D | 7,016,399 | 729,729 |
| Mode M9 | |||
|---|---|---|---|
| Quadrant | BADHDUFLAG | Total packets | Discarded packets |
| A | 0 | 4 | 0 |
| B | 0 | 4 | 0 |
| C | 0 | 4 | 0 |
| D | 0 | 4 | 0 |
| Mode M0 | |||
|---|---|---|---|
| Quadrant | BADHDUFLAG | Total packets | Discarded packets |
| A | 0 | 15603 | 1 |
| B | 0 | 21867 | 1 |
| C | 0 | 14707 | 1 |
| D | 0 | 25800 | 1 |
| Mode SS | |||
|---|---|---|---|
| Quadrant | BADHDUFLAG | Total packets | Discarded packets |
| A | 0 | 142 | 0 |
| B | 0 | 142 | 0 |
| C | 0 | 142 | 0 |
| D | 0 | 142 | 0 |
| Quadrant | Total seconds | Saturated seconds | Saturation percentage |
|---|---|---|---|
| A | 7009 | 241 | 3.438436% |
| B | 7010 | 289 | 4.122682% |
| C | 7010 | 186 | 2.653352% |
| D | 7010 | 666 | 9.500713% |
Noise dominated data is calculated using 1-second bins in cleaned event files. If a bin has >2000 counts, and if more than 50% of those come from <1% of pixels, then it is considered to be noise-dominated and hence unusable.
| Quadrant | # 1 sec bins | Bins with >0 counts | Bins with >2000 counts | High rate bins dominated by noise | Noise dominated (total time) | Noise dominated (detector-on time) | Marked lightcurve |
|---|---|---|---|---|---|---|---|
| A | 7359 | 7009 | 88 | 88 | 1.20% | 1.26% | 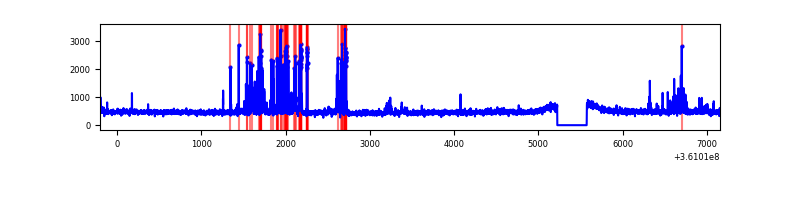 |
| B | 7360 | 7010 | 62 | 62 | 0.84% | 0.88% | 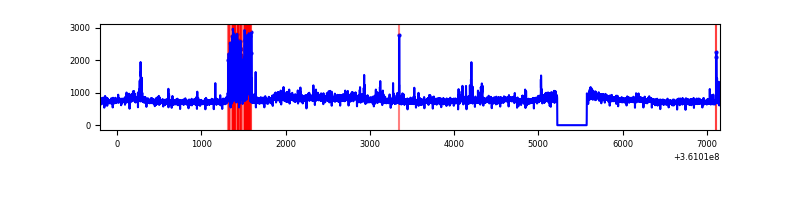 |
| C | 7360 | 7010 | 10 | 10 | 0.14% | 0.14% | 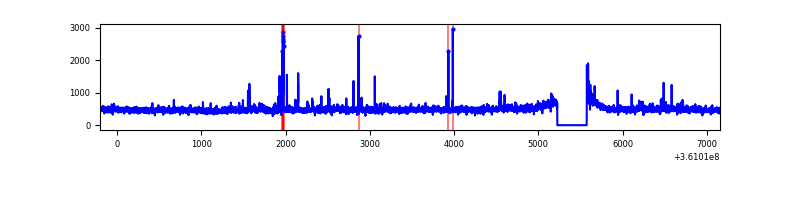 |
| D | 7360 | 7010 | 600 | 600 | 8.15% | 8.56% | 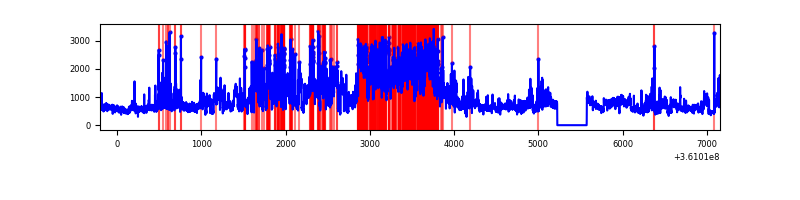 |
Top three noisy pixels from each quadrant. If the there are fewer than three noisy pixels in the level2.evt file, extra rows are filled as -1
| Pixel properties | Quadrant properties | ||||||
|---|---|---|---|---|---|---|---|
| Quadrant | DetID | PixID | Counts | Sigma | Mean | Median | Sigma |
| A | 0 | 13 | 455140 | 2679.37 | 839 | 820 | 169.6 |
| A | 13 | 254 | 13431 | 74.37 | 839 | 820 | 169.6 |
| A | 0 | 31 | 12463 | 68.67 | 839 | 820 | 169.6 |
| B | 6 | 159 | 1961060 | 12391.61 | 827 | 806 | 158.2 |
| B | 5 | 172 | 207105 | 1304.1 | 827 | 806 | 158.2 |
| B | 0 | 190 | 47637 | 296.04 | 827 | 806 | 158.2 |
| C | 3 | 233 | 137571 | 730.83 | 801 | 805 | 187.1 |
| C | 14 | 238 | 129116 | 685.65 | 801 | 805 | 187.1 |
| C | 0 | 10 | 57449 | 302.69 | 801 | 805 | 187.1 |
| D | 8 | 195 | 1853199 | 9709.78 | 793 | 772 | 190.8 |
| D | 13 | 174 | 1136746 | 5954.38 | 793 | 772 | 190.8 |
| D | 12 | 218 | 366007 | 1914.44 | 793 | 772 | 190.8 |
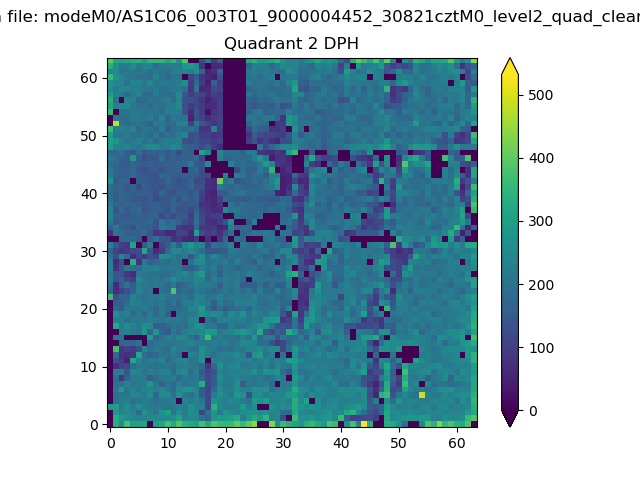
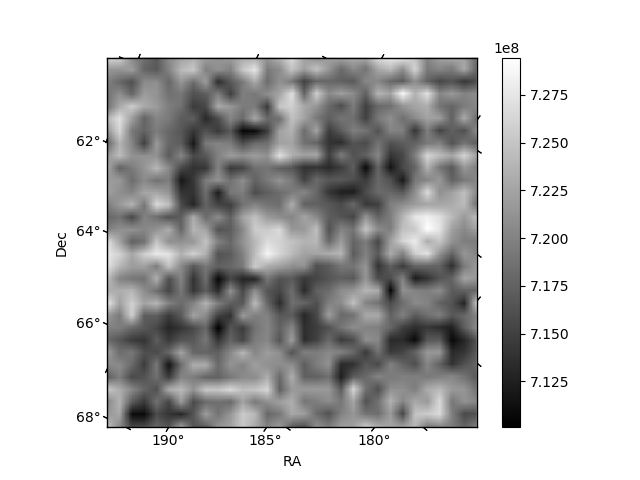
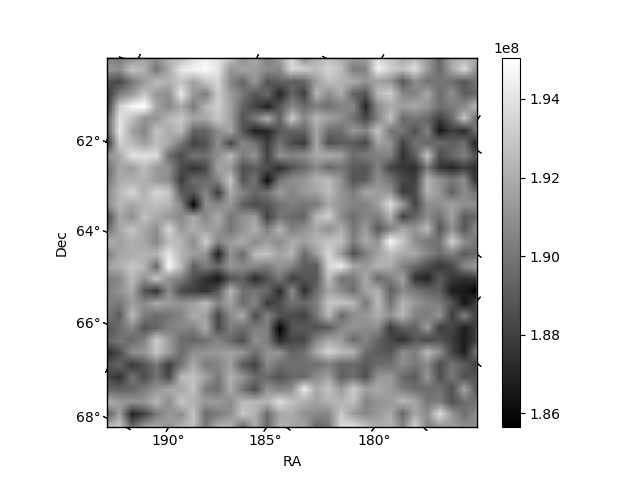
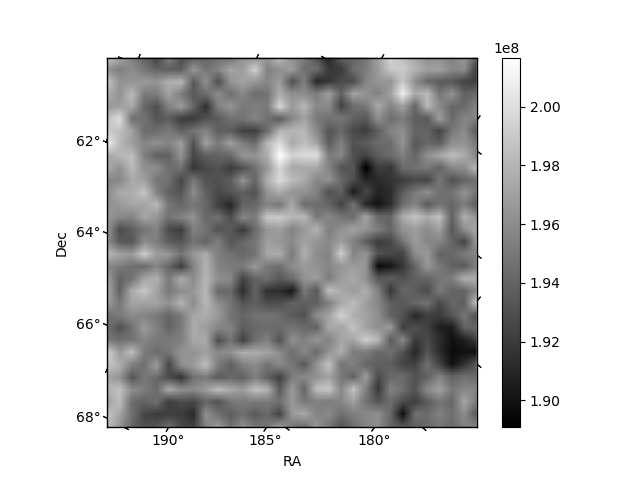
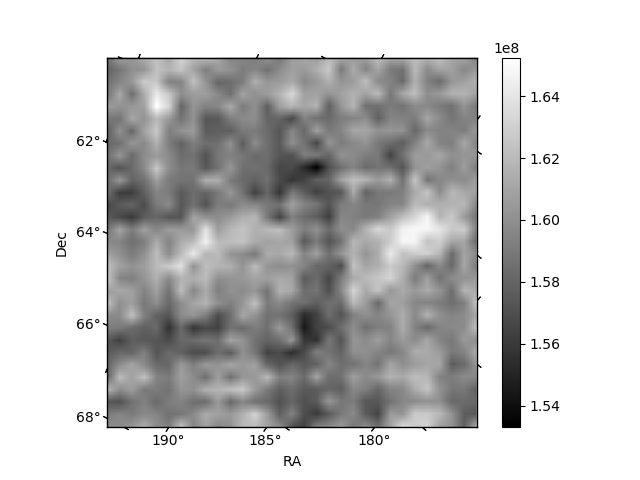
Histogram calculated using DETX and DETY for each event in the final _common_clean file
| Quadrant A | 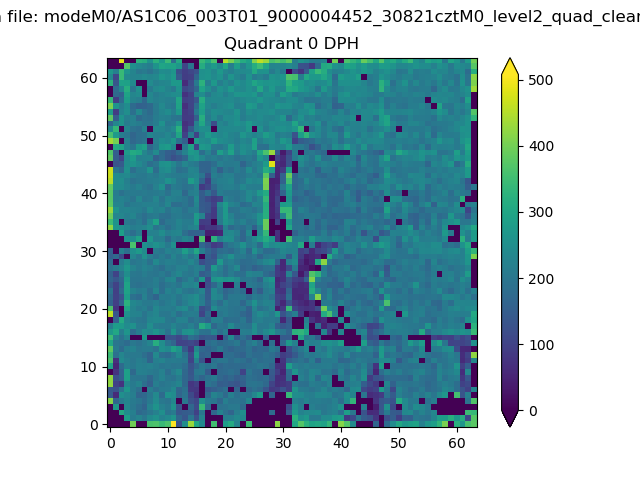 |
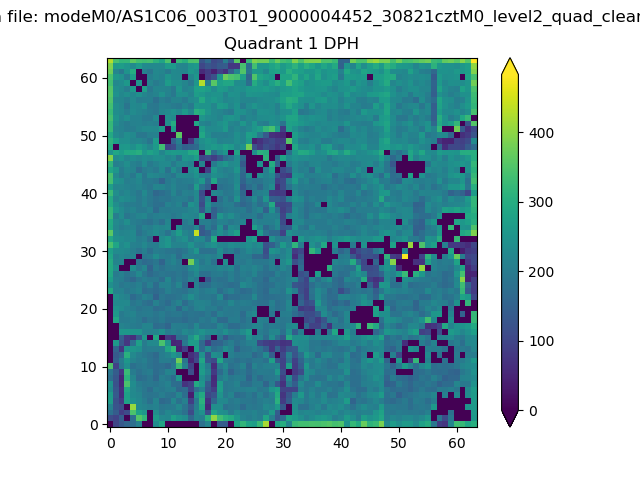 |
Quadrant B |
|---|---|---|---|
| Quadrant D | 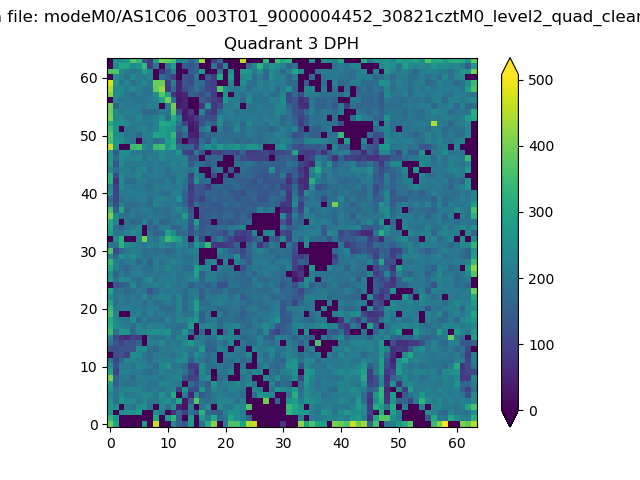 |
 |
Quadrant C |
| Plot type | Count rate plots | Images |
|---|---|---|
| Comparison with Poisson distribution Blue bars denote a histogram of data divided into 1 sec bins. Red curve is a Poisson curve with rate = median count rate of data. |
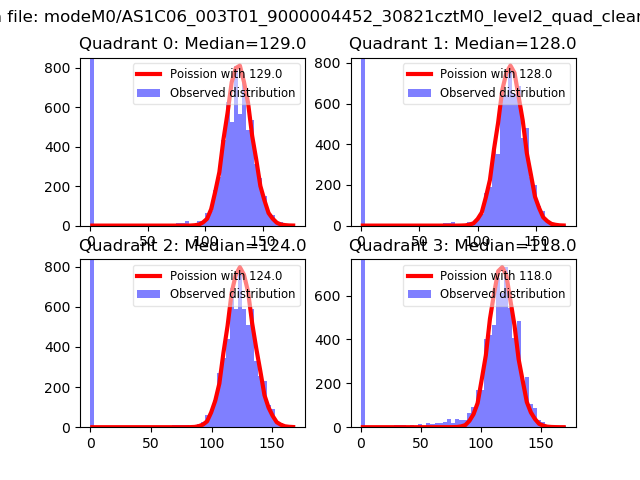 |
 |
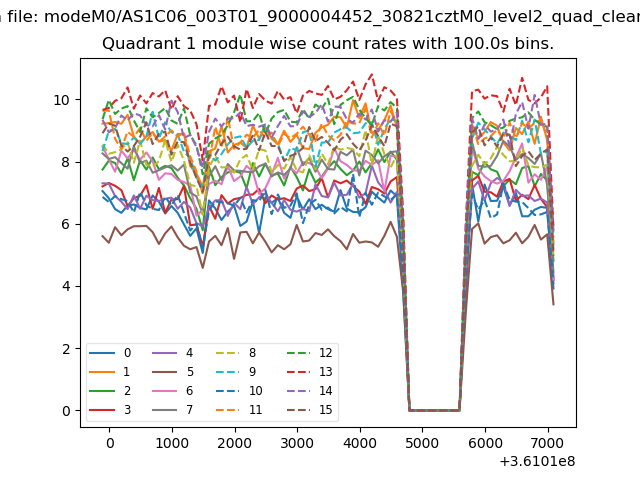
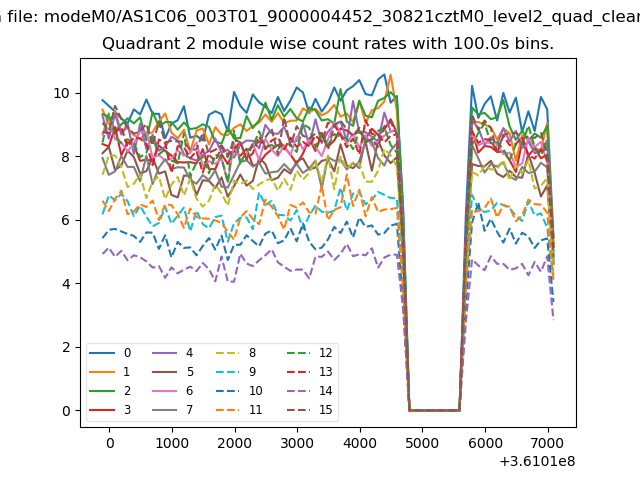
| Quadrant-wise count rates Data is divided into 100 sec bins |
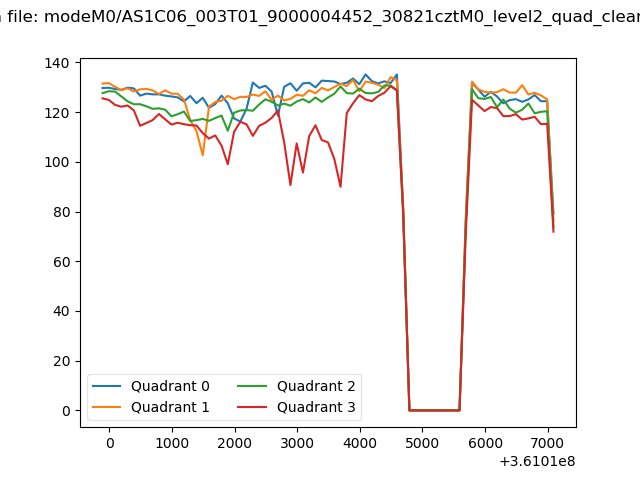 |
|
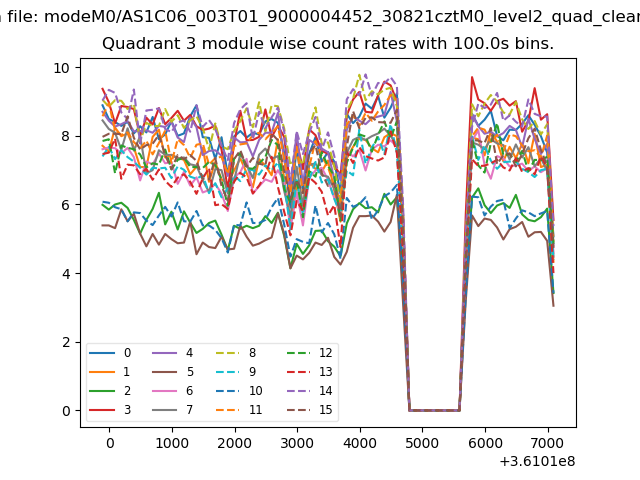
| Module-wise count rates for Quadrant A Data is divided into 100 sec bins |
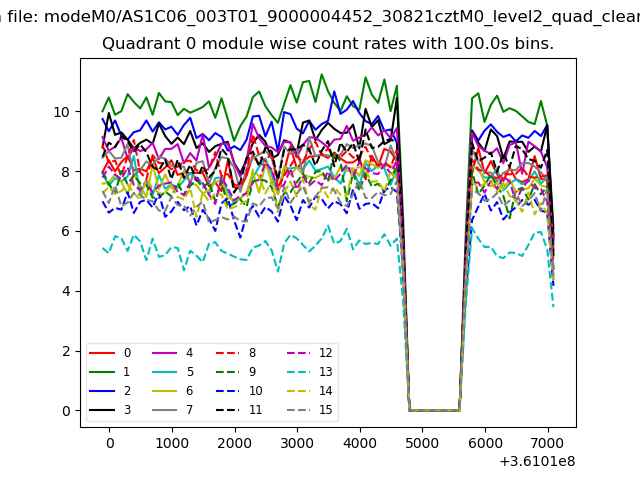 |
 |
| Module-wise count rates for Quadrant B Data is divided into 100 sec bins |
 |
 |
| Module-wise count rates for Quadrant C Data is divided into 100 sec bins |
 |
 |
| Module-wise count rates for Quadrant D Data is divided into 100 sec bins |
 |
 |
| Parameter | Plot |
|---|---|
| CZT HV Monitor | 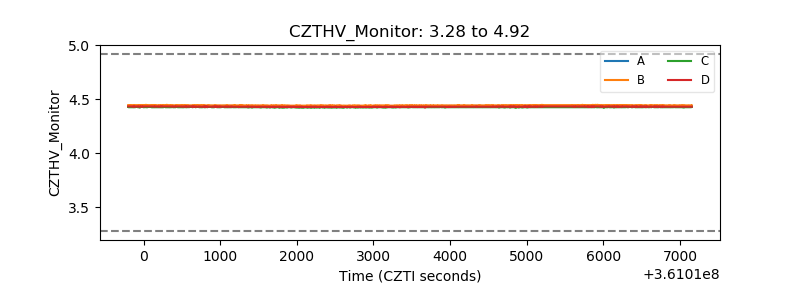 |
| D_VDD | 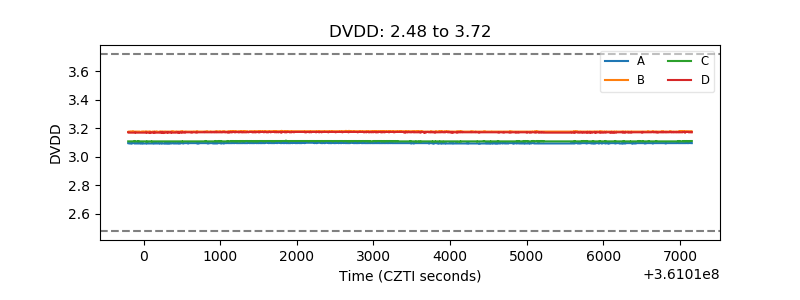 |
| Temperature 1 | 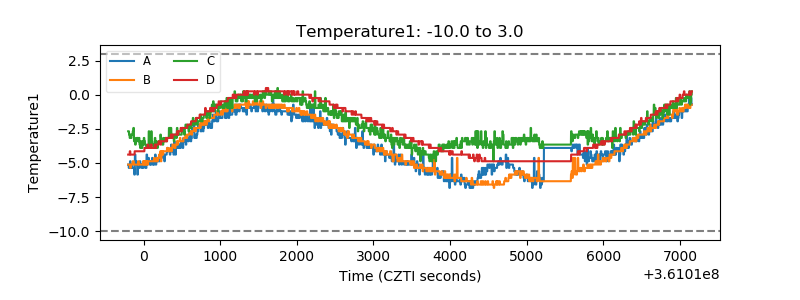 |
| Veto HV Monitor | 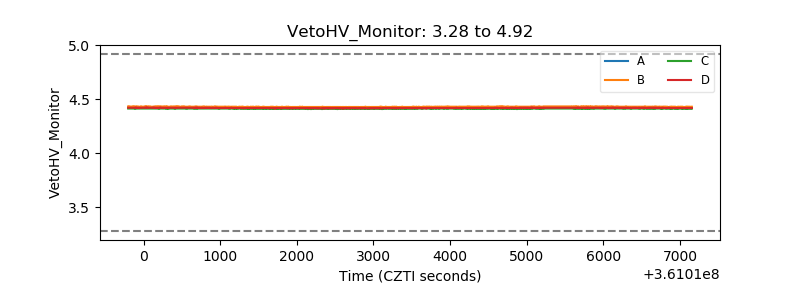 |
| Veto LLD | 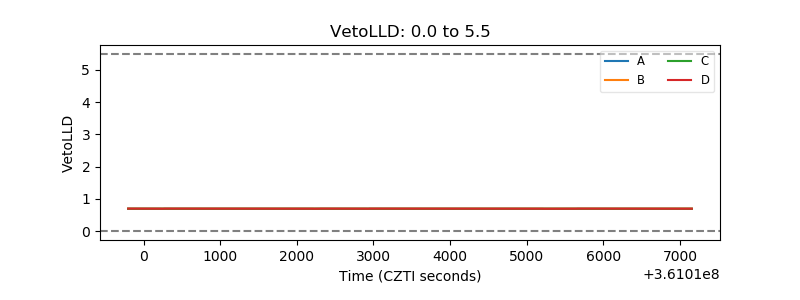 |
| Alpha Counter | 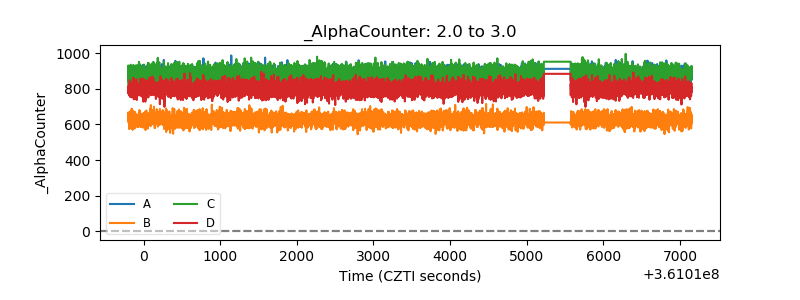 |
| _CPM_Rate | 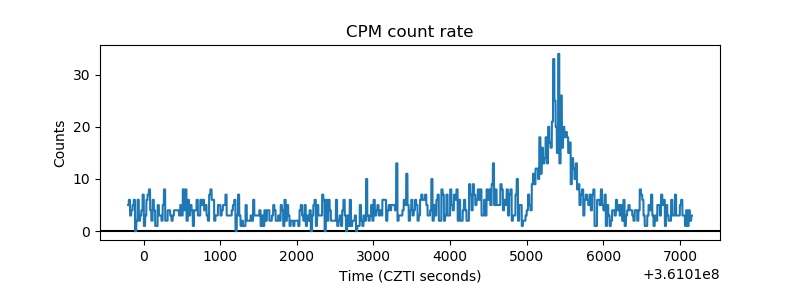 |
| CZT Counter | 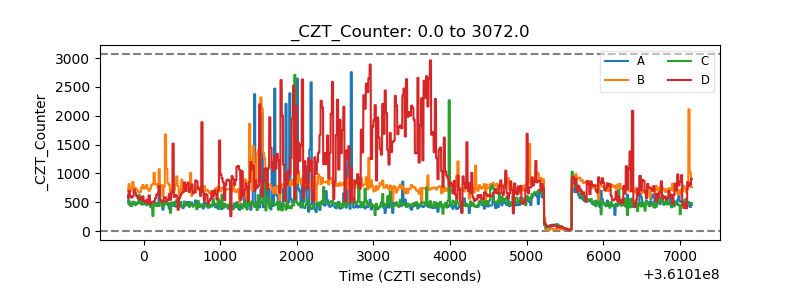 |
| +2.5 Volts monitor |  |
| +5 Volts monitor | 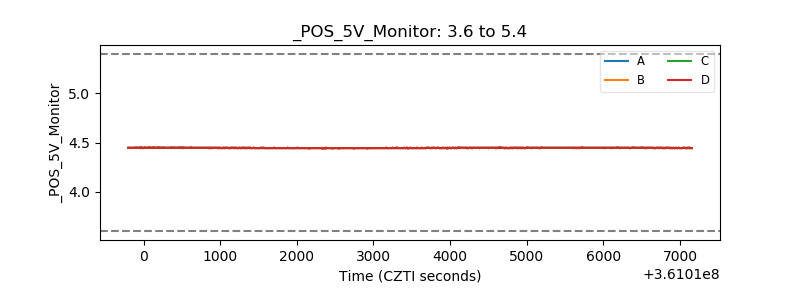 |
| _ROLL_ROT | 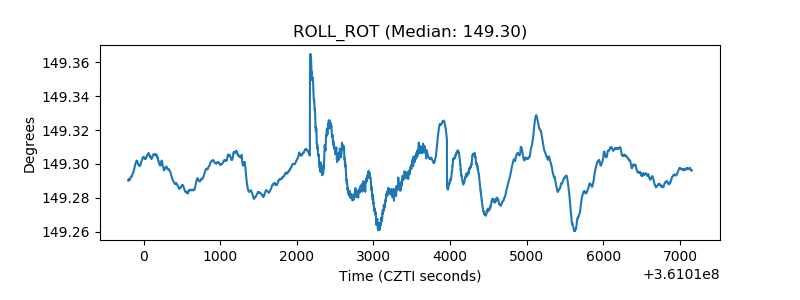 |
| _Roll_DEC |  |
| _Roll_RA | 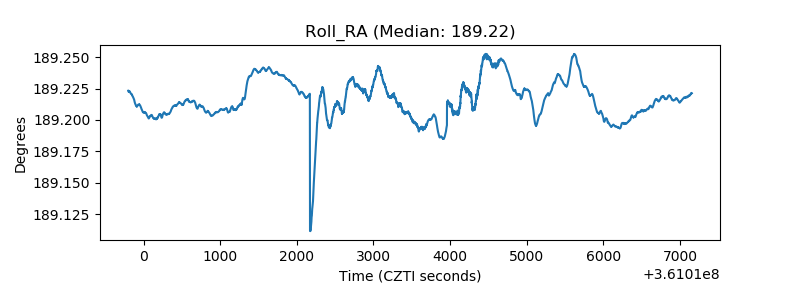 |
| Veto Counter | 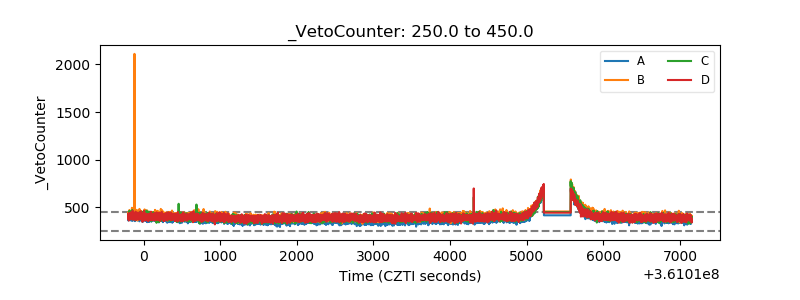 |