| Param | Original file | Final file |
|---|---|---|
| Filename | modeM0/AS1C06_003T01_9000004452_30822cztM0_level2.evt | modeM0/AS1C06_003T01_9000004452_30822cztM0_level2_quad_clean.evt |
| Size (bytes) | 281,923,200 | 57,260,160 |
| Size | 268.9 MB | 54.6 MB |
| Events in quadrant A | 1,479,012 | 395,364 |
| Events in quadrant B | 2,509,281 | 389,919 |
| Events in quadrant C | 1,482,673 | 374,585 |
| Events in quadrant D | 2,852,553 | 350,432 |
| Mode M0 | |||
|---|---|---|---|
| Quadrant | BADHDUFLAG | Total packets | Discarded packets |
| A | 0 | 6510 | 0 |
| B | 0 | 9767 | 0 |
| C | 0 | 6396 | 0 |
| D | 0 | 10686 | 0 |
| Mode SS | |||
|---|---|---|---|
| Quadrant | BADHDUFLAG | Total packets | Discarded packets |
| A | 0 | 64 | 0 |
| B | 0 | 64 | 0 |
| C | 0 | 64 | 0 |
| D | 0 | 64 | 0 |
| Quadrant | Total seconds | Saturated seconds | Saturation percentage |
|---|---|---|---|
| A | 3136 | 5 | 0.159439% |
| B | 3137 | 37 | 1.179471% |
| C | 3137 | 19 | 0.605674% |
| D | 3137 | 329 | 10.487727% |
Noise dominated data is calculated using 1-second bins in cleaned event files. If a bin has >2000 counts, and if more than 50% of those come from <1% of pixels, then it is considered to be noise-dominated and hence unusable.
| Quadrant | # 1 sec bins | Bins with >0 counts | Bins with >2000 counts | High rate bins dominated by noise | Noise dominated (total time) | Noise dominated (detector-on time) | Marked lightcurve |
|---|---|---|---|---|---|---|---|
| A | 3136 | 3136 | 3 | 3 | 0.10% | 0.10% | 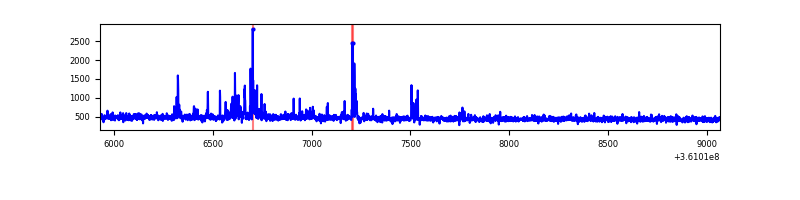 |
| B | 3137 | 3137 | 25 | 25 | 0.80% | 0.80% | 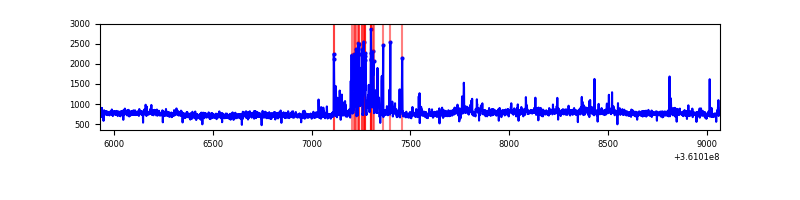 |
| C | 3137 | 3137 | 0 | 0 | 0.00% | 0.00% |  |
| D | 3137 | 3137 | 320 | 320 | 10.20% | 10.20% | 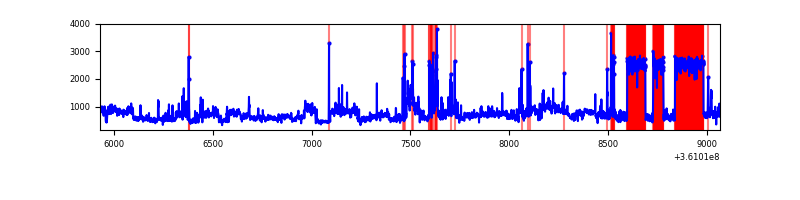 |
Top three noisy pixels from each quadrant. If the there are fewer than three noisy pixels in the level2.evt file, extra rows are filled as -1
| Pixel properties | Quadrant properties | ||||||
|---|---|---|---|---|---|---|---|
| Quadrant | DetID | PixID | Counts | Sigma | Mean | Median | Sigma |
| A | 0 | 13 | 80570 | 1086.45 | 362 | 354 | 73.8 |
| A | 13 | 254 | 5690 | 72.27 | 362 | 354 | 73.8 |
| A | 3 | 137 | 3436 | 41.74 | 362 | 354 | 73.8 |
| B | 6 | 159 | 932089 | 13712.83 | 353 | 344 | 67.9 |
| B | 5 | 172 | 109544 | 1607.14 | 353 | 344 | 67.9 |
| B | 0 | 229 | 21047 | 304.69 | 353 | 344 | 67.9 |
| C | 3 | 233 | 65818 | 814.43 | 340 | 342 | 80.4 |
| C | 14 | 238 | 55782 | 689.59 | 340 | 342 | 80.4 |
| C | 1 | 16 | 8570 | 102.34 | 340 | 342 | 80.4 |
| D | 8 | 195 | 1315971 | 16362.22 | 333 | 325 | 80.4 |
| D | 12 | 6 | 81961 | 1015.28 | 333 | 325 | 80.4 |
| D | 2 | 250 | 51343 | 634.49 | 333 | 325 | 80.4 |
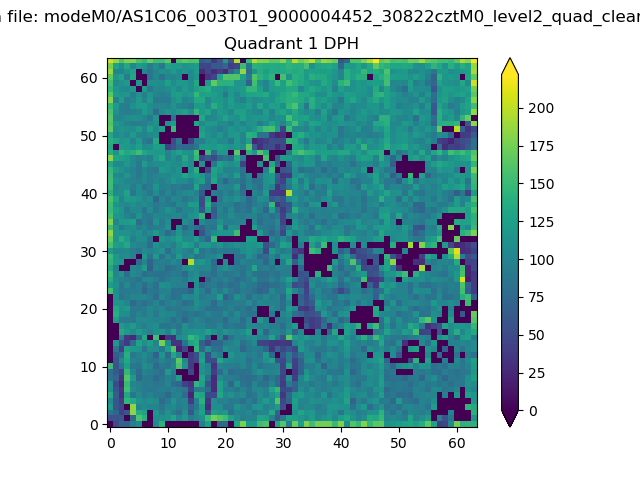
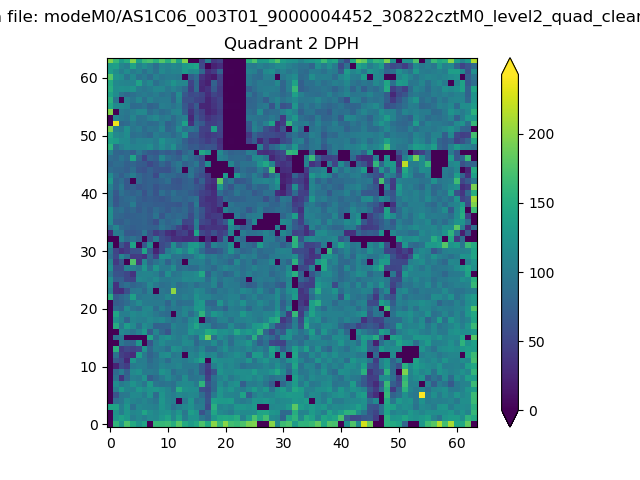
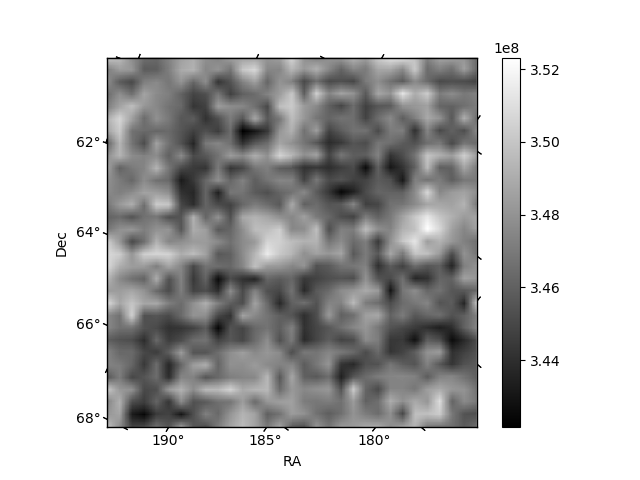
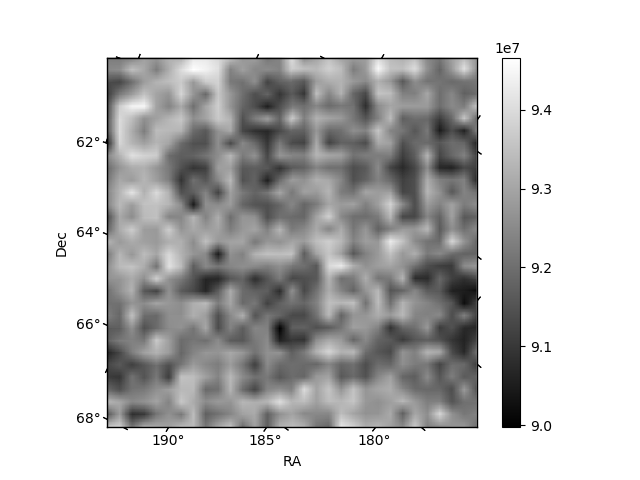
Histogram calculated using DETX and DETY for each event in the final _common_clean file
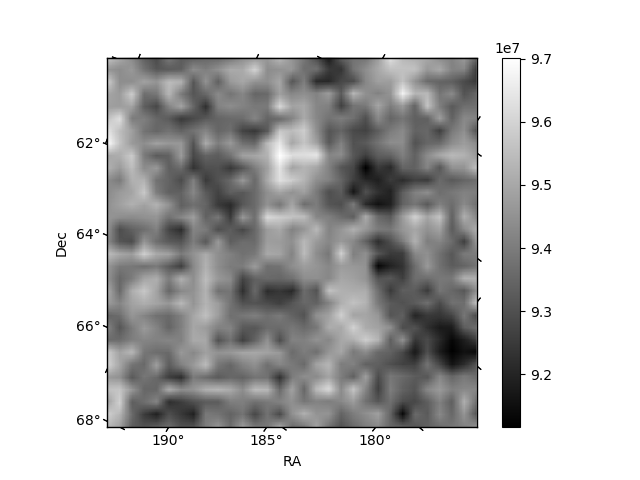
| Quadrant A | 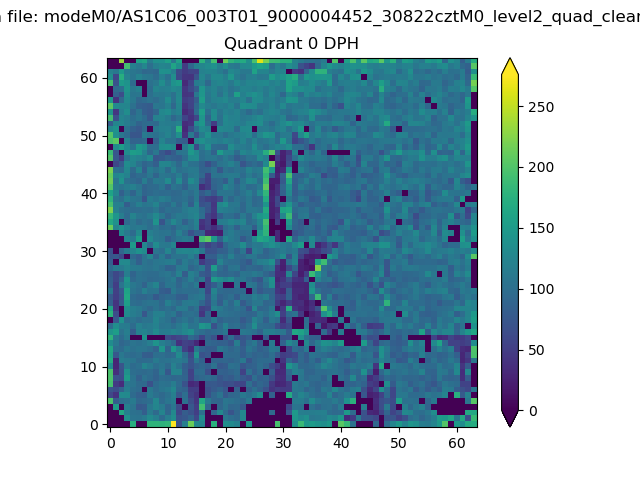 |
 |
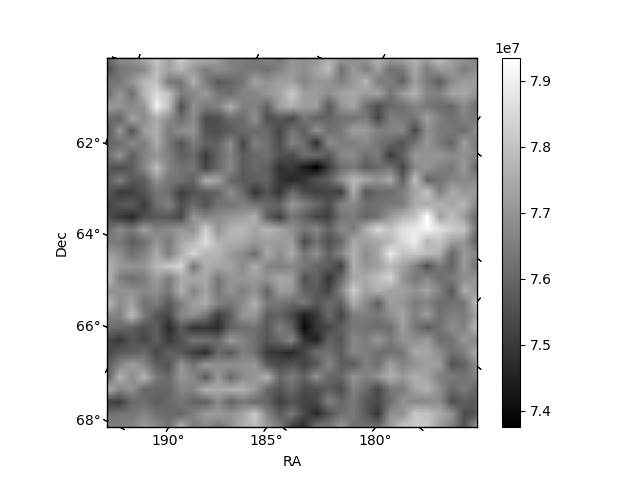
Quadrant B |
|---|---|---|---|
| Quadrant D | 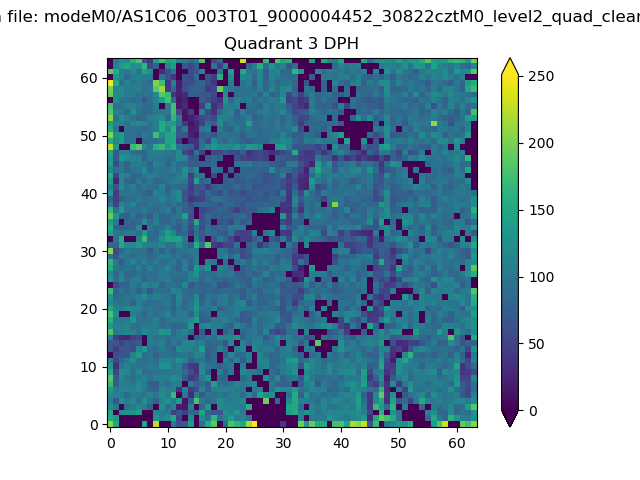 |
 |
Quadrant C |
| Plot type | Count rate plots | Images |
|---|---|---|
| Comparison with Poisson distribution Blue bars denote a histogram of data divided into 1 sec bins. Red curve is a Poisson curve with rate = median count rate of data. |
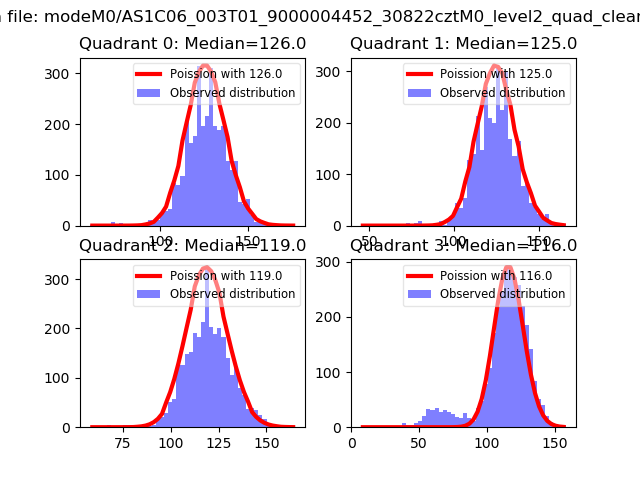 |
 |
| Quadrant-wise count rates Data is divided into 100 sec bins |
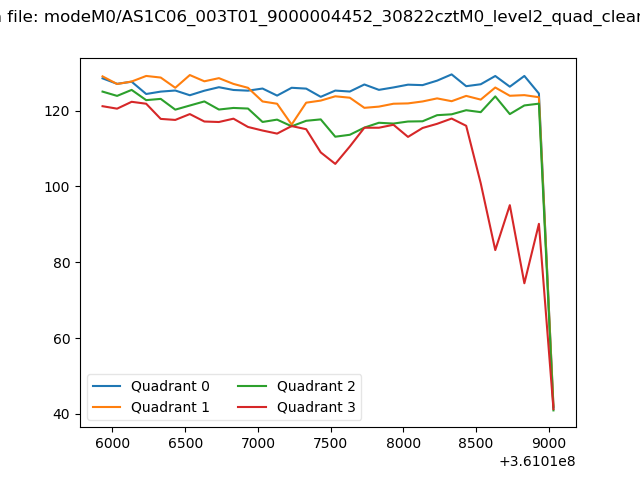 |
|
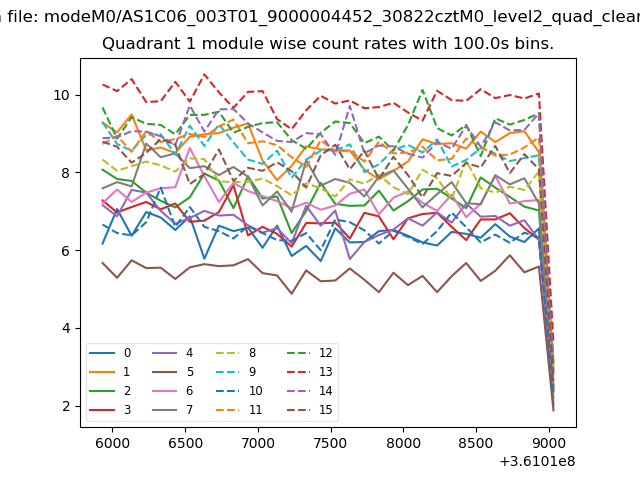
| Module-wise count rates for Quadrant A Data is divided into 100 sec bins |
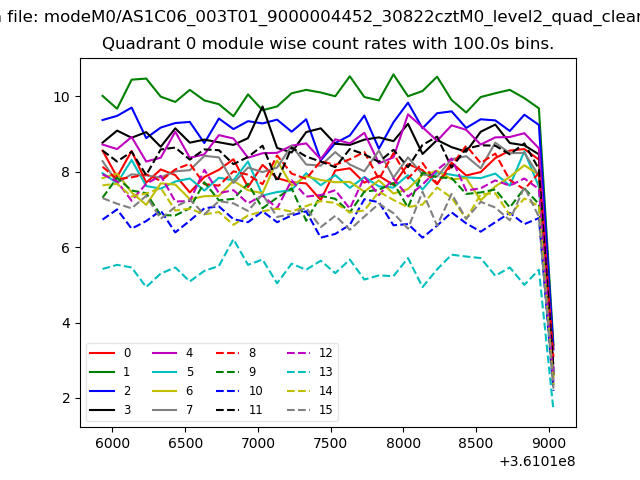 |
 |
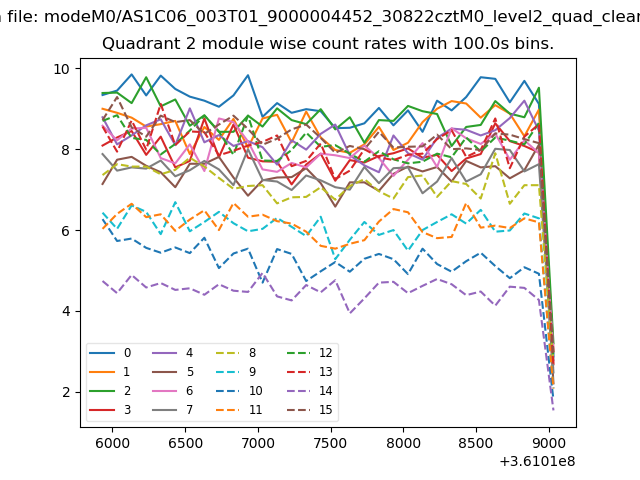
| Module-wise count rates for Quadrant B Data is divided into 100 sec bins |
 |
 |
| Module-wise count rates for Quadrant C Data is divided into 100 sec bins |
 |
 |
| Module-wise count rates for Quadrant D Data is divided into 100 sec bins |
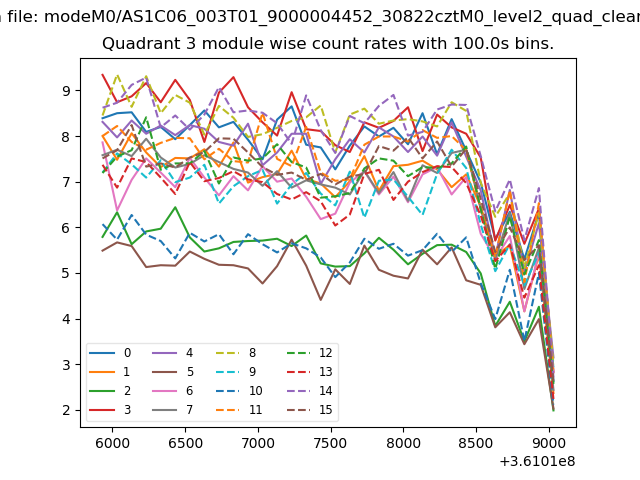 |
 |
| Parameter | Plot |
|---|---|
| CZT HV Monitor | 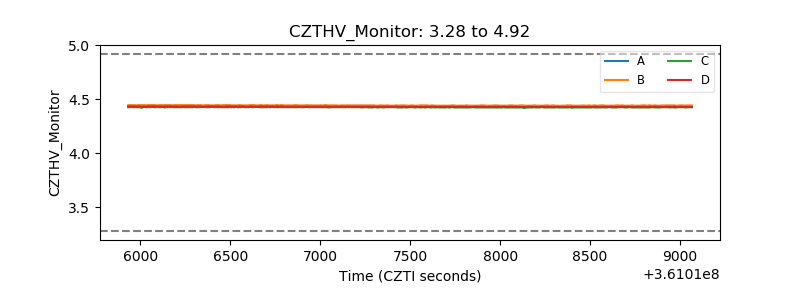 |
| D_VDD | 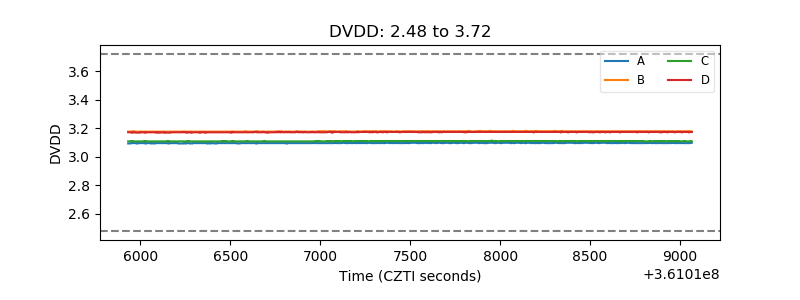 |
| Temperature 1 | 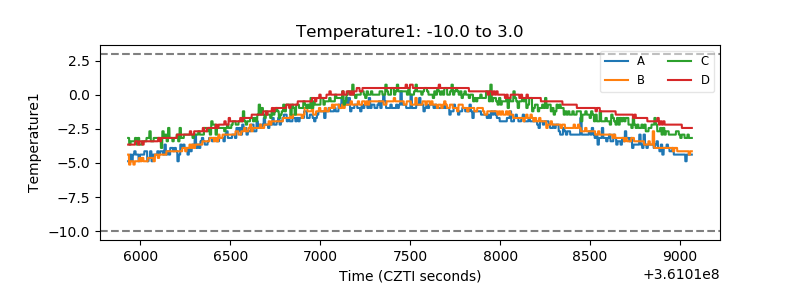 |
| Veto HV Monitor |  |
| Veto LLD | 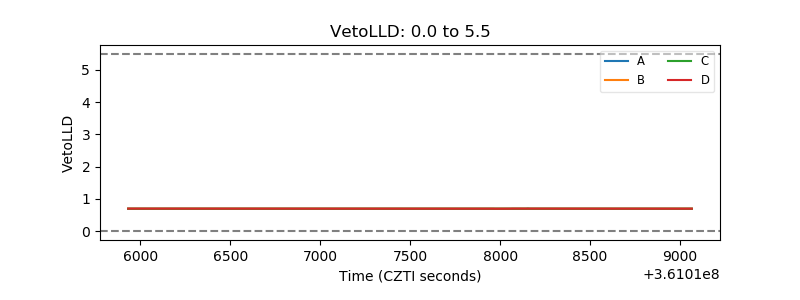 |
| Alpha Counter | 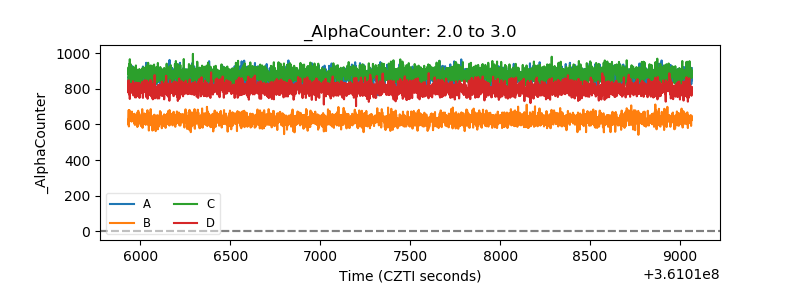 |
| _CPM_Rate | 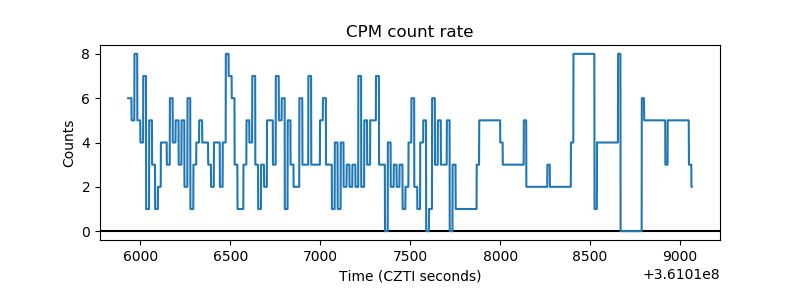 |
| CZT Counter | 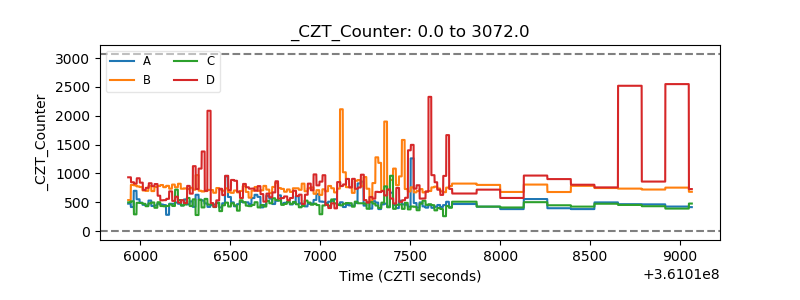 |
| +2.5 Volts monitor |  |
| +5 Volts monitor |  |
| _ROLL_ROT | 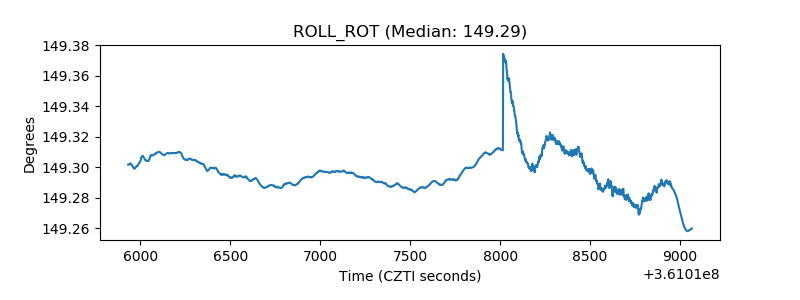 |
| _Roll_DEC | 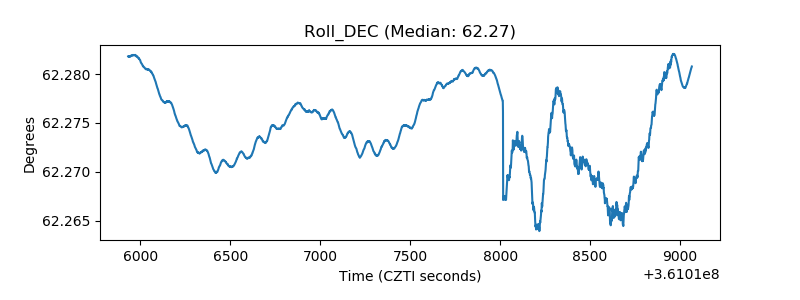 |
| _Roll_RA | 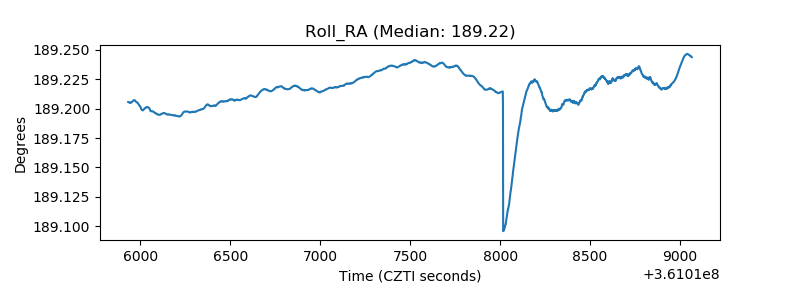 |
| Veto Counter |  |