| Param | Original file | Final file |
|---|---|---|
| Filename | modeM0/AS1A10_071T38_9000004454cztM0_level2.fits | modeM0/AS1A10_071T38_9000004454cztM0_level2_quad_clean.evt |
| Size (bytes) | 695,831,040 | 522,696,960 |
| Size | 663.6 MB | 498.5 MB |
| Events in quadrant A | 4,445,982 | 3,011,149 |
| Events in quadrant B | 4,122,608 | 2,929,370 |
| Events in quadrant C | 4,153,886 | 2,754,672 |
| Events in quadrant D | 3,573,358 | 2,357,922 |
| Mode M9 | |||
|---|---|---|---|
| Quadrant | BADHDUFLAG | Total packets | Discarded packets |
| A | 0 | 115 | 0 |
| B | 0 | 115 | 0 |
| C | 0 | 115 | 0 |
| D | 0 | 115 | 0 |
| Mode M0 | |||
|---|---|---|---|
| Quadrant | BADHDUFLAG | Total packets | Discarded packets |
| A | 0 | 145836 | 0 |
| B | 0 | 220076 | 0 |
| C | 0 | 158160 | 0 |
| D | 0 | 236850 | 0 |
| Mode SS | |||
|---|---|---|---|
| Quadrant | BADHDUFLAG | Total packets | Discarded packets |
| A | 0 | 1416 | 0 |
| B | 0 | 1416 | 0 |
| C | 0 | 1416 | 0 |
| D | 0 | 1416 | 0 |
| Quadrant | Total seconds | Saturated seconds | Saturation percentage |
|---|---|---|---|
| A | 69629 | 975 | 1.400279% |
| B | 69629 | 2416 | 3.469819% |
| C | 69629 | 3161 | 4.539775% |
| D | 69629 | 5929 | 8.515130% |
Noise dominated data is calculated using 1-second bins in cleaned event files. If a bin has >2000 counts, and if more than 50% of those come from <1% of pixels, then it is considered to be noise-dominated and hence unusable.
| Quadrant | # 1 sec bins | Bins with >0 counts | Bins with >2000 counts | High rate bins dominated by noise | Noise dominated (total time) | Noise dominated (detector-on time) | Marked lightcurve |
|---|---|---|---|---|---|---|---|
| A | 80935 | 69615 | 0 | 0 | 0.00% | 0.00% |  |
| B | 80935 | 69608 | 0 | 0 | 0.00% | 0.00% |  |
| C | 80935 | 69593 | 0 | 0 | 0.00% | 0.00% |  |
| D | 80935 | 69560 | 0 | 0 | 0.00% | 0.00% |  |
Top three noisy pixels from each quadrant. If the there are fewer than three noisy pixels in the level2.evt file, extra rows are filled as -1
| Pixel properties | Quadrant properties | ||||||
|---|---|---|---|---|---|---|---|
| Quadrant | DetID | PixID | Counts | Sigma | Mean | Median | Sigma |
| A | 0 | 29 | 3723 | 9.44 | 1157 | 1087 | 279.3 |
| A | 7 | 110 | 3529 | 8.74 | 1157 | 1087 | 279.3 |
| A | 0 | 30 | 3231 | 7.68 | 1157 | 1087 | 279.3 |
| B | 2 | 9 | 3230 | 10.14 | 1093 | 1045 | 215.5 |
| B | 3 | 80 | 2762 | 7.97 | 1093 | 1045 | 215.5 |
| B | 3 | 17 | 2760 | 7.96 | 1093 | 1045 | 215.5 |
| C | 12 | 241 | 2891 | 6.66 | 1100 | 1030 | 279.3 |
| C | 3 | 187 | 2812 | 6.38 | 1100 | 1030 | 279.3 |
| C | 9 | 209 | 2797 | 6.33 | 1100 | 1030 | 279.3 |
| D | 15 | 47 | 2607 | 6.18 | 1021 | 931 | 271.3 |
| D | 7 | 3 | 2520 | 5.86 | 1021 | 931 | 271.3 |
| D | 10 | 189 | 2515 | 5.84 | 1021 | 931 | 271.3 |
Histogram calculated using DETX and DETY for each event in the final _common_clean file
| Quadrant A |  |
 |
Quadrant B |
|---|---|---|---|
| Quadrant D | 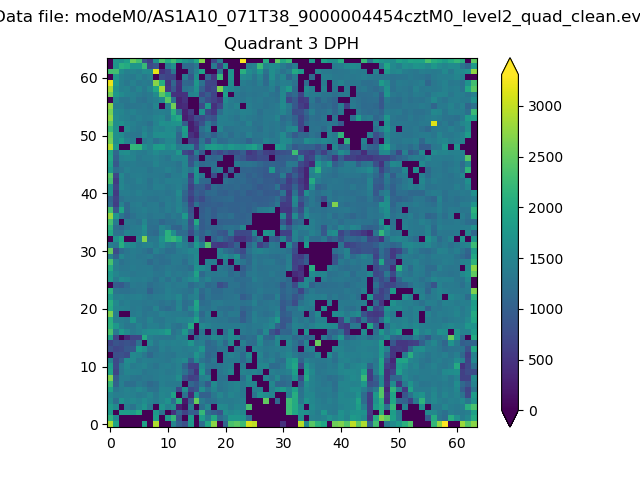 |
 |
Quadrant C |
| Plot type | Count rate plots | Images |
|---|---|---|
| Comparison with Poisson distribution Blue bars denote a histogram of data divided into 1 sec bins. Red curve is a Poisson curve with rate = median count rate of data. |
 |
 |
| Quadrant-wise count rates Data is divided into 100 sec bins |
 |
|
| Module-wise count rates for Quadrant A Data is divided into 100 sec bins |
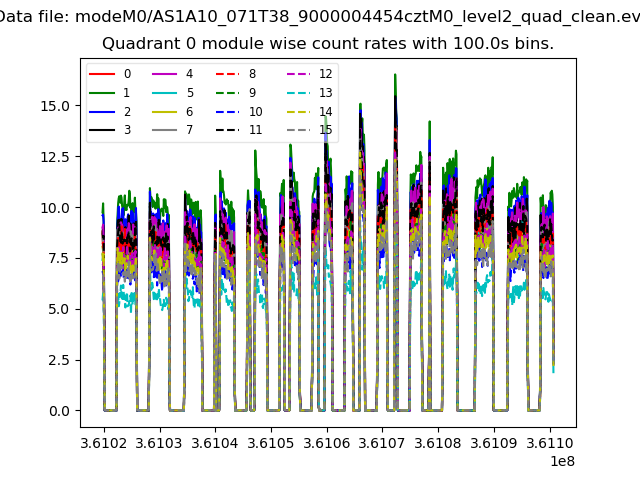 |
 |
| Module-wise count rates for Quadrant B Data is divided into 100 sec bins |
 |
 |
| Module-wise count rates for Quadrant C Data is divided into 100 sec bins |
 |
 |
| Module-wise count rates for Quadrant D Data is divided into 100 sec bins |
 |
 |
| Parameter | Plot |
|---|---|
| CZT HV Monitor |  |
| D_VDD | 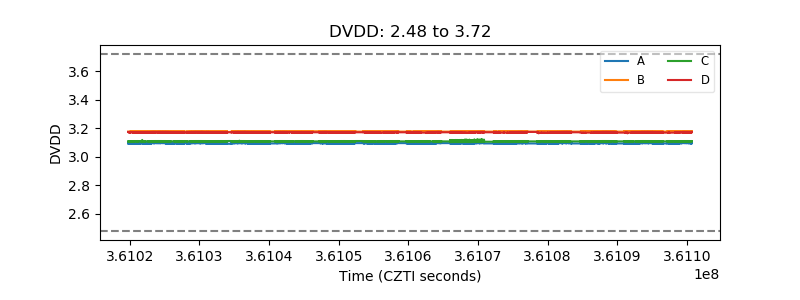 |
| Temperature 1 |  |
| Veto HV Monitor |  |
| Veto LLD | 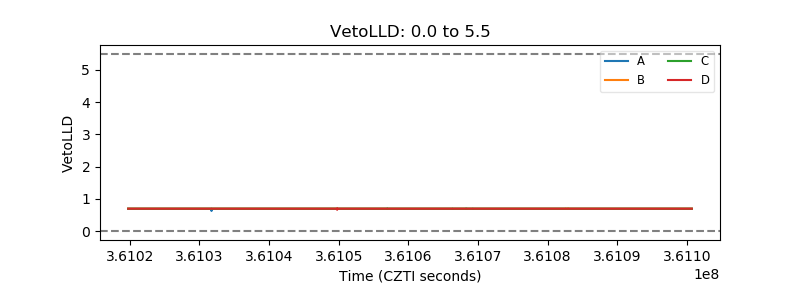 |
| Alpha Counter |  |
| _CPM_Rate |  |
| CZT Counter |  |
| +2.5 Volts monitor |  |
| +5 Volts monitor |  |
| _ROLL_ROT | 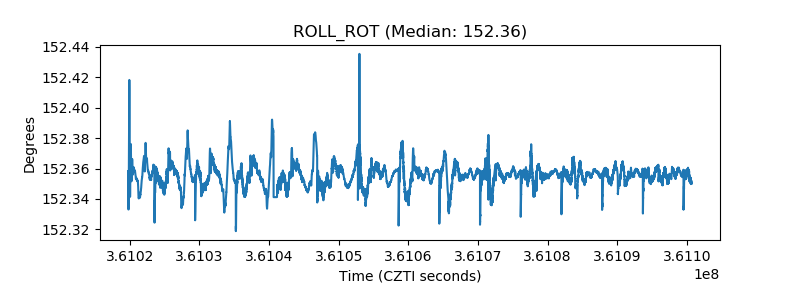 |
| _Roll_DEC | 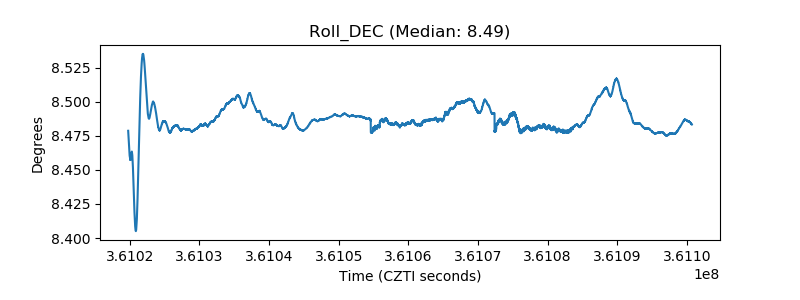 |
| _Roll_RA |  |
| Veto Counter |  |