| Param | Original file | Final file |
|---|---|---|
| Filename | modeM0/AS1A10_071T38_9000004454_30822cztM0_level2.evt | modeM0/AS1A10_071T38_9000004454_30822cztM0_level2_quad_clean.evt |
| Size (bytes) | 373,412,160 | 33,287,040 |
| Size | 356.1 MB | 31.7 MB |
| Events in quadrant A | 2,136,846 | 194,328 |
| Events in quadrant B | 3,220,638 | 195,032 |
| Events in quadrant C | 2,063,126 | 186,916 |
| Events in quadrant D | 3,638,067 | 171,310 |
| Mode M9 | |||
|---|---|---|---|
| Quadrant | BADHDUFLAG | Total packets | Discarded packets |
| A | 0 | 2 | 0 |
| B | 0 | 2 | 0 |
| C | 0 | 2 | 0 |
| D | 0 | 2 | 0 |
| Mode M0 | |||
|---|---|---|---|
| Quadrant | BADHDUFLAG | Total packets | Discarded packets |
| A | 0 | 8540 | 1 |
| B | 0 | 12121 | 1 |
| C | 0 | 8273 | 1 |
| D | 0 | 13341 | 1 |
| Mode SS | |||
|---|---|---|---|
| Quadrant | BADHDUFLAG | Total packets | Discarded packets |
| A | 0 | 76 | 0 |
| B | 0 | 76 | 0 |
| C | 0 | 76 | 0 |
| D | 0 | 76 | 0 |
| Quadrant | Total seconds | Saturated seconds | Saturation percentage |
|---|---|---|---|
| A | 3676 | 262 | 7.127312% |
| B | 3676 | 387 | 10.527748% |
| C | 3676 | 258 | 7.018498% |
| D | 3676 | 721 | 19.613711% |
Noise dominated data is calculated using 1-second bins in cleaned event files. If a bin has >2000 counts, and if more than 50% of those come from <1% of pixels, then it is considered to be noise-dominated and hence unusable.
| Quadrant | # 1 sec bins | Bins with >0 counts | Bins with >2000 counts | High rate bins dominated by noise | Noise dominated (total time) | Noise dominated (detector-on time) | Marked lightcurve |
|---|---|---|---|---|---|---|---|
| A | 3782 | 3676 | 33 | 33 | 0.87% | 0.90% | 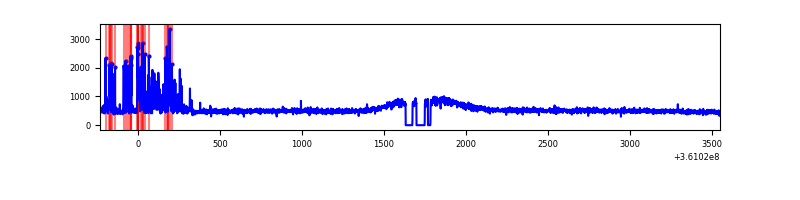 |
| B | 3782 | 3676 | 10 | 10 | 0.26% | 0.27% | 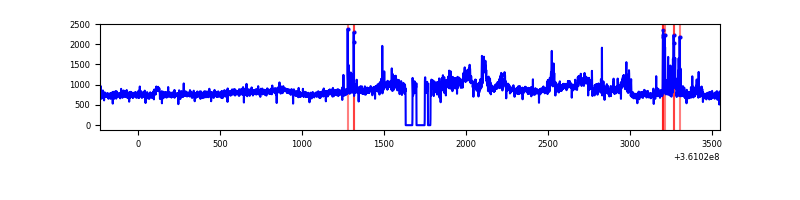 |
| C | 3782 | 3676 | 0 | 0 | 0.00% | 0.00% | 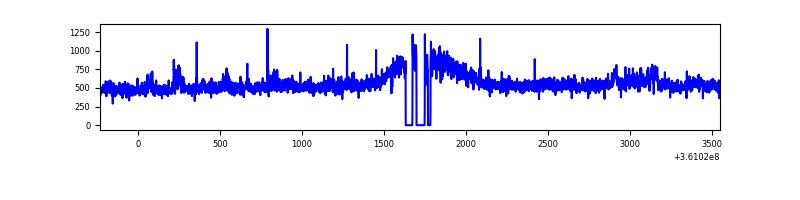 |
| D | 3782 | 3677 | 508 | 508 | 13.43% | 13.82% | 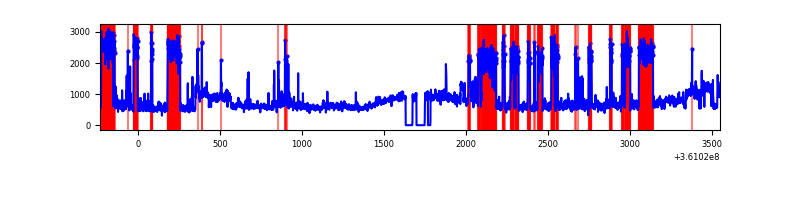 |
Top three noisy pixels from each quadrant. If the there are fewer than three noisy pixels in the level2.evt file, extra rows are filled as -1
| Pixel properties | Quadrant properties | ||||||
|---|---|---|---|---|---|---|---|
| Quadrant | DetID | PixID | Counts | Sigma | Mean | Median | Sigma |
| A | 0 | 13 | 227745 | 2223.28 | 494 | 482 | 102.2 |
| A | 13 | 254 | 6175 | 55.69 | 494 | 482 | 102.2 |
| A | 3 | 137 | 5267 | 46.81 | 494 | 482 | 102.2 |
| B | 6 | 159 | 1041002 | 10895.37 | 483 | 470 | 95.5 |
| B | 5 | 255 | 170760 | 1783.1 | 483 | 470 | 95.5 |
| B | 15 | 33 | 53010 | 550.14 | 483 | 470 | 95.5 |
| C | 3 | 233 | 128628 | 1127.35 | 472 | 475 | 113.7 |
| C | 14 | 238 | 74835 | 654.14 | 472 | 475 | 113.7 |
| C | 2 | 114 | 8738 | 72.69 | 472 | 475 | 113.7 |
| D | 8 | 195 | 1621681 | 14465.04 | 465 | 452 | 112.1 |
| D | 2 | 250 | 112243 | 997.43 | 465 | 452 | 112.1 |
| D | 13 | 174 | 94197 | 836.42 | 465 | 452 | 112.1 |
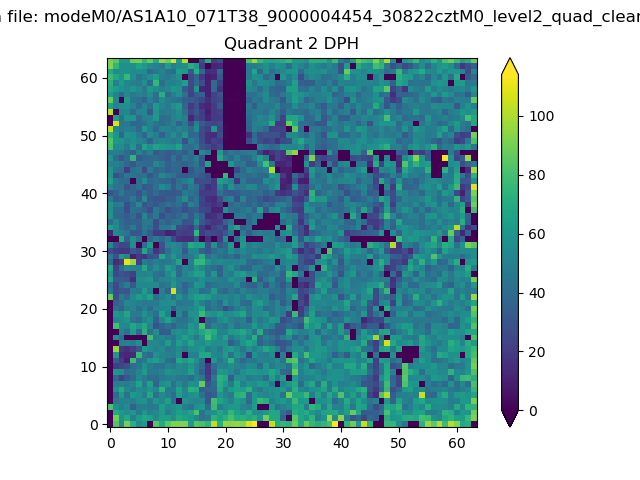
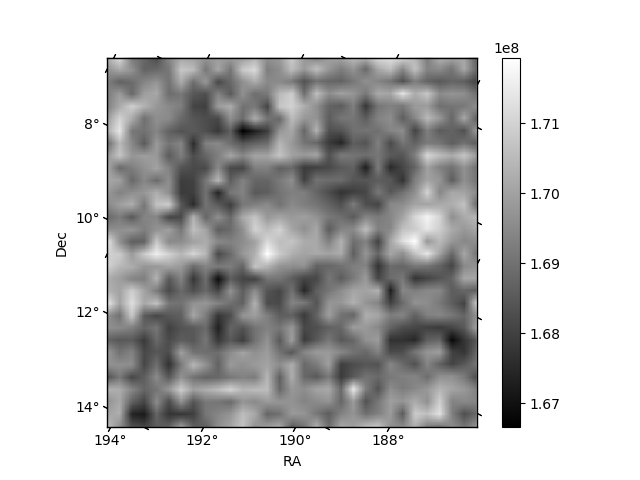
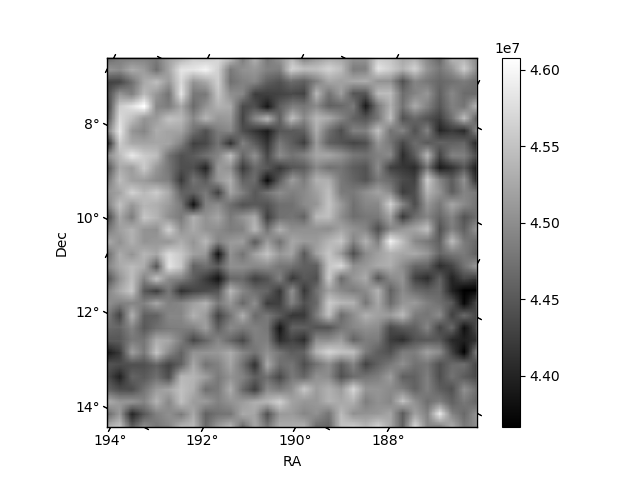
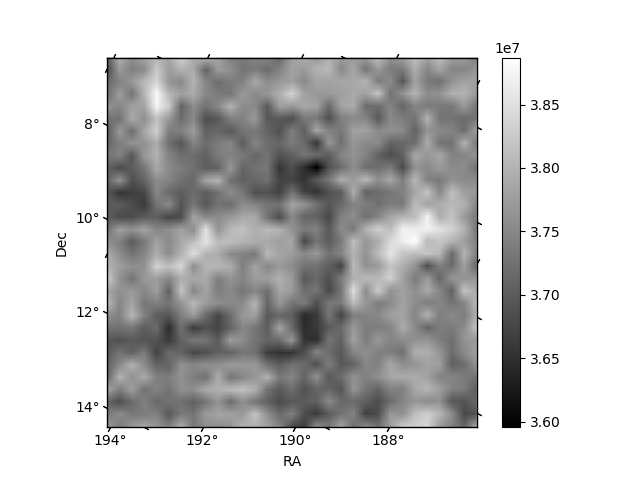
Histogram calculated using DETX and DETY for each event in the final _common_clean file
| Quadrant A | 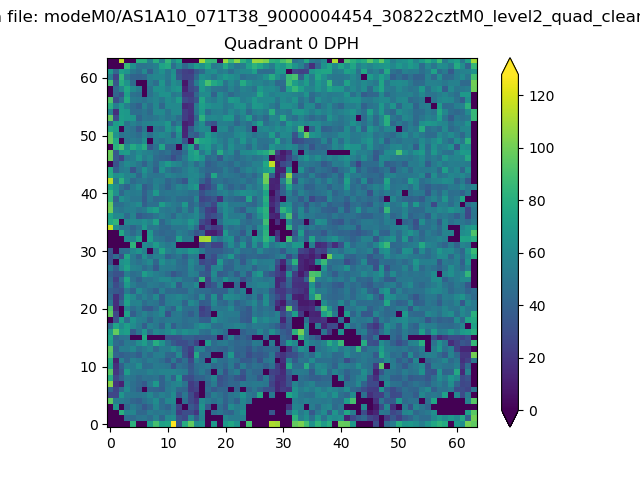 |
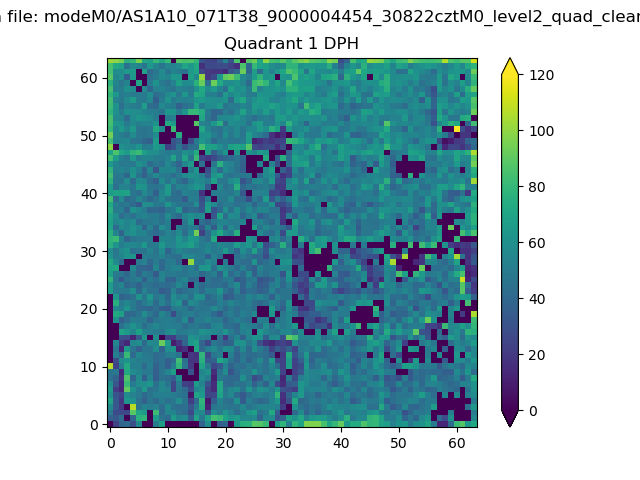 |
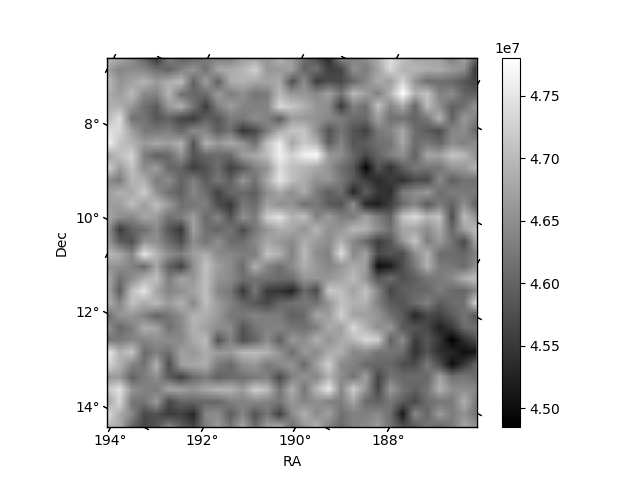
Quadrant B |
|---|---|---|---|
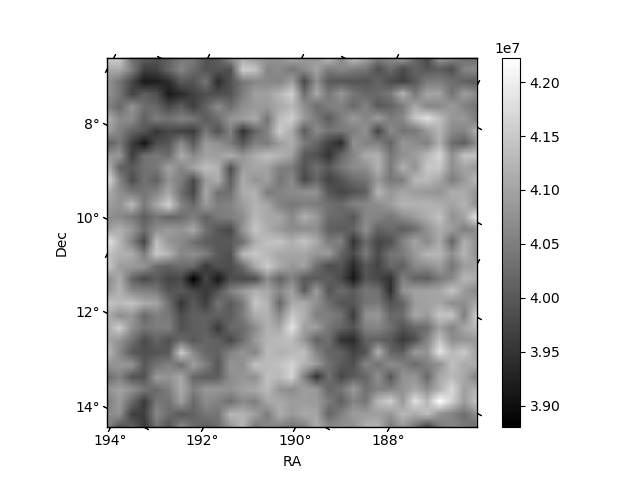
| Quadrant D | 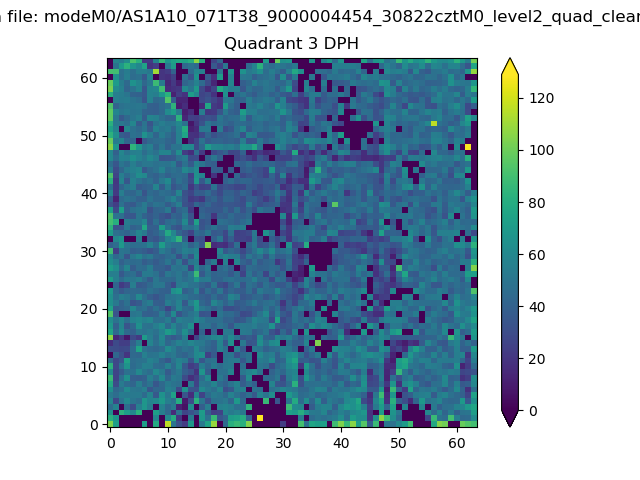 |
 |
Quadrant C |
| Plot type | Count rate plots | Images |
|---|---|---|
| Comparison with Poisson distribution Blue bars denote a histogram of data divided into 1 sec bins. Red curve is a Poisson curve with rate = median count rate of data. |
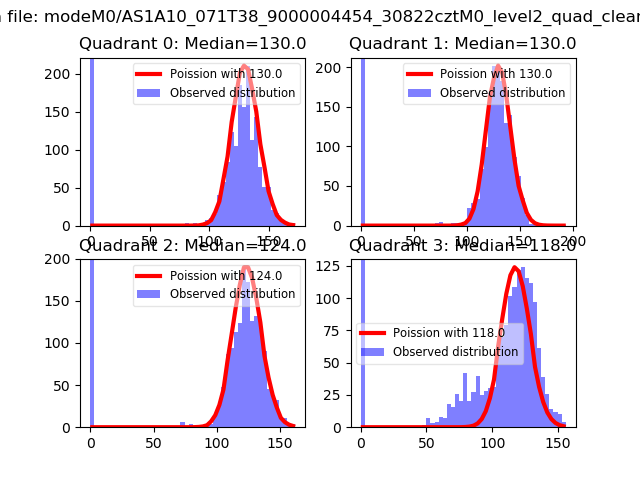 |
 |
| Quadrant-wise count rates Data is divided into 100 sec bins |
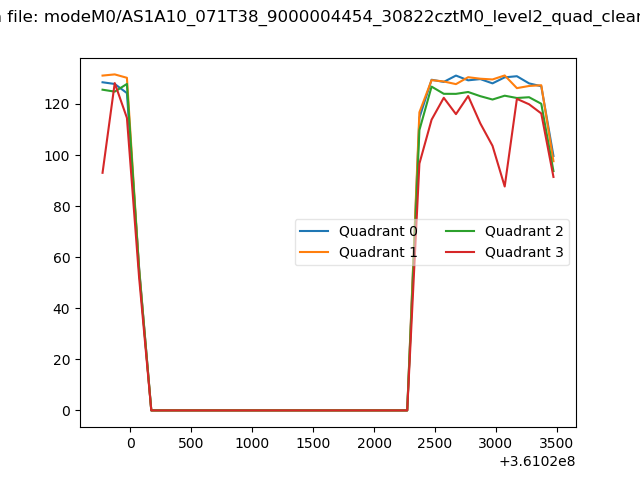 |
|
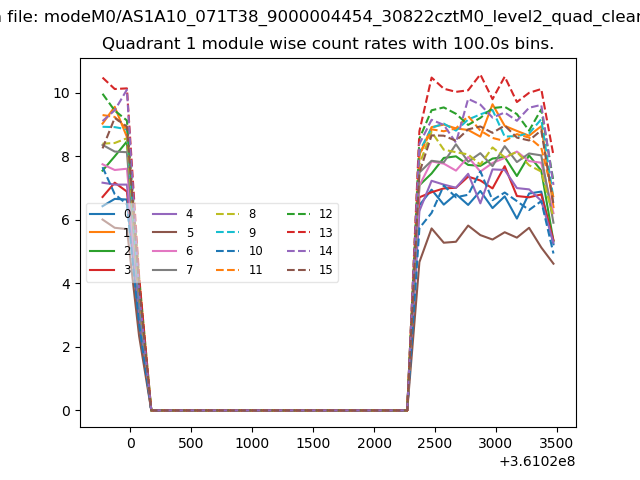
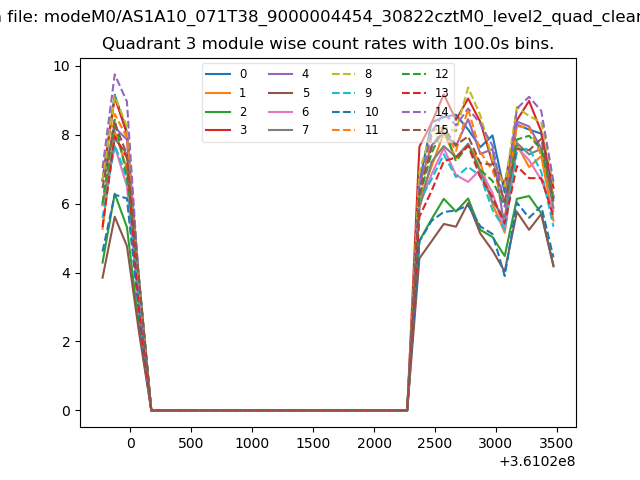
| Module-wise count rates for Quadrant A Data is divided into 100 sec bins |
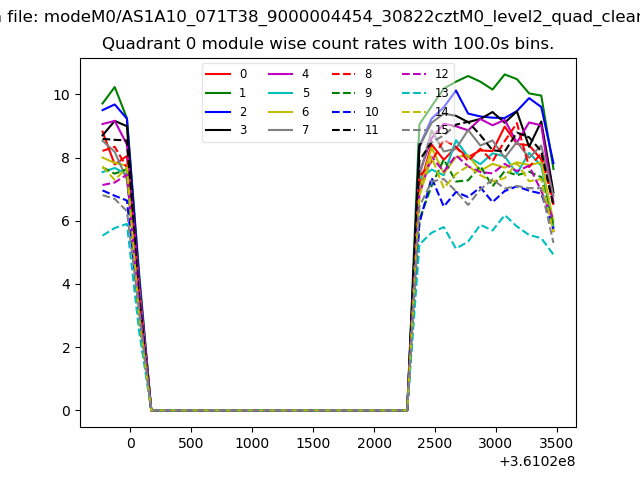 |
 |
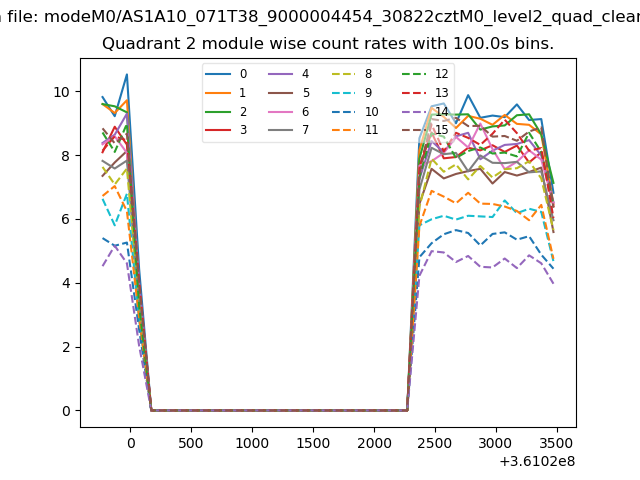
| Module-wise count rates for Quadrant B Data is divided into 100 sec bins |
 |
 |
| Module-wise count rates for Quadrant C Data is divided into 100 sec bins |
 |
 |
| Module-wise count rates for Quadrant D Data is divided into 100 sec bins |
 |
 |
| Parameter | Plot |
|---|---|
| CZT HV Monitor | 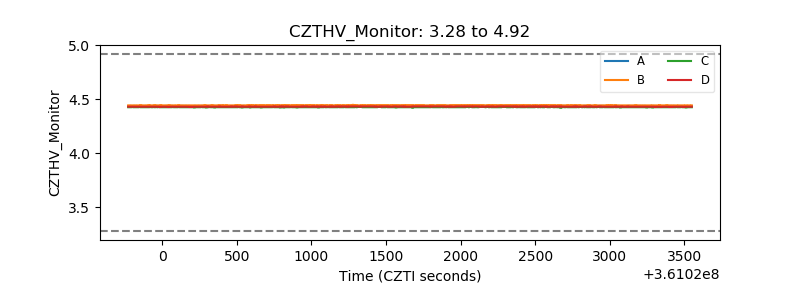 |
| D_VDD | 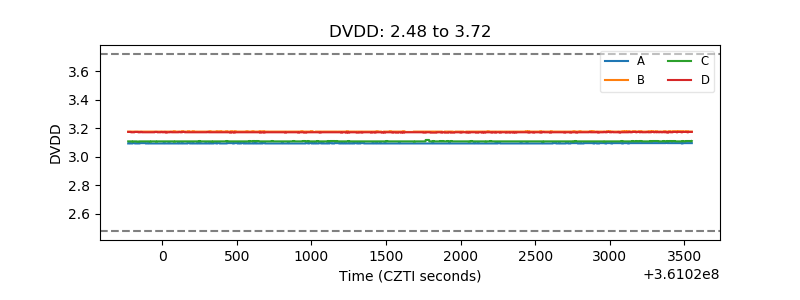 |
| Temperature 1 | 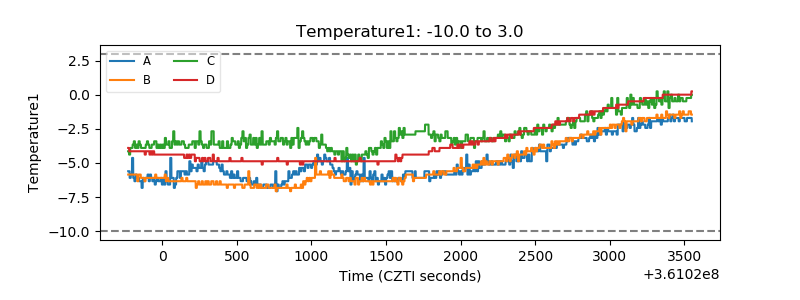 |
| Veto HV Monitor | 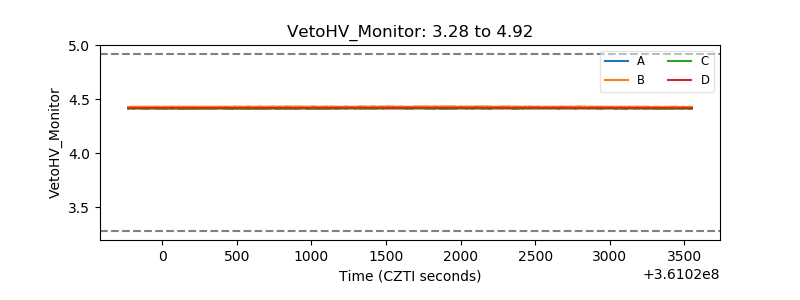 |
| Veto LLD | 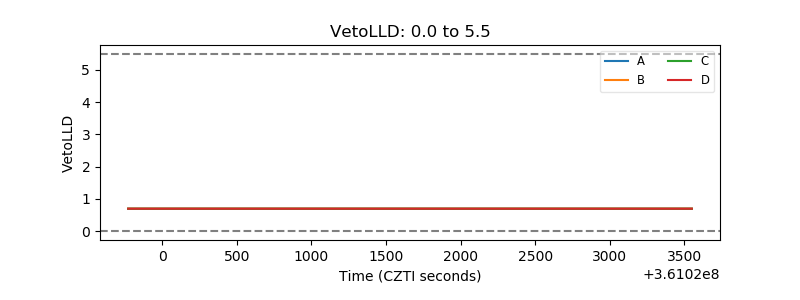 |
| Alpha Counter | 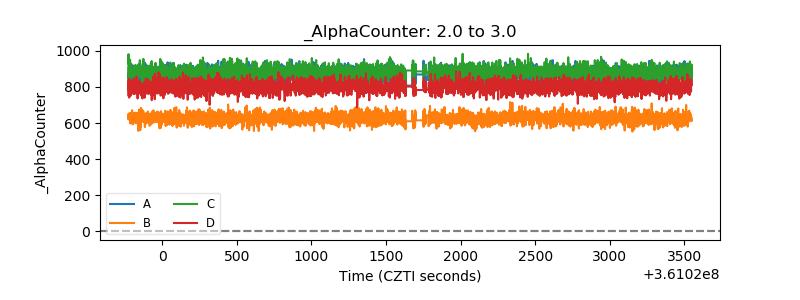 |
| _CPM_Rate | 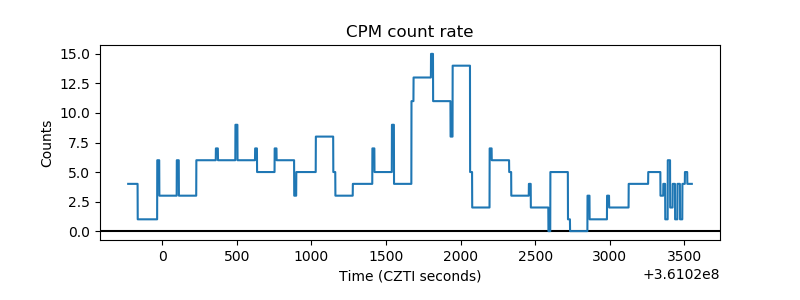 |
| CZT Counter | 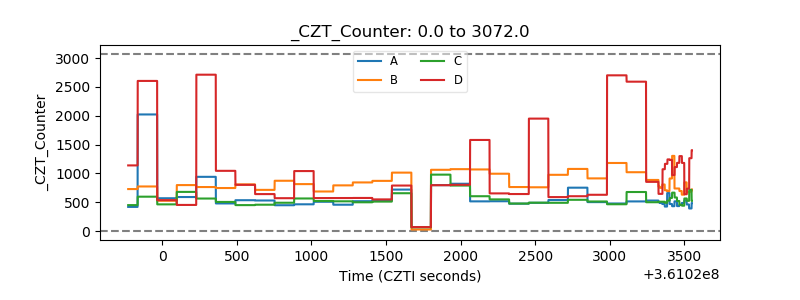 |
| +2.5 Volts monitor |  |
| +5 Volts monitor |  |
| _ROLL_ROT | 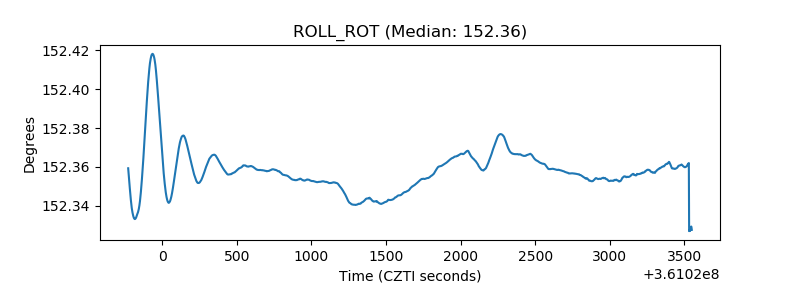 |
| _Roll_DEC | 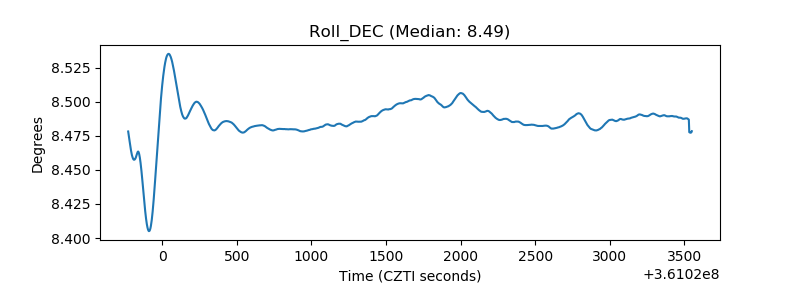 |
| _Roll_RA | 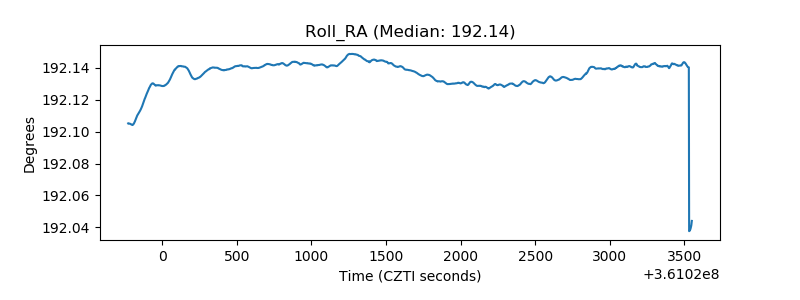 |
| Veto Counter | 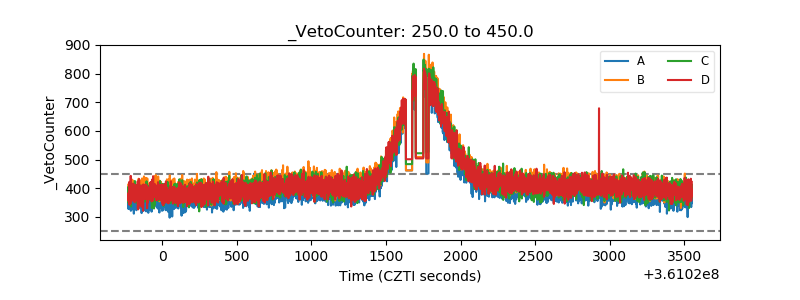 |