| Param | Original file | Final file |
|---|---|---|
| Filename | modeM0/AS1A10_071T38_9000004454_30827cztM0_level2.evt | modeM0/AS1A10_071T38_9000004454_30827cztM0_level2_quad_clean.evt |
| Size (bytes) | 652,553,280 | 90,889,920 |
| Size | 622.3 MB | 86.7 MB |
| Events in quadrant A | 3,146,271 | 604,774 |
| Events in quadrant B | 5,238,617 | 601,161 |
| Events in quadrant C | 3,974,320 | 564,340 |
| Events in quadrant D | 6,954,717 | 518,892 |
| Mode M9 | |||
|---|---|---|---|
| Quadrant | BADHDUFLAG | Total packets | Discarded packets |
| A | 0 | 12 | 0 |
| B | 0 | 13 | 0 |
| C | 0 | 13 | 0 |
| D | 0 | 13 | 0 |
| Mode M0 | |||
|---|---|---|---|
| Quadrant | BADHDUFLAG | Total packets | Discarded packets |
| A | 0 | 13651 | 2 |
| B | 0 | 20339 | 2 |
| C | 0 | 16241 | 2 |
| D | 0 | 25460 | 2 |
| Mode SS | |||
|---|---|---|---|
| Quadrant | BADHDUFLAG | Total packets | Discarded packets |
| A | 0 | 134 | 0 |
| B | 0 | 134 | 0 |
| C | 0 | 134 | 0 |
| D | 0 | 134 | 0 |
| Quadrant | Total seconds | Saturated seconds | Saturation percentage |
|---|---|---|---|
| A | 6642 | 32 | 0.481783% |
| B | 6642 | 87 | 1.309846% |
| C | 6642 | 471 | 7.091238% |
| D | 6642 | 673 | 10.132490% |
Noise dominated data is calculated using 1-second bins in cleaned event files. If a bin has >2000 counts, and if more than 50% of those come from <1% of pixels, then it is considered to be noise-dominated and hence unusable.
| Quadrant | # 1 sec bins | Bins with >0 counts | Bins with >2000 counts | High rate bins dominated by noise | Noise dominated (total time) | Noise dominated (detector-on time) | Marked lightcurve |
|---|---|---|---|---|---|---|---|
| A | 7662 | 6642 | 0 | 0 | 0.00% | 0.00% | 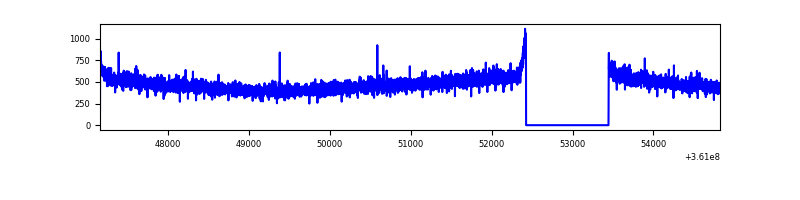 |
| B | 7662 | 6642 | 15 | 15 | 0.20% | 0.23% | 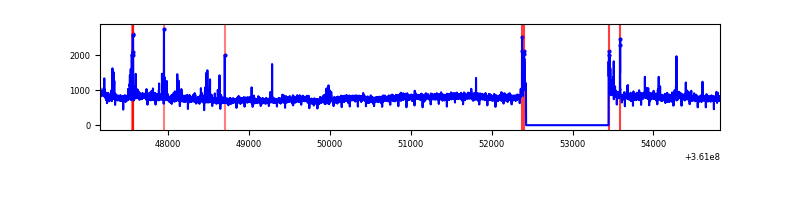 |
| C | 7662 | 6642 | 42 | 42 | 0.55% | 0.63% | 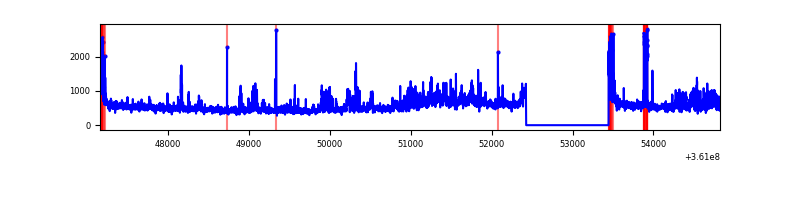 |
| D | 7661 | 6641 | 660 | 660 | 8.62% | 9.94% | 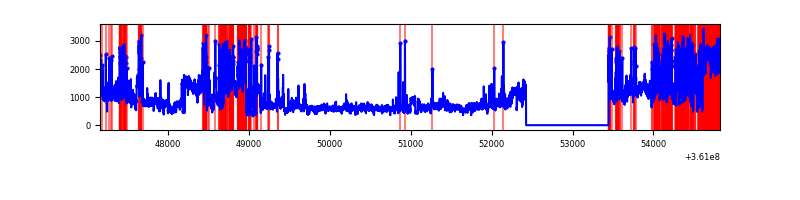 |
Top three noisy pixels from each quadrant. If the there are fewer than three noisy pixels in the level2.evt file, extra rows are filled as -1
| Pixel properties | Quadrant properties | ||||||
|---|---|---|---|---|---|---|---|
| Quadrant | DetID | PixID | Counts | Sigma | Mean | Median | Sigma |
| A | 13 | 254 | 12146 | 68.97 | 815 | 800 | 164.5 |
| A | 3 | 137 | 8362 | 45.97 | 815 | 800 | 164.5 |
| A | 0 | 226 | 6922 | 37.22 | 815 | 800 | 164.5 |
| B | 6 | 159 | 1885713 | 12232.35 | 808 | 788 | 154.1 |
| B | 5 | 172 | 59099 | 378.41 | 808 | 788 | 154.1 |
| B | 5 | 255 | 41741 | 265.77 | 808 | 788 | 154.1 |
| C | 3 | 233 | 363256 | 2021.78 | 763 | 771 | 179.3 |
| C | 14 | 238 | 235906 | 1311.48 | 763 | 771 | 179.3 |
| C | 0 | 10 | 190755 | 1059.65 | 763 | 771 | 179.3 |
| D | 8 | 195 | 2229523 | 12444.95 | 752 | 733 | 179.1 |
| D | 12 | 218 | 1225636 | 6839.52 | 752 | 733 | 179.1 |
| D | 12 | 2 | 305252 | 1700.35 | 752 | 733 | 179.1 |
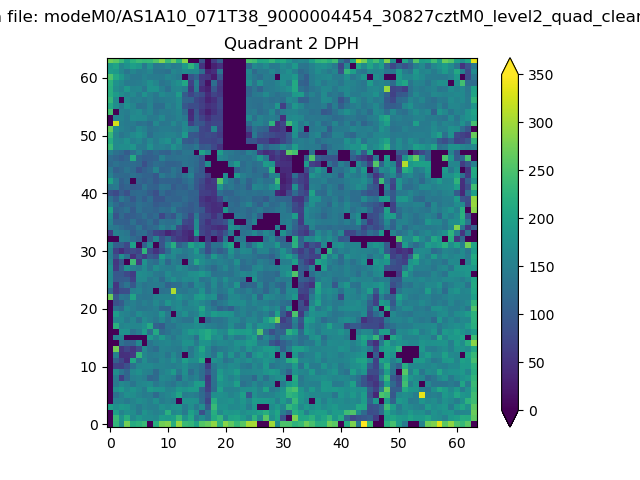
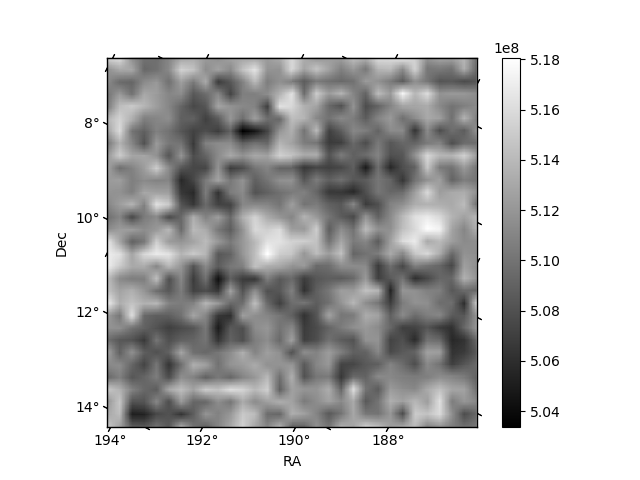
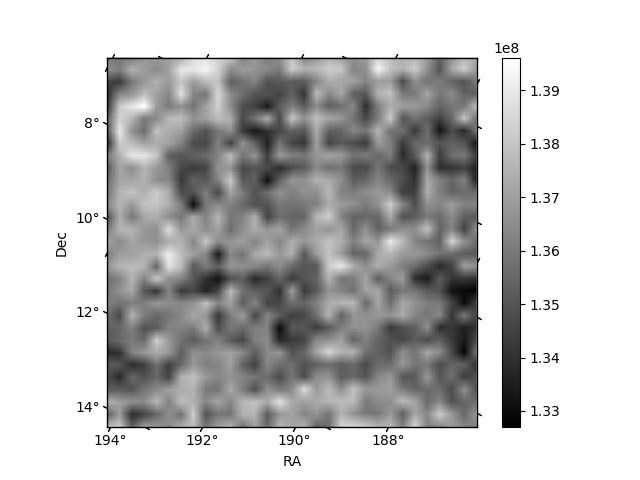
Histogram calculated using DETX and DETY for each event in the final _common_clean file
| Quadrant A | 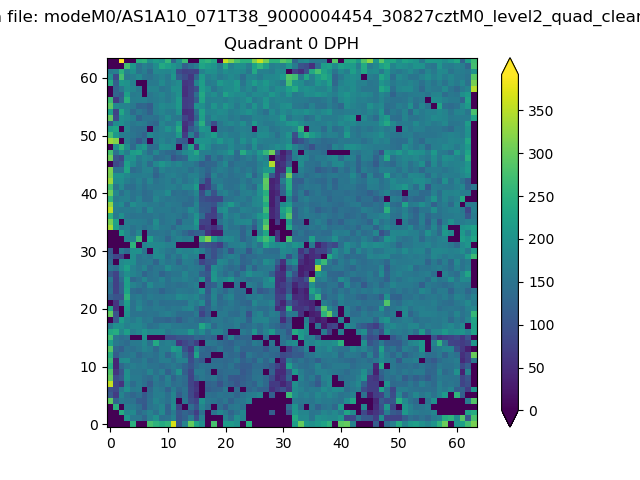 |
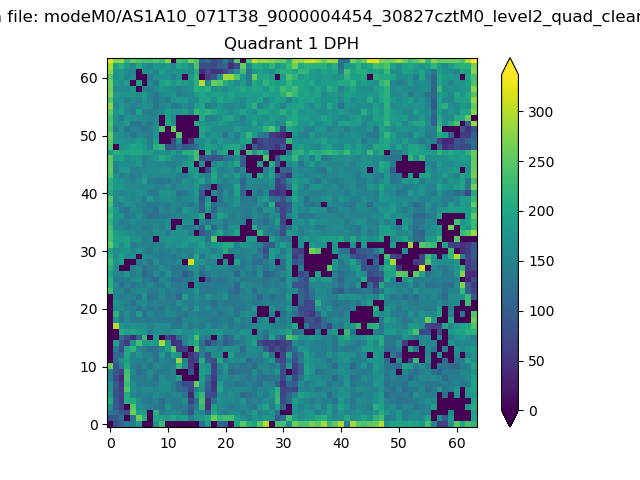 |
Quadrant B |
|---|---|---|---|
| Quadrant D | 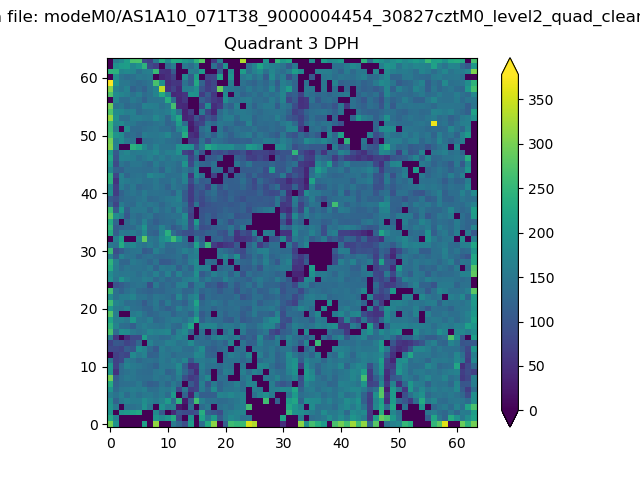 |
 |
Quadrant C |
| Plot type | Count rate plots | Images |
|---|---|---|
| Comparison with Poisson distribution Blue bars denote a histogram of data divided into 1 sec bins. Red curve is a Poisson curve with rate = median count rate of data. |
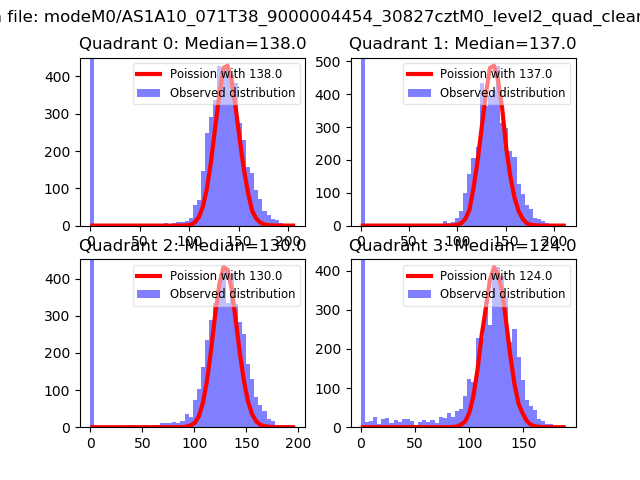 |
 |
| Quadrant-wise count rates Data is divided into 100 sec bins |
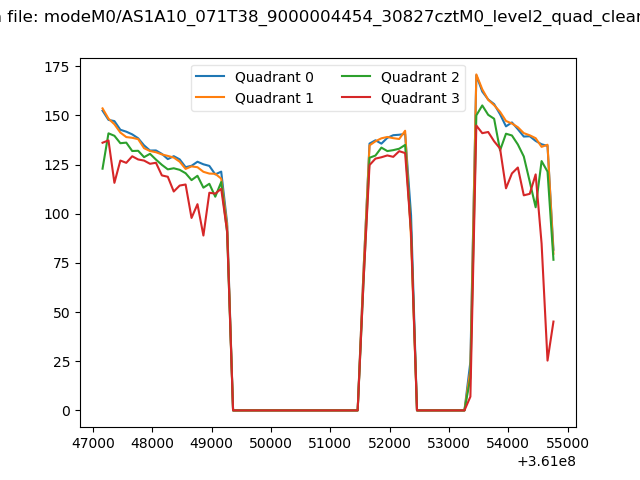 |
|
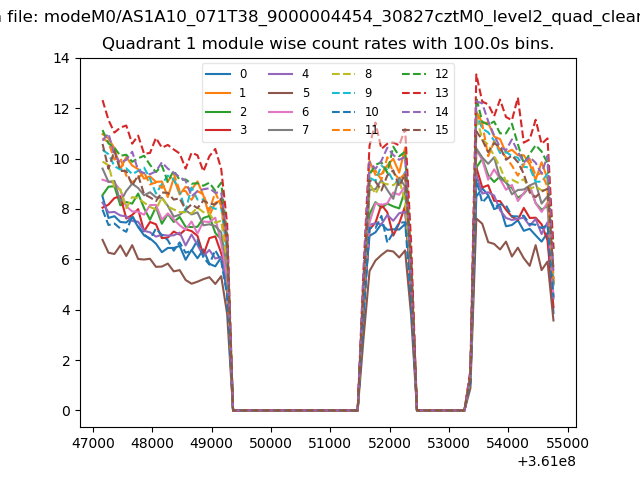
| Module-wise count rates for Quadrant A Data is divided into 100 sec bins |
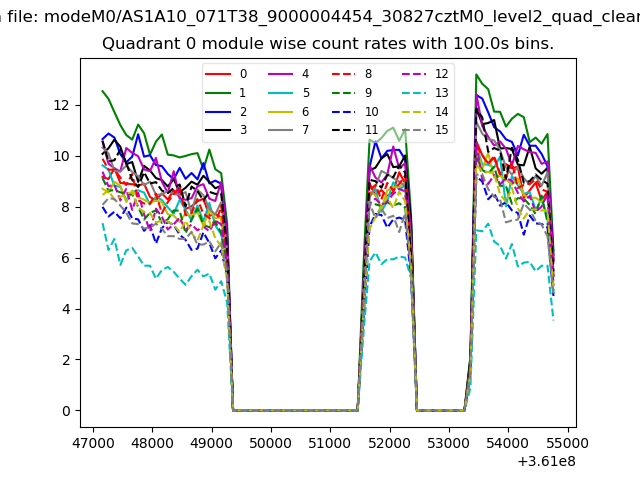 |
 |
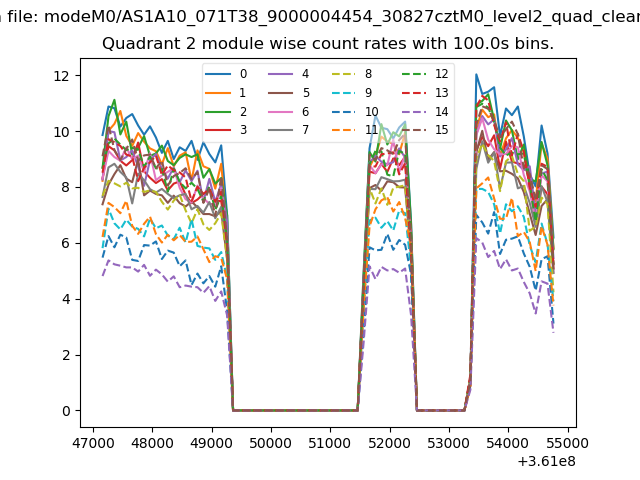
| Module-wise count rates for Quadrant B Data is divided into 100 sec bins |
 |
 |
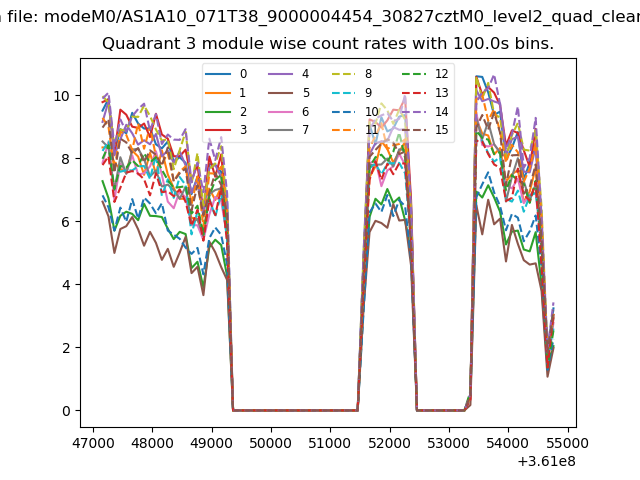
| Module-wise count rates for Quadrant C Data is divided into 100 sec bins |
 |
 |
| Module-wise count rates for Quadrant D Data is divided into 100 sec bins |
 |
 |
| Parameter | Plot |
|---|---|
| CZT HV Monitor | 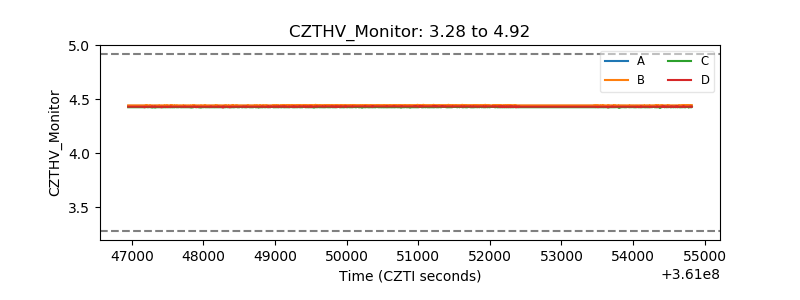 |
| D_VDD | 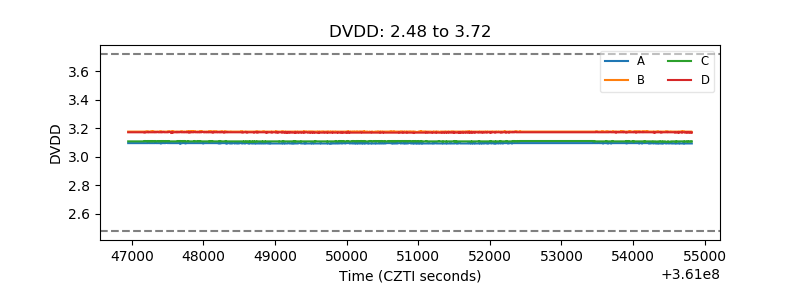 |
| Temperature 1 | 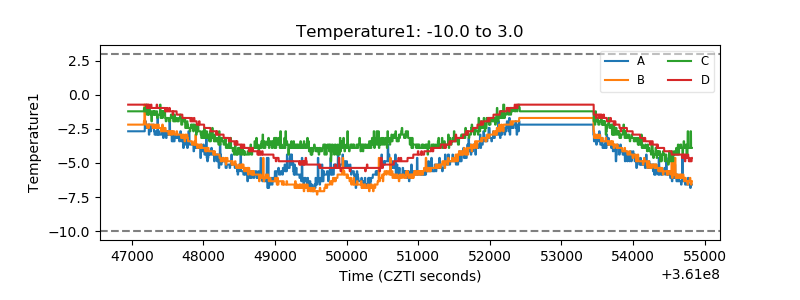 |
| Veto HV Monitor | 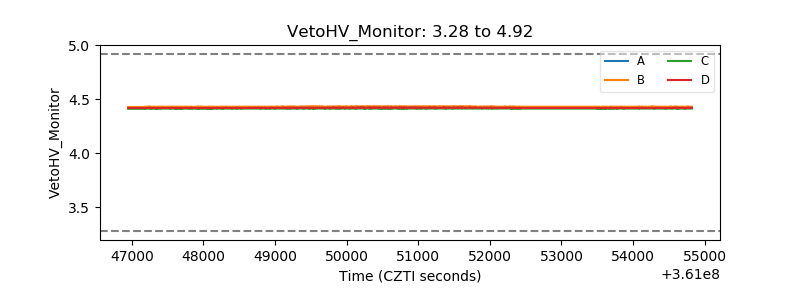 |
| Veto LLD | 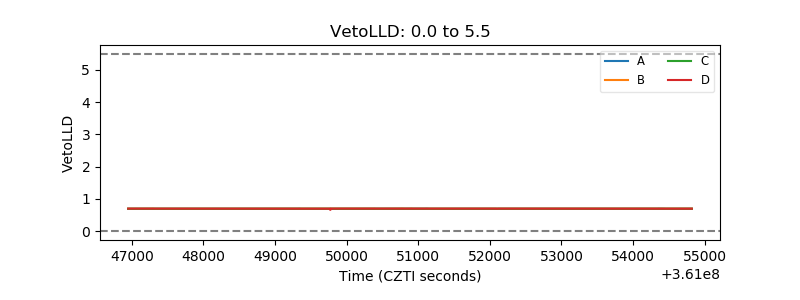 |
| Alpha Counter | 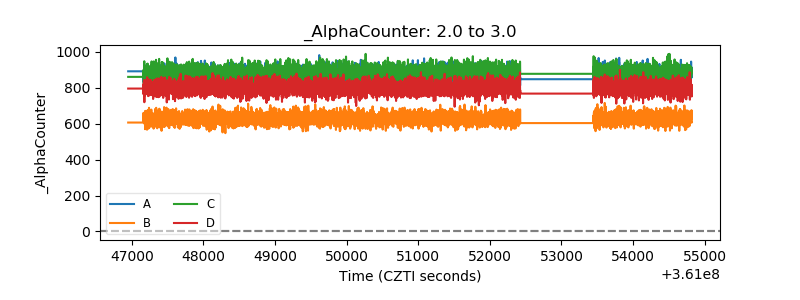 |
| _CPM_Rate | 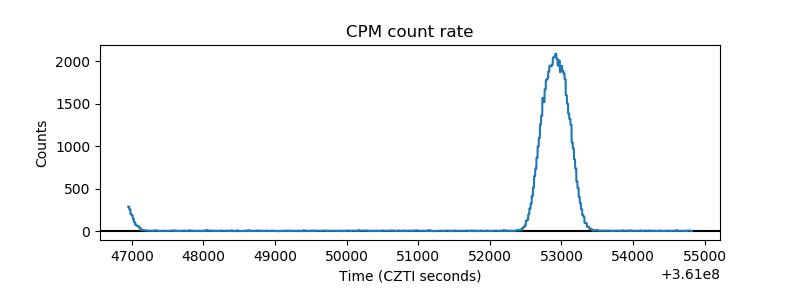 |
| CZT Counter | 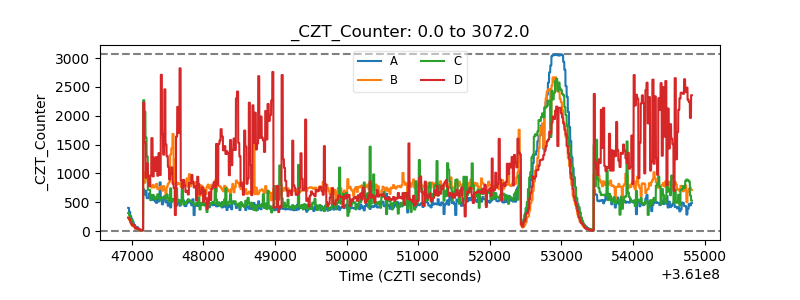 |
| +2.5 Volts monitor | 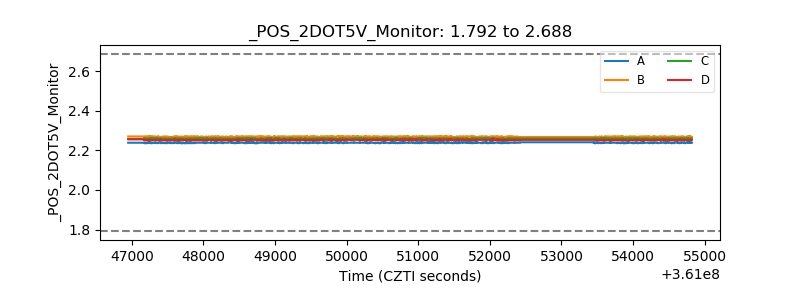 |
| +5 Volts monitor | 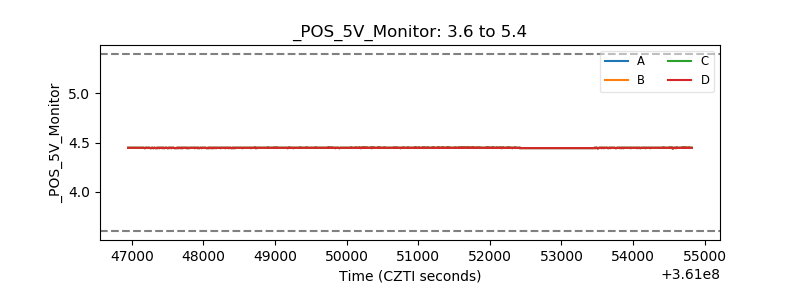 |
| _ROLL_ROT | 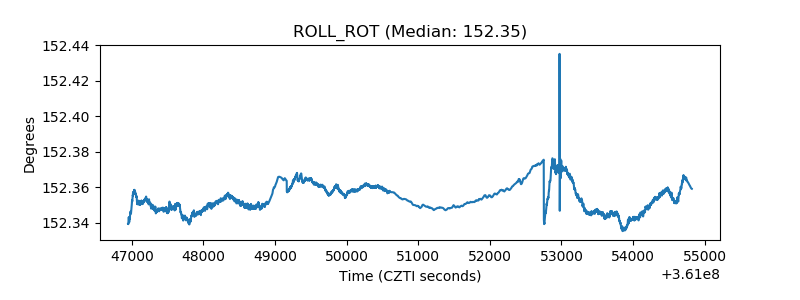 |
| _Roll_DEC | 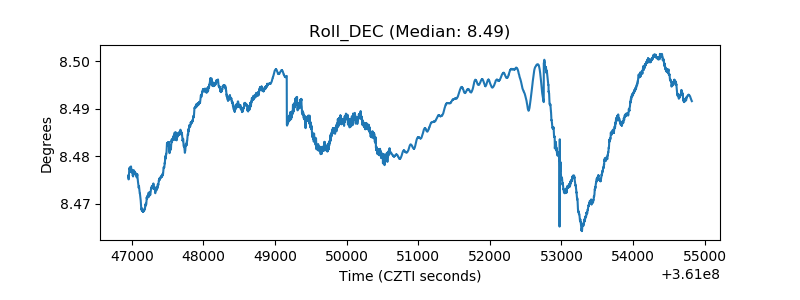 |
| _Roll_RA | 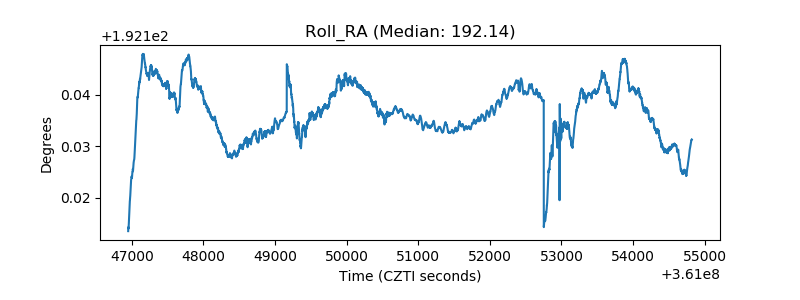 |
| Veto Counter | 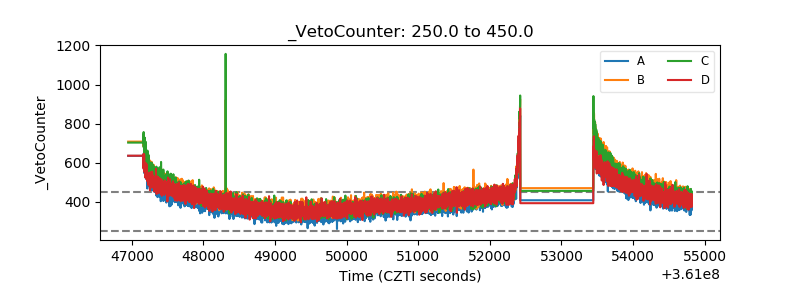 |