| Param | Original file | Final file |
|---|---|---|
| Filename | modeM0/AS1A10_071T38_9000004454_30829cztM0_level2.evt | modeM0/AS1A10_071T38_9000004454_30829cztM0_level2_quad_clean.evt |
| Size (bytes) | 664,272,000 | 89,928,000 |
| Size | 633.5 MB | 85.8 MB |
| Events in quadrant A | 3,131,515 | 612,226 |
| Events in quadrant B | 5,098,225 | 613,872 |
| Events in quadrant C | 3,801,093 | 559,815 |
| Events in quadrant D | 7,654,777 | 490,758 |
| Mode M9 | |||
|---|---|---|---|
| Quadrant | BADHDUFLAG | Total packets | Discarded packets |
| A | 0 | 16 | 0 |
| B | 0 | 17 | 0 |
| C | 0 | 17 | 0 |
| D | 0 | 17 | 0 |
| Mode M0 | |||
|---|---|---|---|
| Quadrant | BADHDUFLAG | Total packets | Discarded packets |
| A | 0 | 13283 | 2 |
| B | 0 | 19567 | 2 |
| C | 0 | 15344 | 2 |
| D | 0 | 27247 | 3 |
| Mode SS | |||
|---|---|---|---|
| Quadrant | BADHDUFLAG | Total packets | Discarded packets |
| A | 0 | 132 | 0 |
| B | 0 | 132 | 0 |
| C | 0 | 132 | 0 |
| D | 0 | 132 | 0 |
| Quadrant | Total seconds | Saturated seconds | Saturation percentage |
|---|---|---|---|
| A | 6384 | 37 | 0.579574% |
| B | 6384 | 98 | 1.535088% |
| C | 6384 | 544 | 8.521303% |
| D | 6383 | 1163 | 18.220273% |
Noise dominated data is calculated using 1-second bins in cleaned event files. If a bin has >2000 counts, and if more than 50% of those come from <1% of pixels, then it is considered to be noise-dominated and hence unusable.
| Quadrant | # 1 sec bins | Bins with >0 counts | Bins with >2000 counts | High rate bins dominated by noise | Noise dominated (total time) | Noise dominated (detector-on time) | Marked lightcurve |
|---|---|---|---|---|---|---|---|
| A | 7519 | 6384 | 0 | 0 | 0.00% | 0.00% | 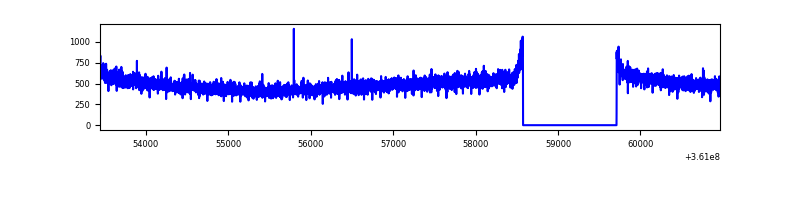 |
| B | 7519 | 6384 | 12 | 12 | 0.16% | 0.19% | 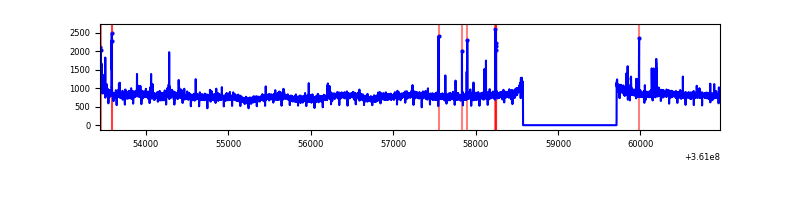 |
| C | 7519 | 6384 | 50 | 50 | 0.66% | 0.78% | 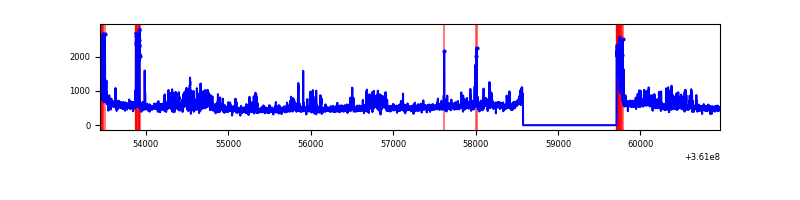 |
| D | 7518 | 6383 | 1083 | 1083 | 14.41% | 16.97% | 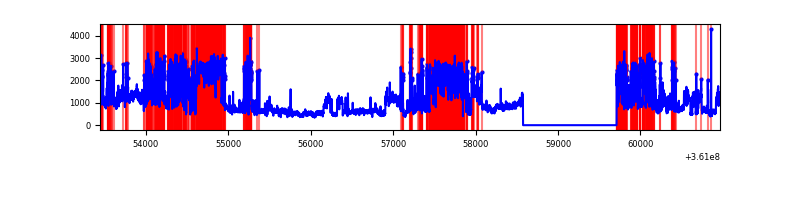 |
Top three noisy pixels from each quadrant. If the there are fewer than three noisy pixels in the level2.evt file, extra rows are filled as -1
| Pixel properties | Quadrant properties | ||||||
|---|---|---|---|---|---|---|---|
| Quadrant | DetID | PixID | Counts | Sigma | Mean | Median | Sigma |
| A | 13 | 254 | 12413 | 71.19 | 811 | 795 | 163.2 |
| A | 3 | 137 | 7849 | 43.22 | 811 | 795 | 163.2 |
| A | 0 | 226 | 6869 | 37.22 | 811 | 795 | 163.2 |
| B | 6 | 159 | 1801520 | 11729.65 | 806 | 786 | 153.5 |
| B | 5 | 255 | 36485 | 232.54 | 806 | 786 | 153.5 |
| B | 0 | 230 | 19725 | 123.37 | 806 | 786 | 153.5 |
| C | 14 | 238 | 275073 | 1553.79 | 750 | 757 | 176.5 |
| C | 0 | 10 | 222560 | 1256.34 | 750 | 757 | 176.5 |
| C | 14 | 254 | 207030 | 1168.38 | 750 | 757 | 176.5 |
| D | 12 | 218 | 2167670 | 12978.13 | 712 | 696 | 167.0 |
| D | 8 | 195 | 1900458 | 11377.78 | 712 | 696 | 167.0 |
| D | 12 | 2 | 506789 | 3031.02 | 712 | 696 | 167.0 |
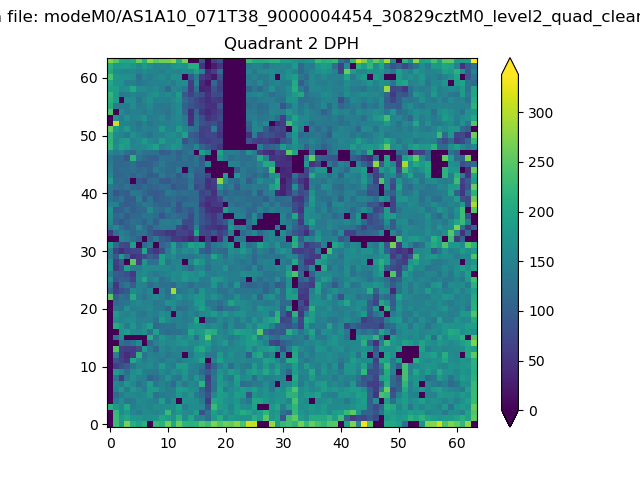
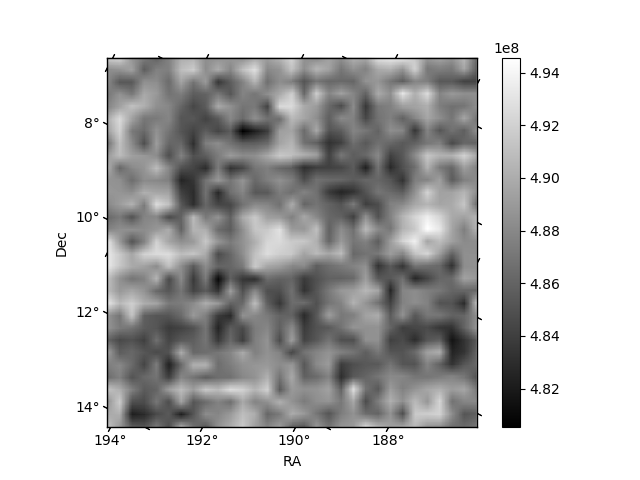
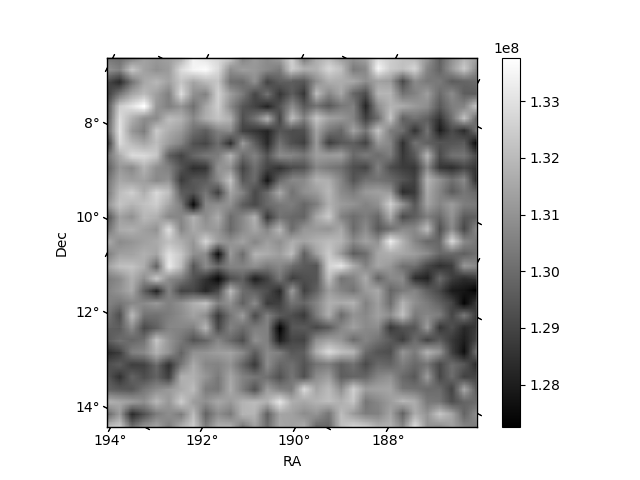
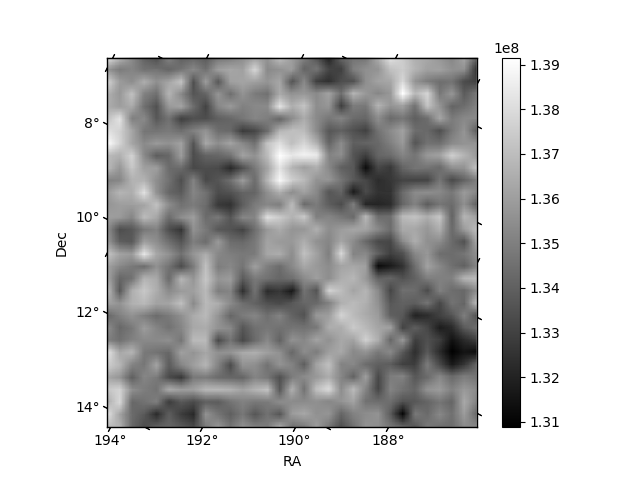
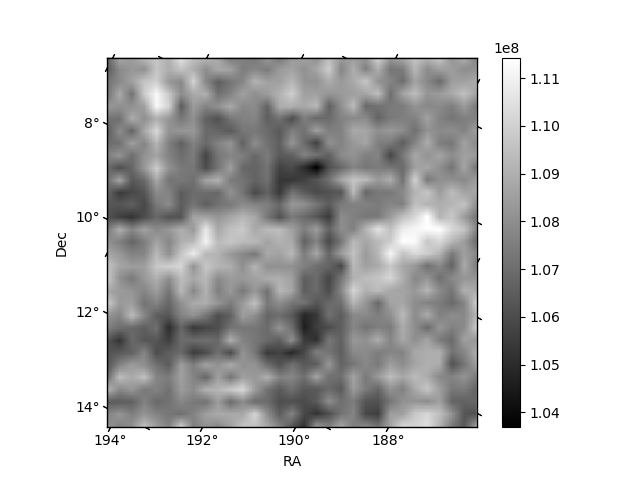
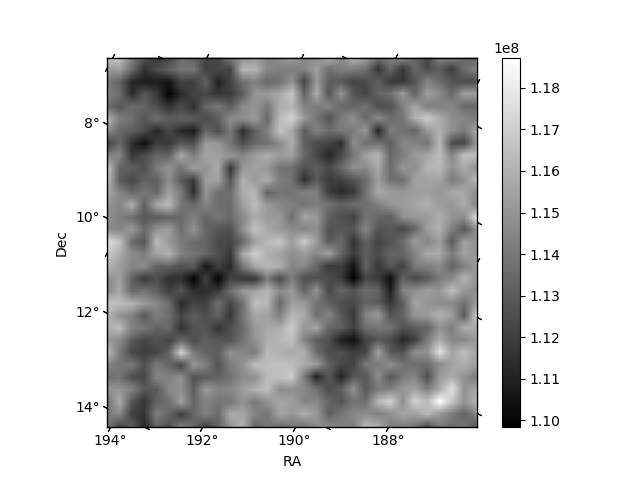
Histogram calculated using DETX and DETY for each event in the final _common_clean file
| Quadrant A | 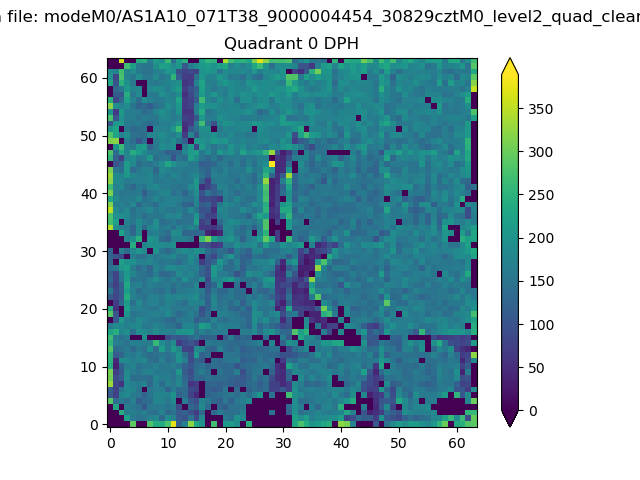 |
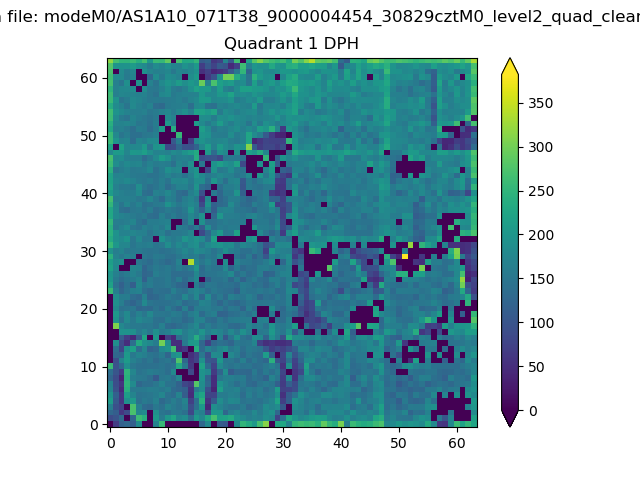 |
Quadrant B |
|---|---|---|---|
| Quadrant D | 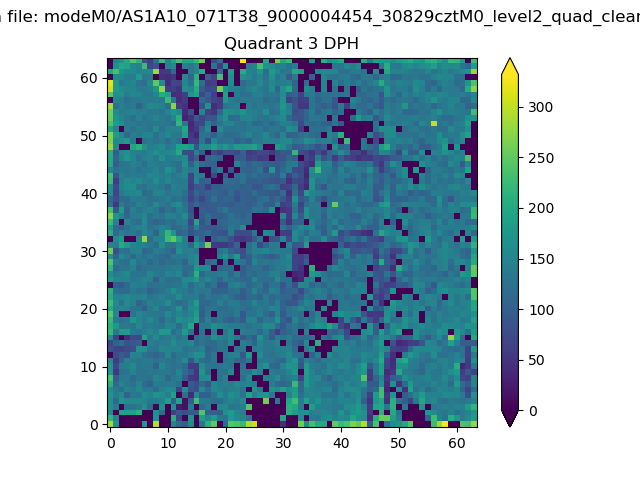 |
 |
Quadrant C |
| Plot type | Count rate plots | Images |
|---|---|---|
| Comparison with Poisson distribution Blue bars denote a histogram of data divided into 1 sec bins. Red curve is a Poisson curve with rate = median count rate of data. |
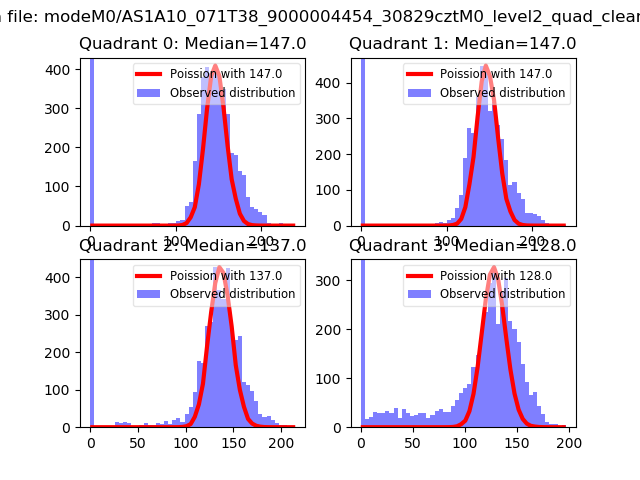 |
 |
| Quadrant-wise count rates Data is divided into 100 sec bins |
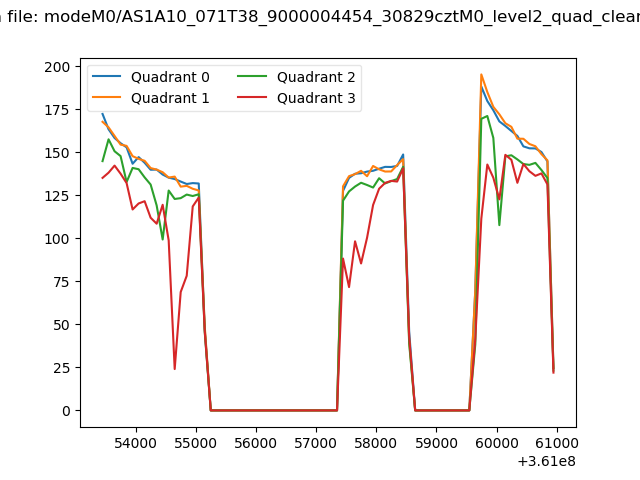 |
|
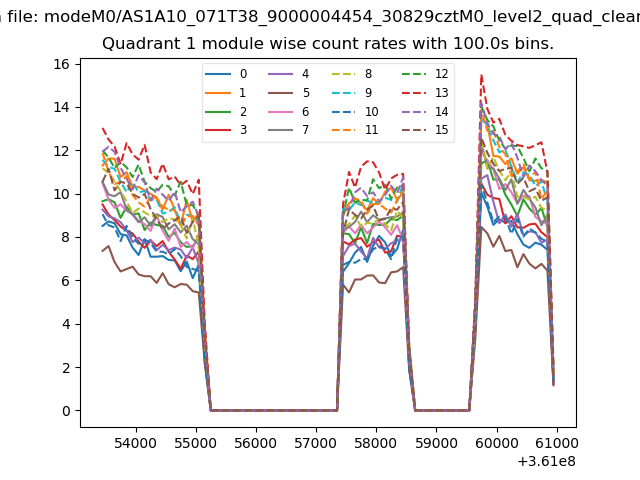
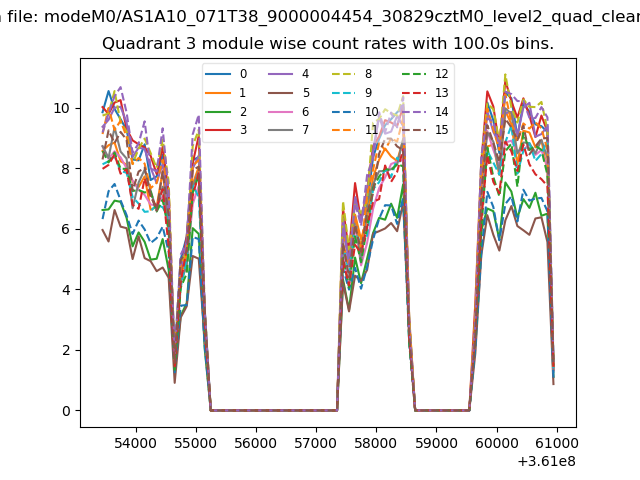
| Module-wise count rates for Quadrant A Data is divided into 100 sec bins |
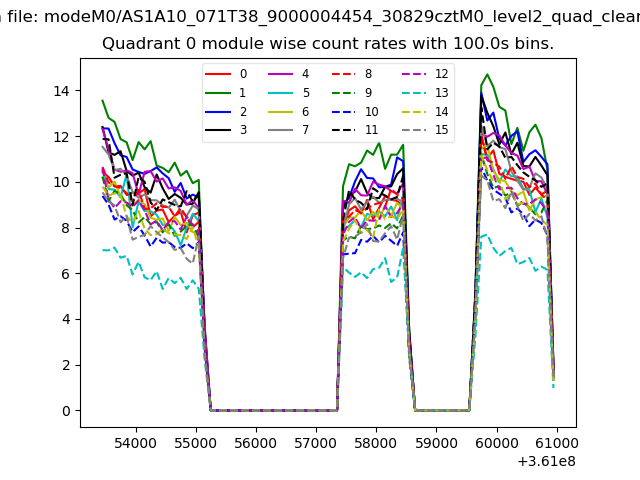 |
 |
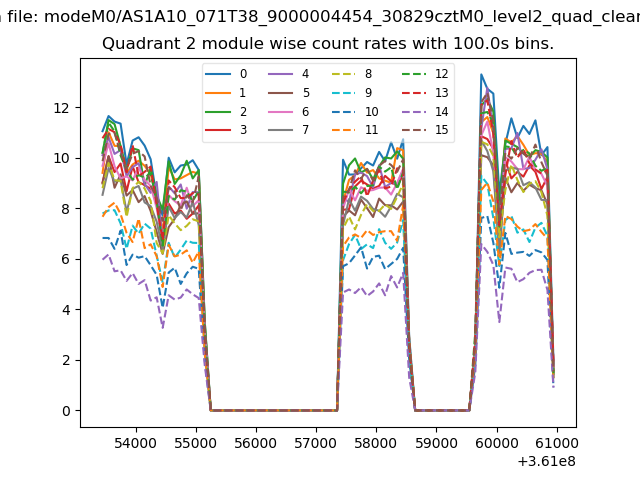
| Module-wise count rates for Quadrant B Data is divided into 100 sec bins |
 |
 |
| Module-wise count rates for Quadrant C Data is divided into 100 sec bins |
 |
 |
| Module-wise count rates for Quadrant D Data is divided into 100 sec bins |
 |
 |
| Parameter | Plot |
|---|---|
| CZT HV Monitor | 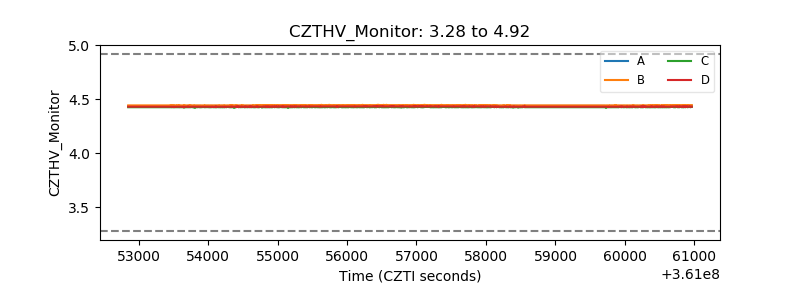 |
| D_VDD |  |
| Temperature 1 | 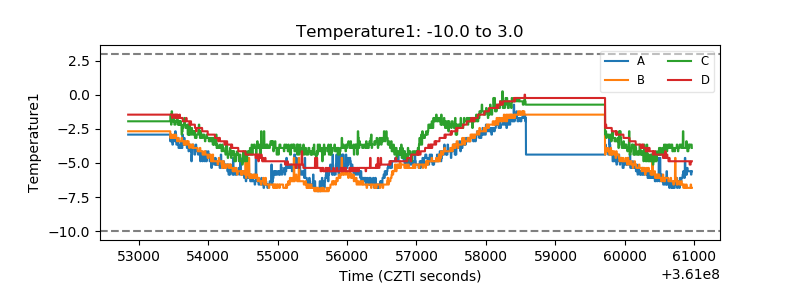 |
| Veto HV Monitor | 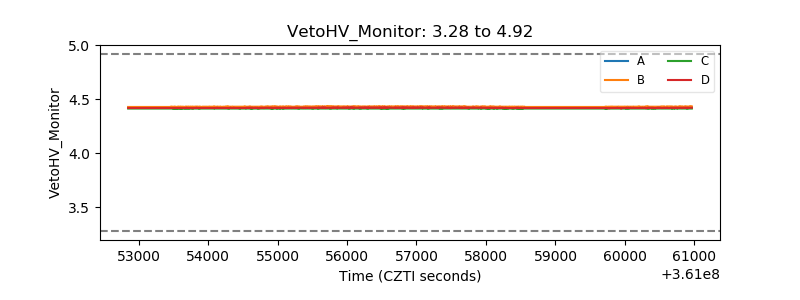 |
| Veto LLD | 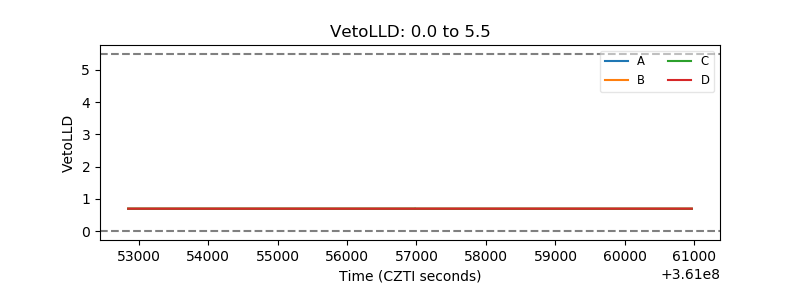 |
| Alpha Counter | 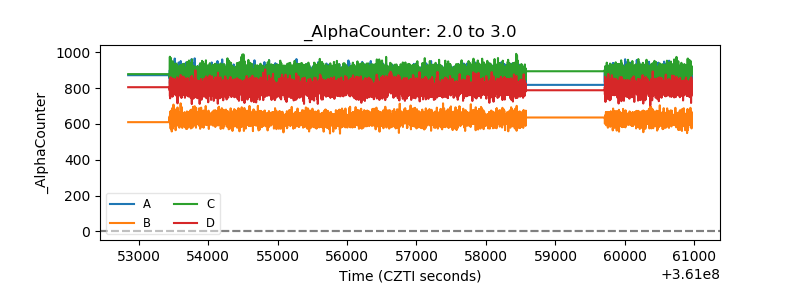 |
| _CPM_Rate | 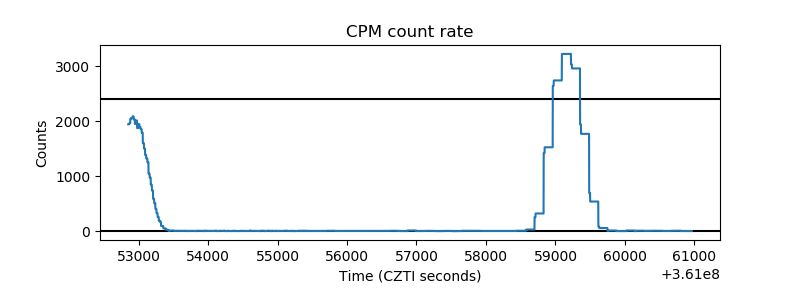 |
| CZT Counter | 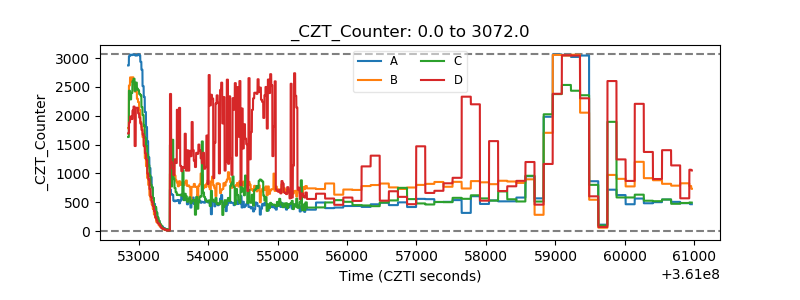 |
| +2.5 Volts monitor |  |
| +5 Volts monitor | 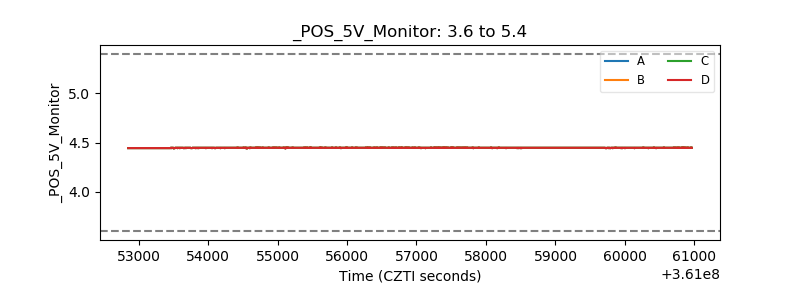 |
| _ROLL_ROT | 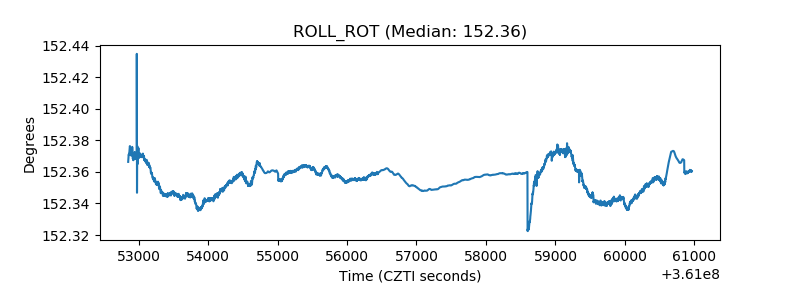 |
| _Roll_DEC | 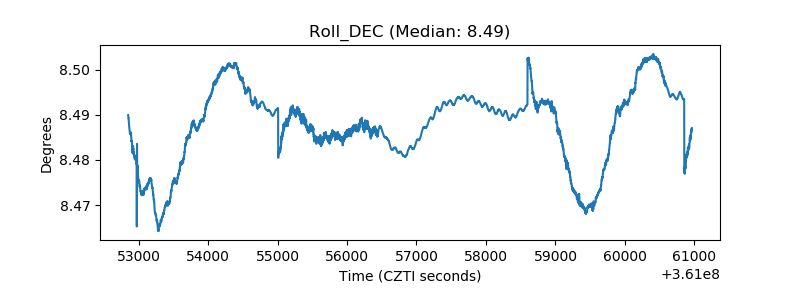 |
| _Roll_RA | 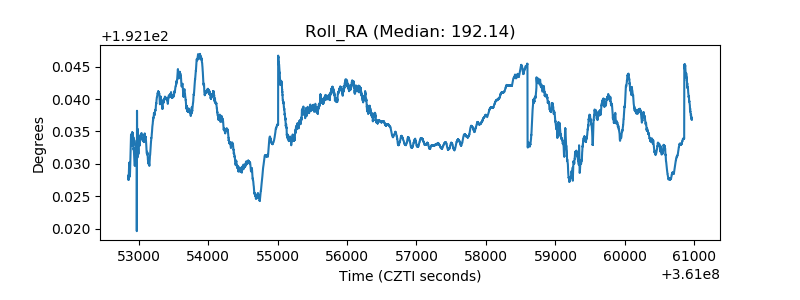 |
| Veto Counter | 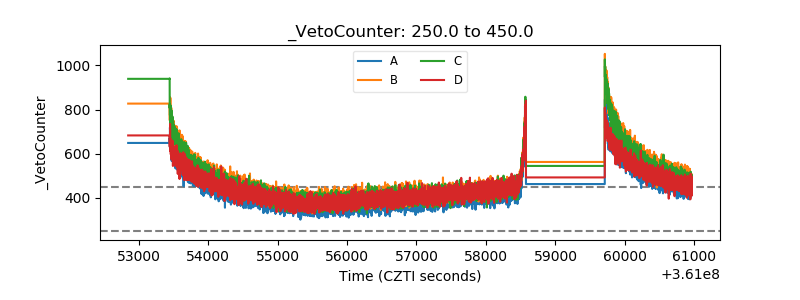 |