| Param | Original file | Final file |
|---|---|---|
| Filename | modeM0/AS1A10_071T38_9000004454_30830cztM0_level2.evt | modeM0/AS1A10_071T38_9000004454_30830cztM0_level2_quad_clean.evt |
| Size (bytes) | 625,464,000 | 86,696,640 |
| Size | 596.5 MB | 82.7 MB |
| Events in quadrant A | 3,217,304 | 584,036 |
| Events in quadrant B | 5,466,041 | 586,864 |
| Events in quadrant C | 3,587,751 | 535,913 |
| Events in quadrant D | 6,248,478 | 481,664 |
| Mode M9 | |||
|---|---|---|---|
| Quadrant | BADHDUFLAG | Total packets | Discarded packets |
| A | 0 | 16 | 0 |
| B | 0 | 17 | 0 |
| C | 0 | 17 | 0 |
| D | 0 | 17 | 0 |
| Mode M0 | |||
|---|---|---|---|
| Quadrant | BADHDUFLAG | Total packets | Discarded packets |
| A | 0 | 13276 | 2 |
| B | 0 | 20359 | 2 |
| C | 0 | 14402 | 2 |
| D | 0 | 23051 | 4 |
| Mode SS | |||
|---|---|---|---|
| Quadrant | BADHDUFLAG | Total packets | Discarded packets |
| A | 0 | 126 | 0 |
| B | 0 | 126 | 0 |
| C | 0 | 126 | 0 |
| D | 0 | 126 | 0 |
| Quadrant | Total seconds | Saturated seconds | Saturation percentage |
|---|---|---|---|
| A | 6259 | 28 | 0.447356% |
| B | 6259 | 207 | 3.307238% |
| C | 6259 | 294 | 4.697236% |
| D | 6258 | 750 | 11.984660% |
Noise dominated data is calculated using 1-second bins in cleaned event files. If a bin has >2000 counts, and if more than 50% of those come from <1% of pixels, then it is considered to be noise-dominated and hence unusable.
| Quadrant | # 1 sec bins | Bins with >0 counts | Bins with >2000 counts | High rate bins dominated by noise | Noise dominated (total time) | Noise dominated (detector-on time) | Marked lightcurve |
|---|---|---|---|---|---|---|---|
| A | 7504 | 6260 | 0 | 0 | 0.00% | 0.00% | 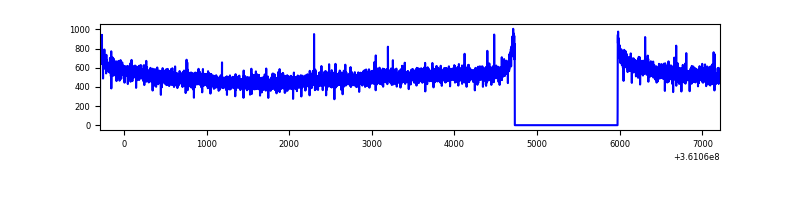 |
| B | 7503 | 6258 | 103 | 103 | 1.37% | 1.65% | 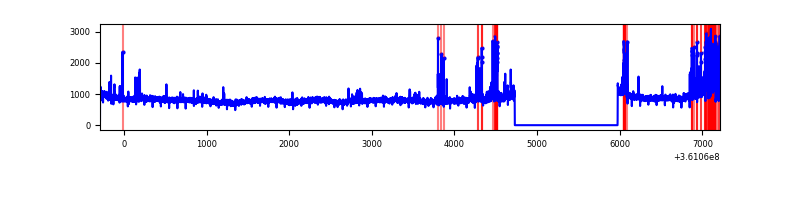 |
| C | 7504 | 6259 | 41 | 41 | 0.55% | 0.66% | 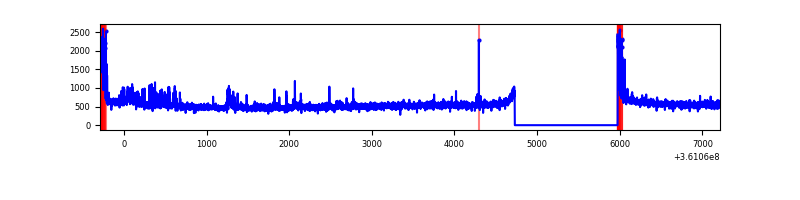 |
| D | 7503 | 6259 | 621 | 621 | 8.28% | 9.92% | 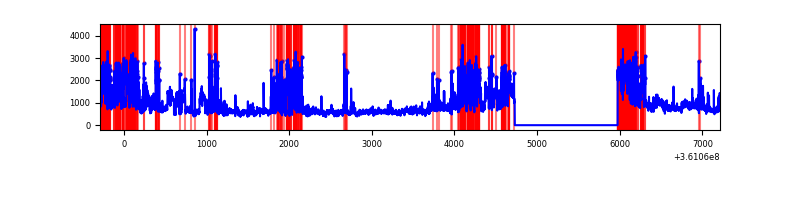 |
Top three noisy pixels from each quadrant. If the there are fewer than three noisy pixels in the level2.evt file, extra rows are filled as -1
| Pixel properties | Quadrant properties | ||||||
|---|---|---|---|---|---|---|---|
| Quadrant | DetID | PixID | Counts | Sigma | Mean | Median | Sigma |
| A | 13 | 254 | 12435 | 69.86 | 833 | 819 | 166.3 |
| A | 3 | 137 | 7778 | 41.85 | 833 | 819 | 166.3 |
| A | 0 | 226 | 6993 | 37.13 | 833 | 819 | 166.3 |
| B | 6 | 159 | 1764150 | 11349.54 | 825 | 806 | 155.4 |
| B | 5 | 255 | 358720 | 2303.67 | 825 | 806 | 155.4 |
| B | 0 | 230 | 28921 | 180.96 | 825 | 806 | 155.4 |
| C | 14 | 238 | 180758 | 997.65 | 776 | 783 | 180.4 |
| C | 0 | 10 | 177910 | 981.87 | 776 | 783 | 180.4 |
| C | 3 | 233 | 94330 | 518.56 | 776 | 783 | 180.4 |
| D | 12 | 218 | 1675463 | 9522.24 | 743 | 727 | 175.9 |
| D | 8 | 195 | 1402945 | 7972.76 | 743 | 727 | 175.9 |
| D | 1 | 52 | 128403 | 725.94 | 743 | 727 | 175.9 |
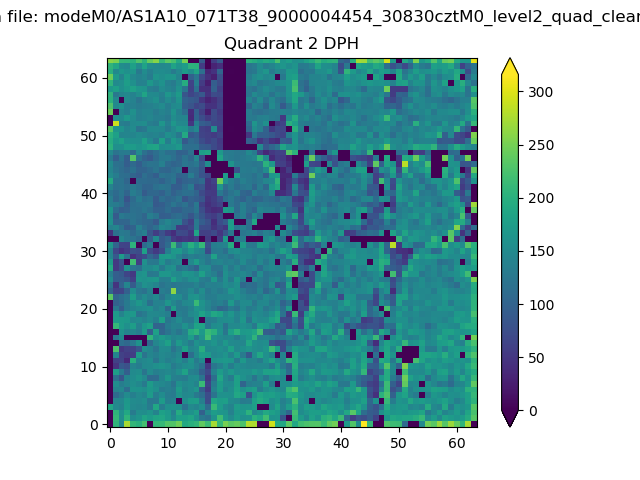
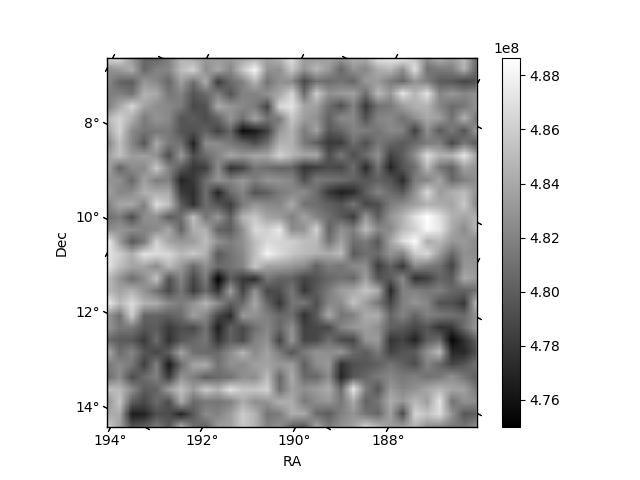
Histogram calculated using DETX and DETY for each event in the final _common_clean file
| Quadrant A | 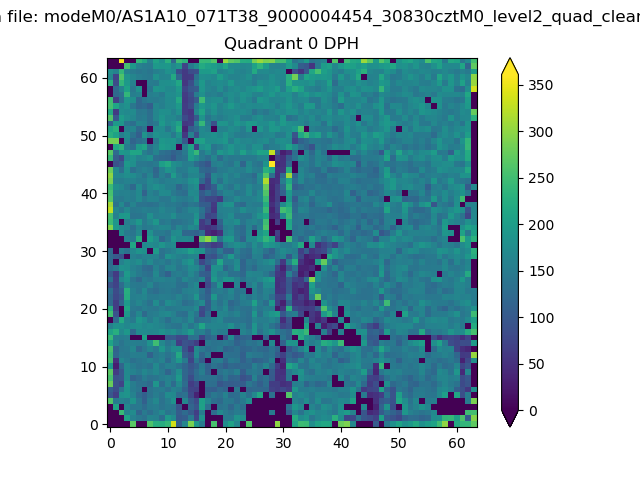 |
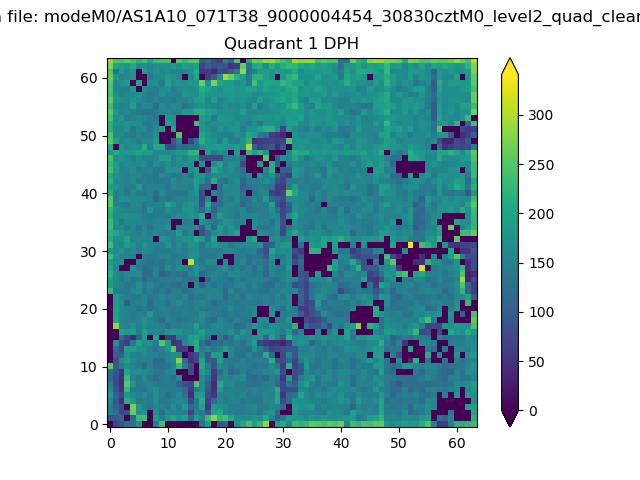 |
Quadrant B |
|---|---|---|---|
| Quadrant D | 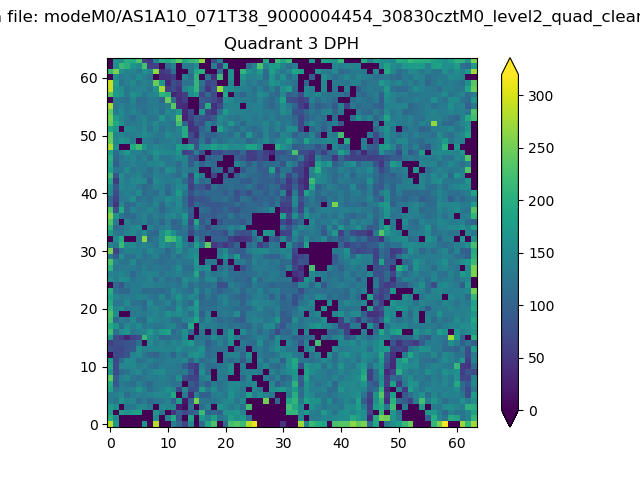 |
 |
Quadrant C |
| Plot type | Count rate plots | Images |
|---|---|---|
| Comparison with Poisson distribution Blue bars denote a histogram of data divided into 1 sec bins. Red curve is a Poisson curve with rate = median count rate of data. |
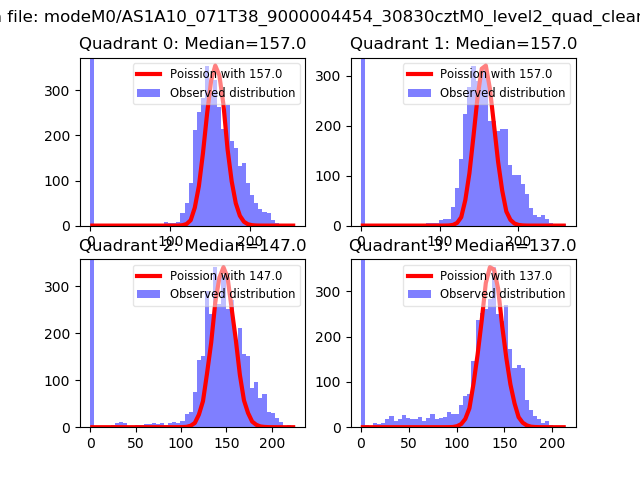 |
 |
| Quadrant-wise count rates Data is divided into 100 sec bins |
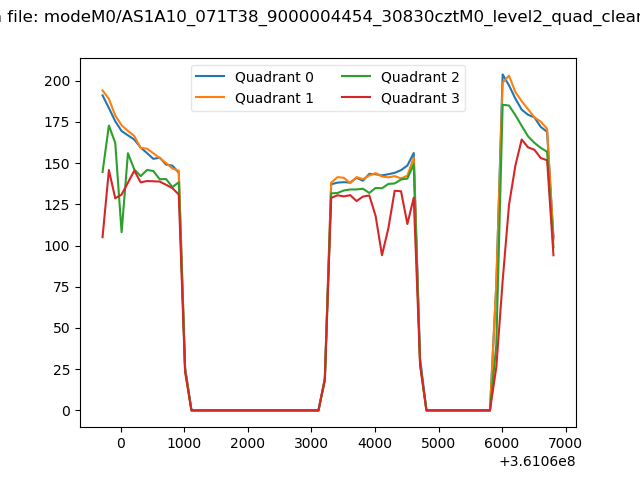 |
|
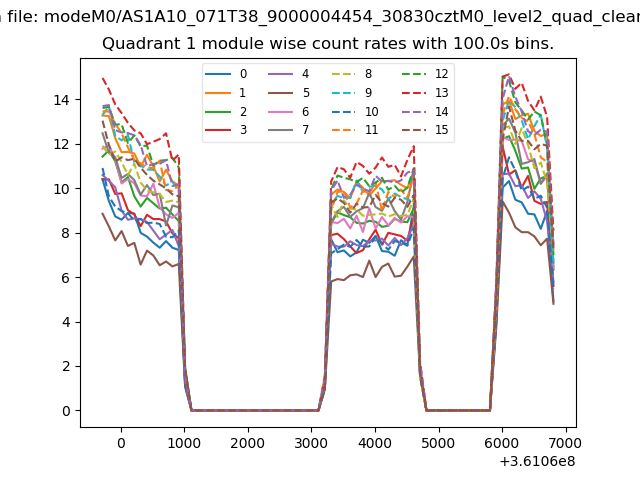
| Module-wise count rates for Quadrant A Data is divided into 100 sec bins |
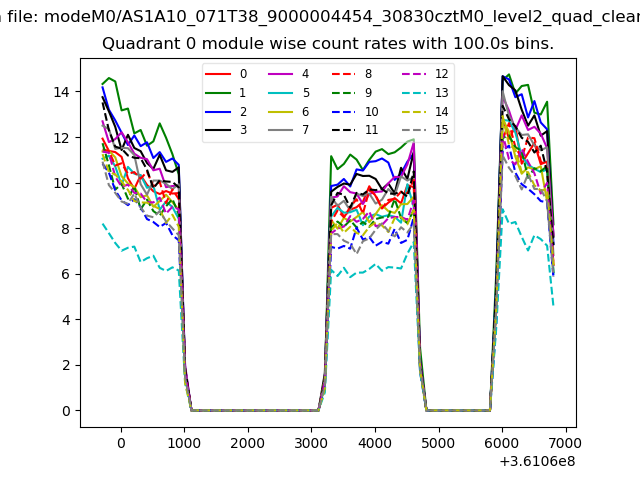 |
 |
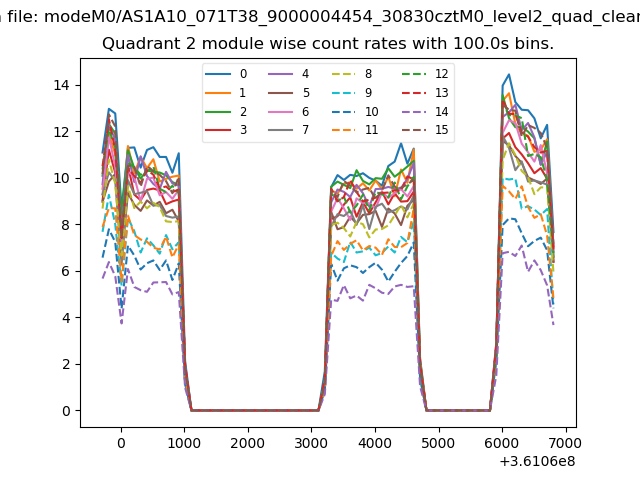
| Module-wise count rates for Quadrant B Data is divided into 100 sec bins |
 |
 |
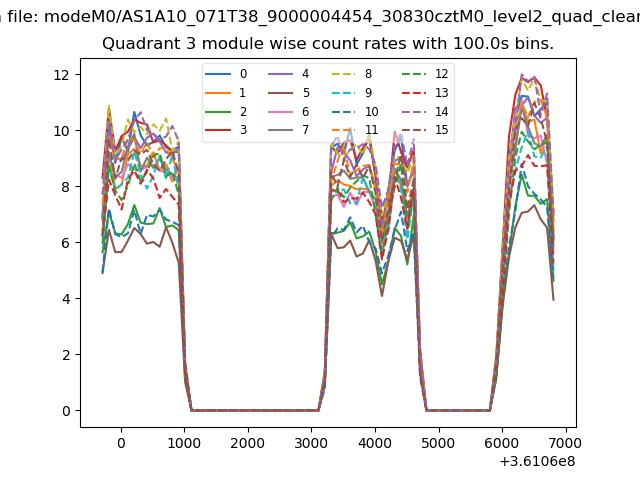
| Module-wise count rates for Quadrant C Data is divided into 100 sec bins |
 |
 |
| Module-wise count rates for Quadrant D Data is divided into 100 sec bins |
 |
 |
| Parameter | Plot |
|---|---|
| CZT HV Monitor | 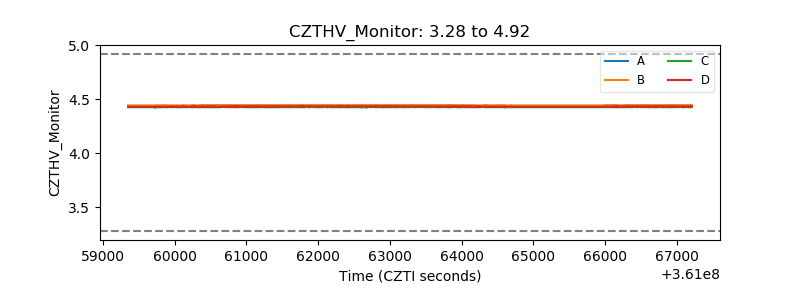 |
| D_VDD | 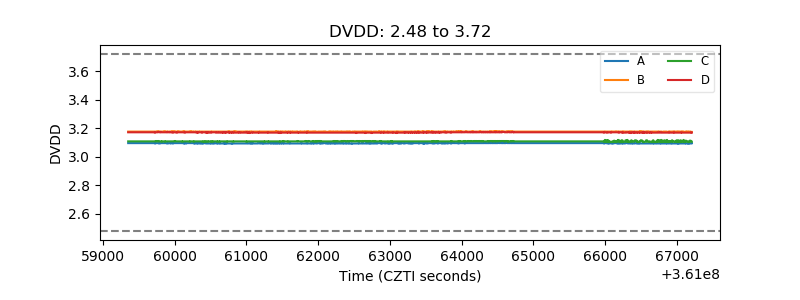 |
| Temperature 1 | 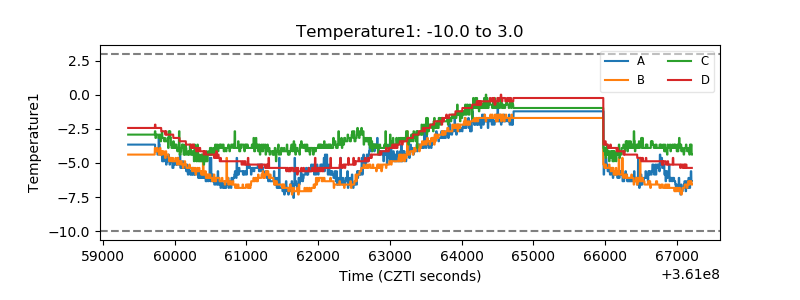 |
| Veto HV Monitor | 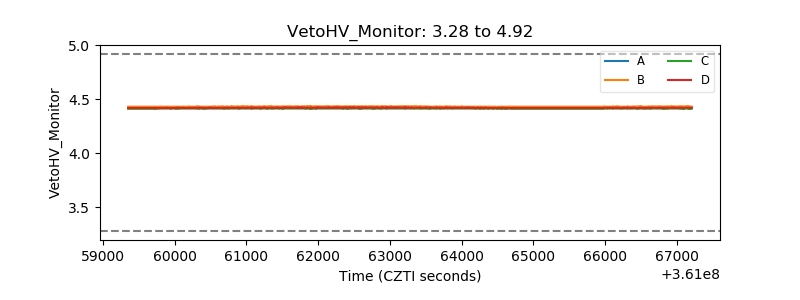 |
| Veto LLD | 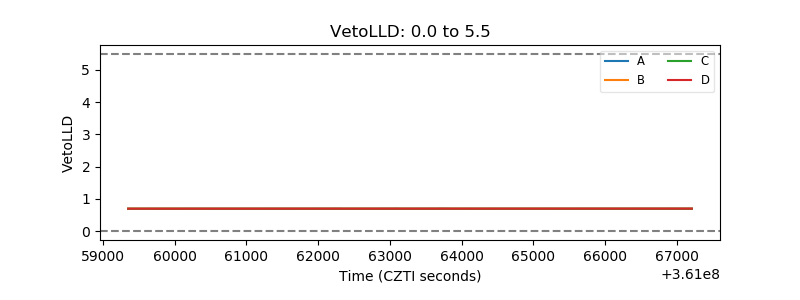 |
| Alpha Counter | 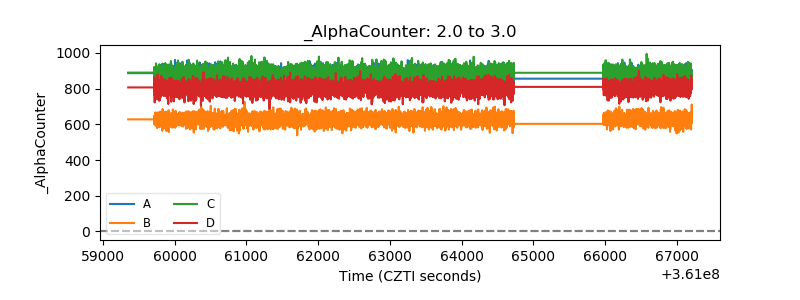 |
| _CPM_Rate | 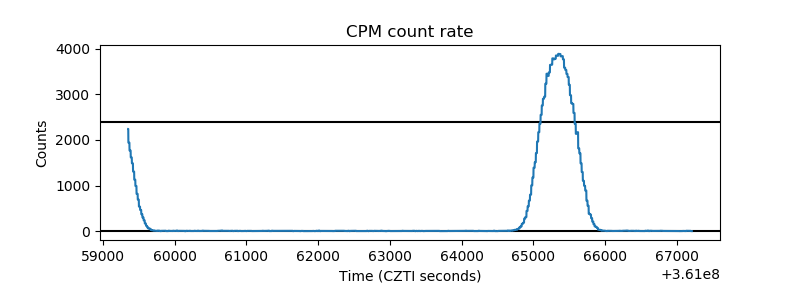 |
| CZT Counter | 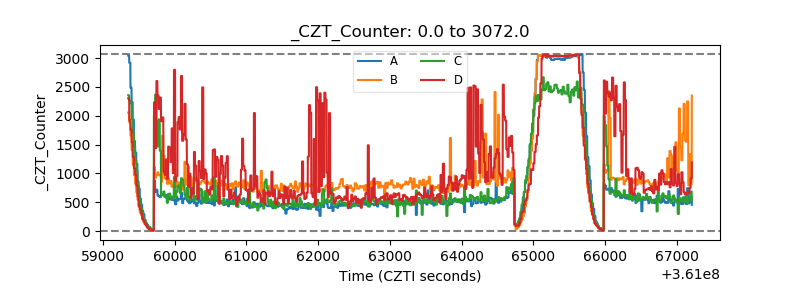 |
| +2.5 Volts monitor | 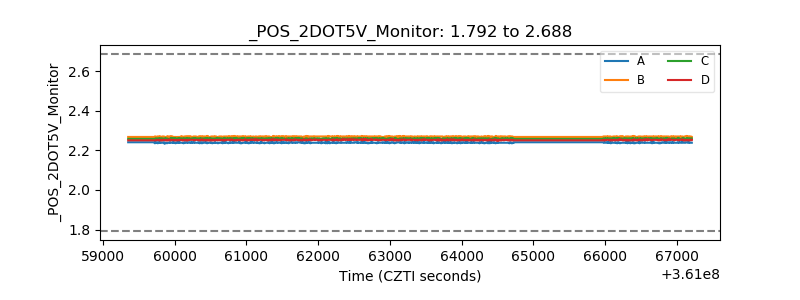 |
| +5 Volts monitor | 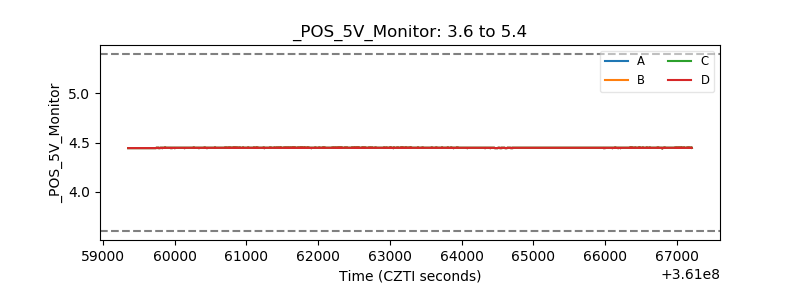 |
| _ROLL_ROT | 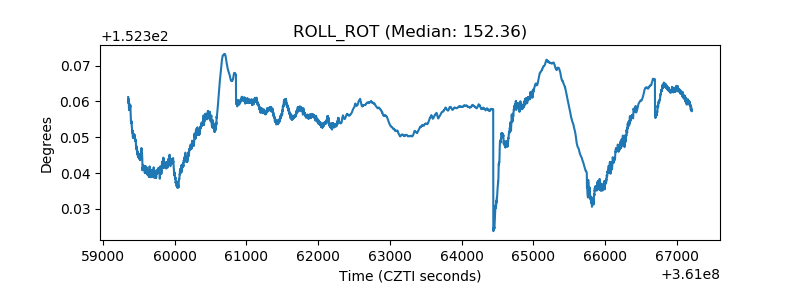 |
| _Roll_DEC | 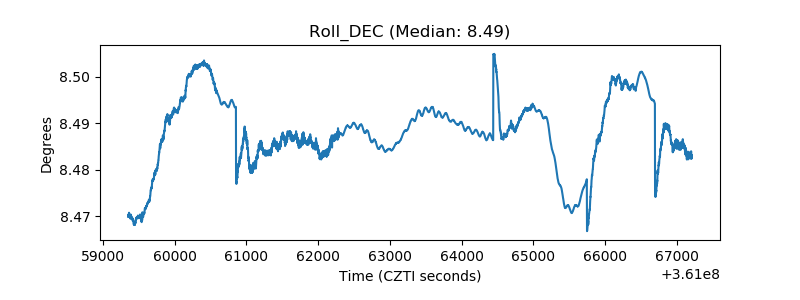 |
| _Roll_RA | 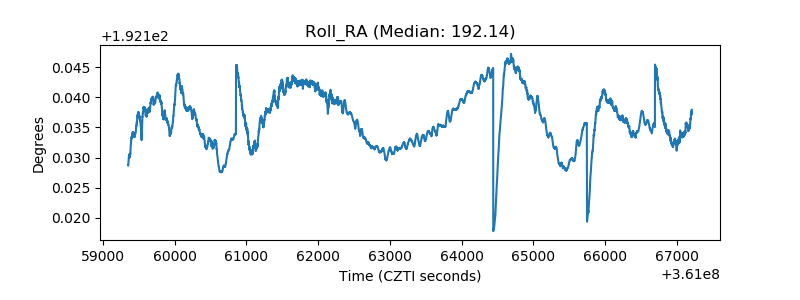 |
| Veto Counter | 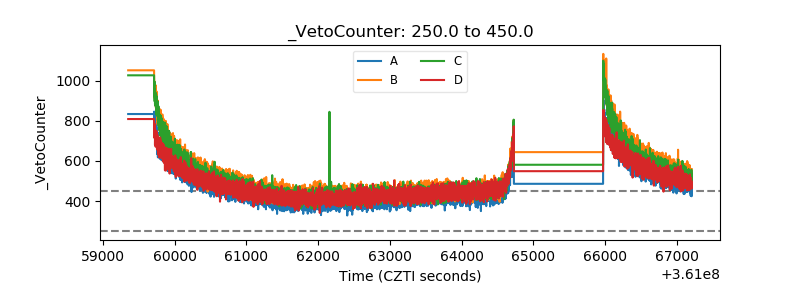 |