| Param | Original file | Final file |
|---|---|---|
| Filename | modeM0/AS1A10_071T38_9000004454_30831cztM0_level2.evt | modeM0/AS1A10_071T38_9000004454_30831cztM0_level2_quad_clean.evt |
| Size (bytes) | 623,476,800 | 80,542,080 |
| Size | 594.6 MB | 76.8 MB |
| Events in quadrant A | 3,373,762 | 528,359 |
| Events in quadrant B | 5,641,009 | 532,684 |
| Events in quadrant C | 3,930,182 | 487,247 |
| Events in quadrant D | 5,513,432 | 452,680 |
| Mode M9 | |||
|---|---|---|---|
| Quadrant | BADHDUFLAG | Total packets | Discarded packets |
| A | 0 | 22 | 0 |
| B | 0 | 23 | 0 |
| C | 0 | 23 | 0 |
| D | 0 | 23 | 0 |
| Mode M0 | |||
|---|---|---|---|
| Quadrant | BADHDUFLAG | Total packets | Discarded packets |
| A | 0 | 13623 | 2 |
| B | 0 | 20720 | 2 |
| C | 0 | 15657 | 2 |
| D | 0 | 20923 | 2 |
| Mode SS | |||
|---|---|---|---|
| Quadrant | BADHDUFLAG | Total packets | Discarded packets |
| A | 0 | 128 | 0 |
| B | 0 | 128 | 0 |
| C | 0 | 128 | 0 |
| D | 0 | 128 | 0 |
| Quadrant | Total seconds | Saturated seconds | Saturation percentage |
|---|---|---|---|
| A | 6270 | 26 | 0.414673% |
| B | 6270 | 197 | 3.141946% |
| C | 6270 | 502 | 8.006380% |
| D | 6270 | 290 | 4.625199% |
Noise dominated data is calculated using 1-second bins in cleaned event files. If a bin has >2000 counts, and if more than 50% of those come from <1% of pixels, then it is considered to be noise-dominated and hence unusable.
| Quadrant | # 1 sec bins | Bins with >0 counts | Bins with >2000 counts | High rate bins dominated by noise | Noise dominated (total time) | Noise dominated (detector-on time) | Marked lightcurve |
|---|---|---|---|---|---|---|---|
| A | 7580 | 6270 | 0 | 0 | 0.00% | 0.00% | 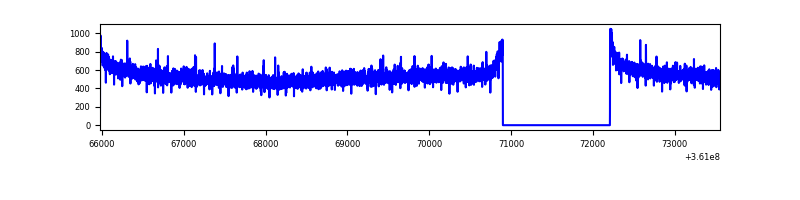 |
| B | 7580 | 6270 | 97 | 97 | 1.28% | 1.55% | 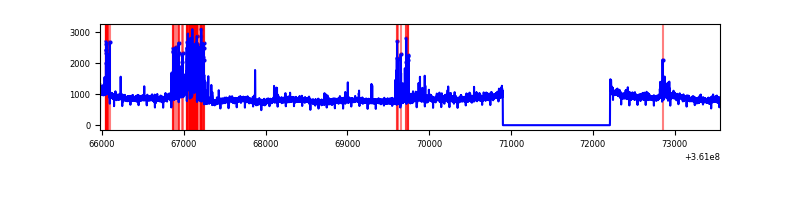 |
| C | 7580 | 6271 | 53 | 53 | 0.70% | 0.85% | 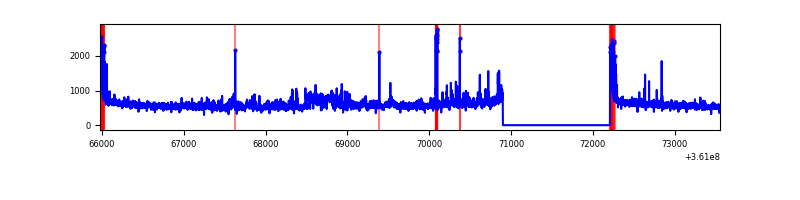 |
| D | 7580 | 6270 | 235 | 235 | 3.10% | 3.75% | 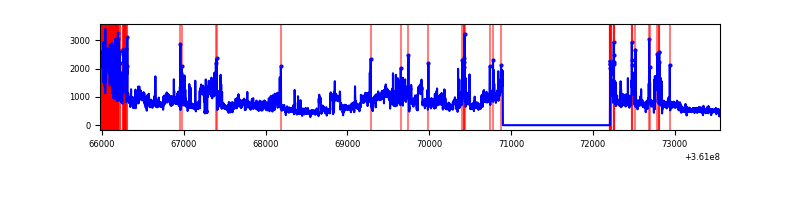 |
Top three noisy pixels from each quadrant. If the there are fewer than three noisy pixels in the level2.evt file, extra rows are filled as -1
| Pixel properties | Quadrant properties | ||||||
|---|---|---|---|---|---|---|---|
| Quadrant | DetID | PixID | Counts | Sigma | Mean | Median | Sigma |
| A | 13 | 254 | 11592 | 62.02 | 873 | 861 | 173.0 |
| A | 15 | 192 | 8063 | 41.63 | 873 | 861 | 173.0 |
| A | 3 | 137 | 8049 | 41.55 | 873 | 861 | 173.0 |
| B | 6 | 159 | 1778168 | 11029.18 | 865 | 846 | 161.1 |
| B | 5 | 255 | 347547 | 2151.45 | 865 | 846 | 161.1 |
| B | 4 | 171 | 79576 | 488.56 | 865 | 846 | 161.1 |
| C | 3 | 233 | 261425 | 1427.42 | 788 | 799 | 182.6 |
| C | 14 | 238 | 220966 | 1205.83 | 788 | 799 | 182.6 |
| C | 0 | 10 | 210962 | 1151.04 | 788 | 799 | 182.6 |
| D | 8 | 195 | 1704590 | 9060.97 | 794 | 779 | 188.0 |
| D | 12 | 218 | 543406 | 2885.72 | 794 | 779 | 188.0 |
| D | 1 | 52 | 93651 | 493.9 | 794 | 779 | 188.0 |
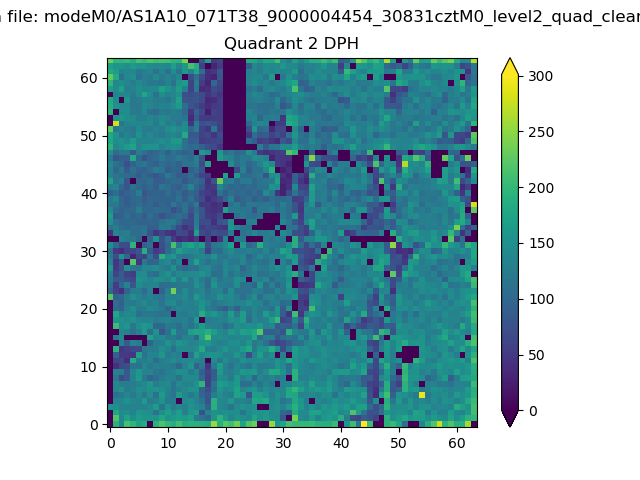
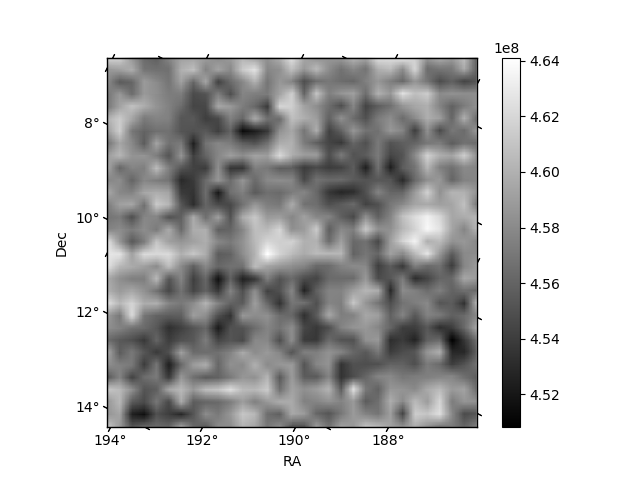
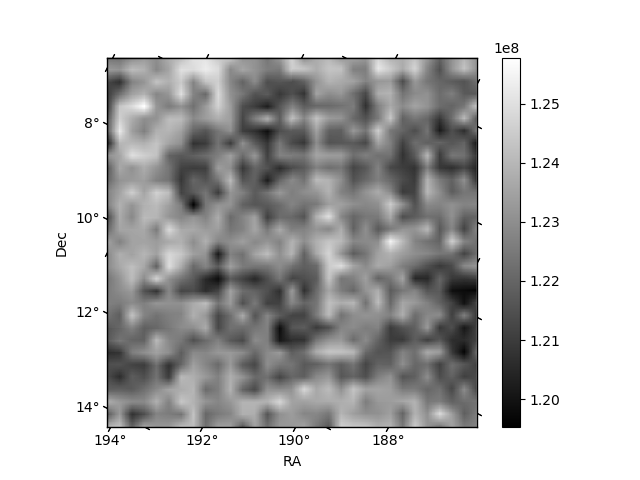
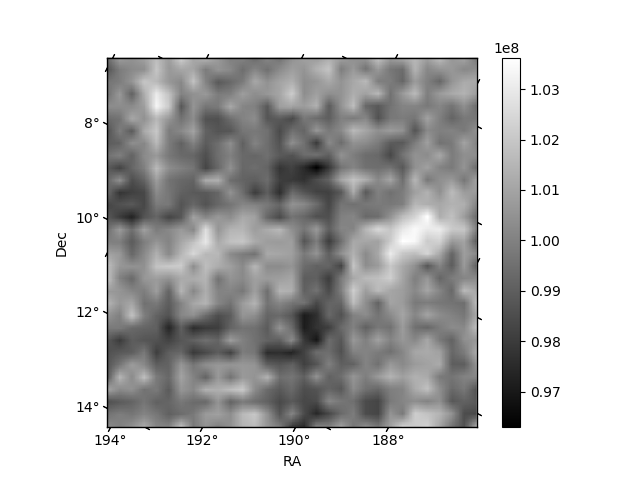
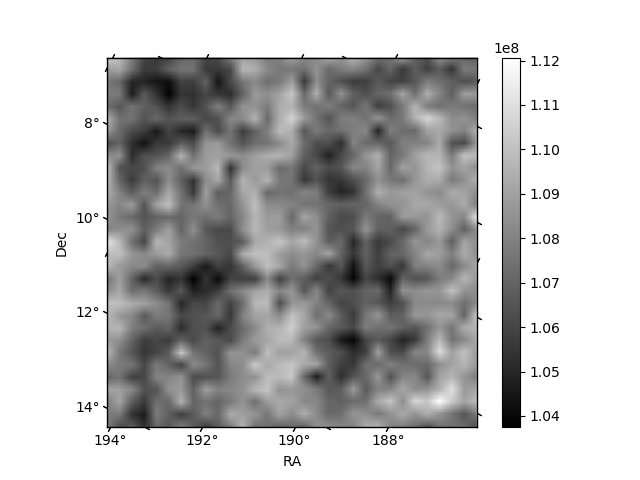
Histogram calculated using DETX and DETY for each event in the final _common_clean file
| Quadrant A | 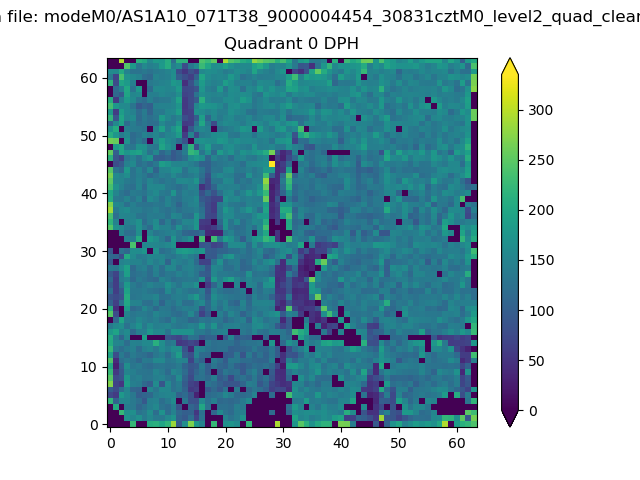 |
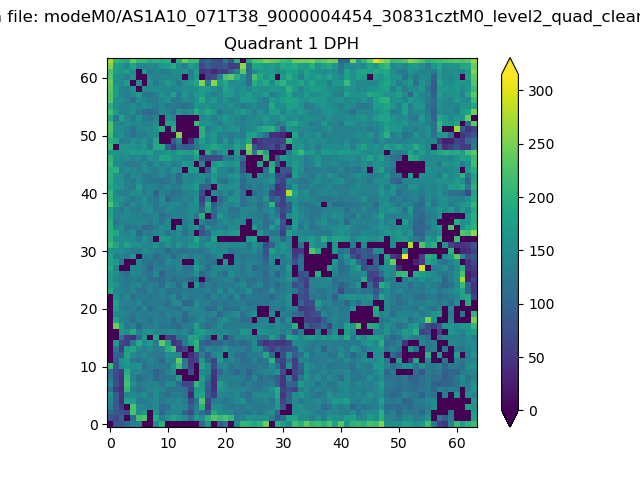 |
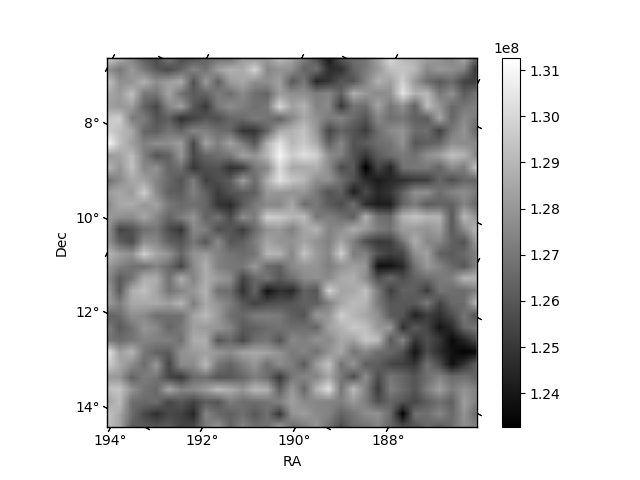
Quadrant B |
|---|---|---|---|
| Quadrant D | 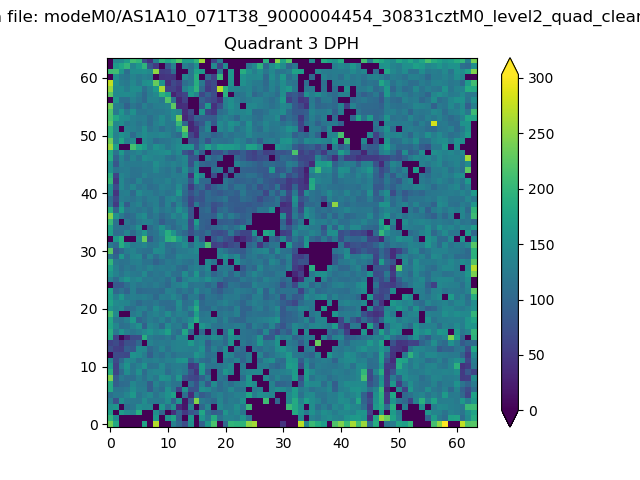 |
 |
Quadrant C |
| Plot type | Count rate plots | Images |
|---|---|---|
| Comparison with Poisson distribution Blue bars denote a histogram of data divided into 1 sec bins. Red curve is a Poisson curve with rate = median count rate of data. |
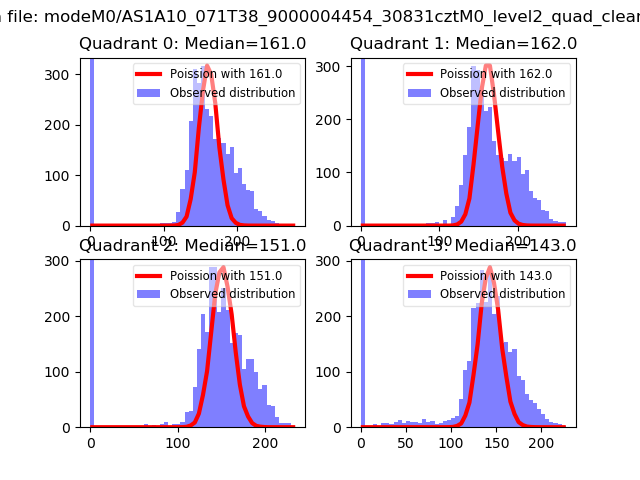 |
 |
| Quadrant-wise count rates Data is divided into 100 sec bins |
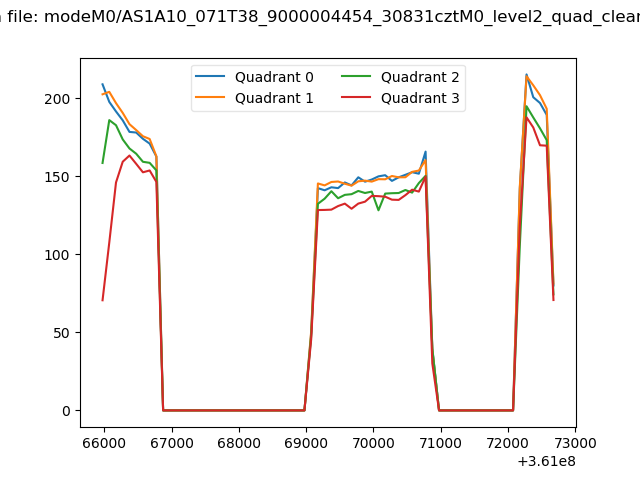 |
|
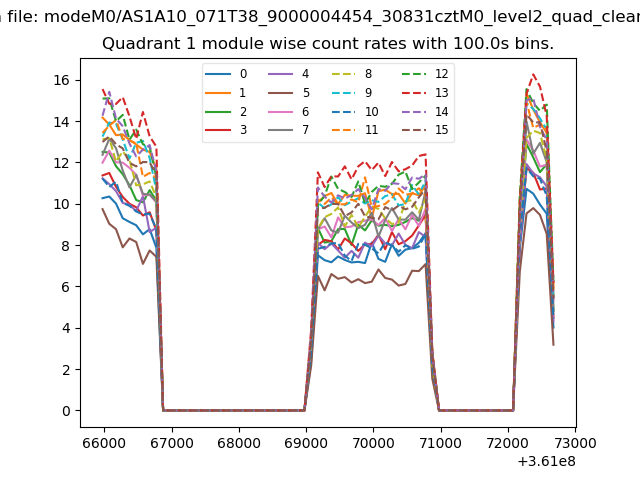
| Module-wise count rates for Quadrant A Data is divided into 100 sec bins |
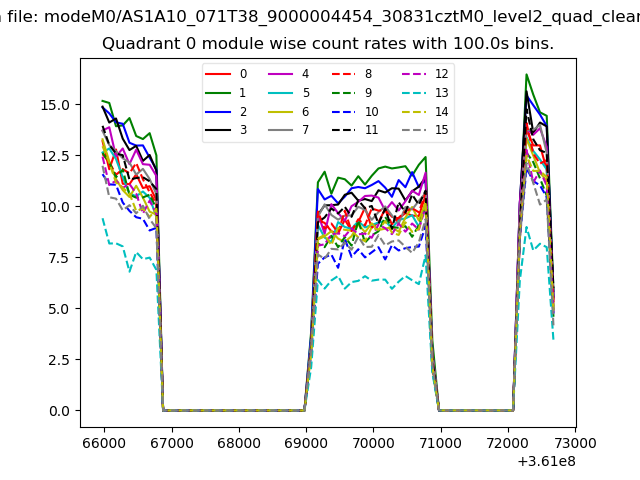 |
 |
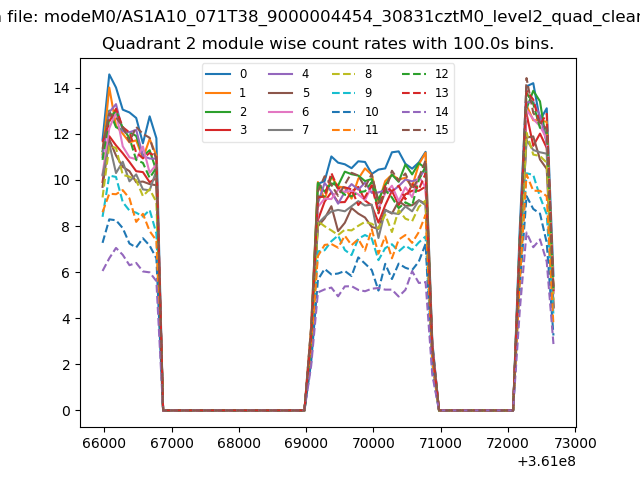
| Module-wise count rates for Quadrant B Data is divided into 100 sec bins |
 |
 |
| Module-wise count rates for Quadrant C Data is divided into 100 sec bins |
 |
 |
| Module-wise count rates for Quadrant D Data is divided into 100 sec bins |
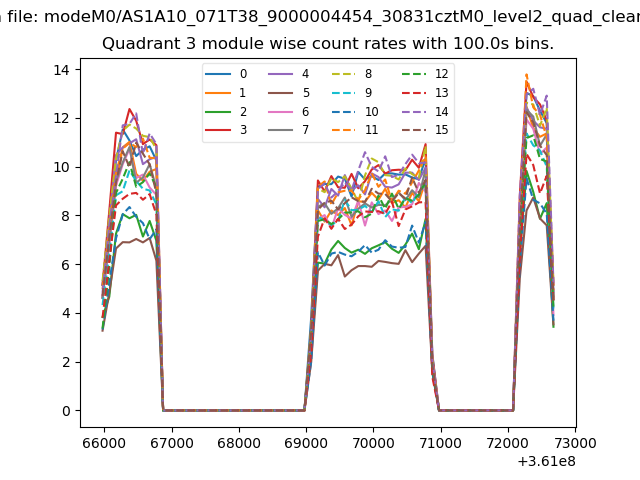 |
 |
| Parameter | Plot |
|---|---|
| CZT HV Monitor | 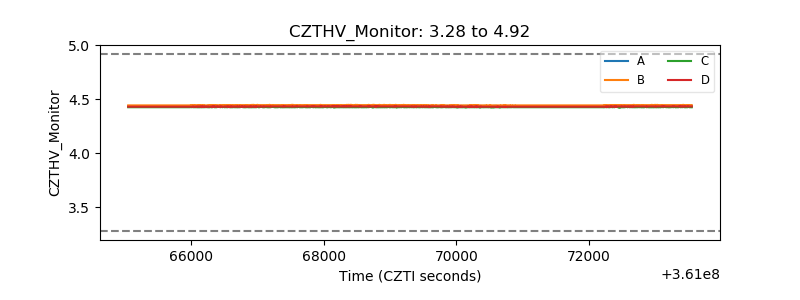 |
| D_VDD |  |
| Temperature 1 | 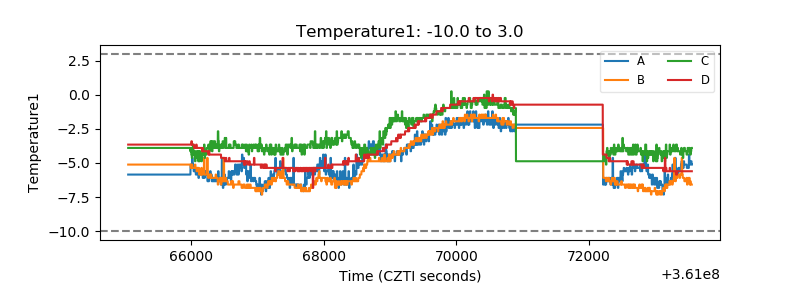 |
| Veto HV Monitor | 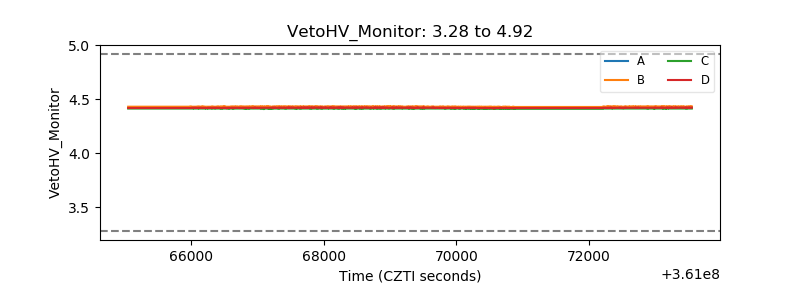 |
| Veto LLD | 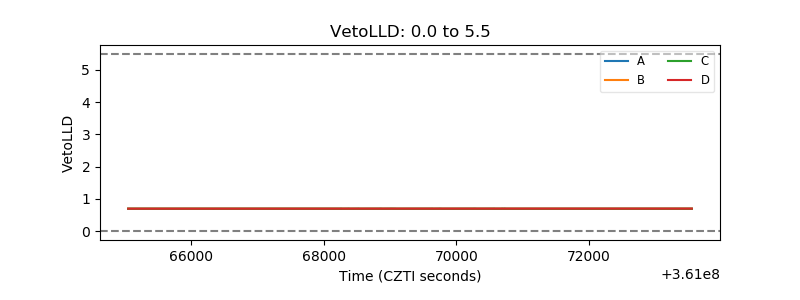 |
| Alpha Counter | 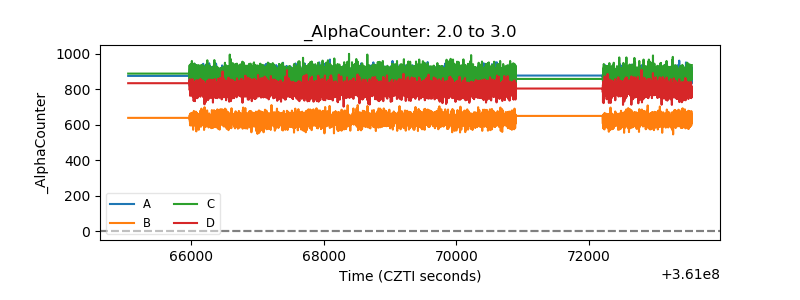 |
| _CPM_Rate | 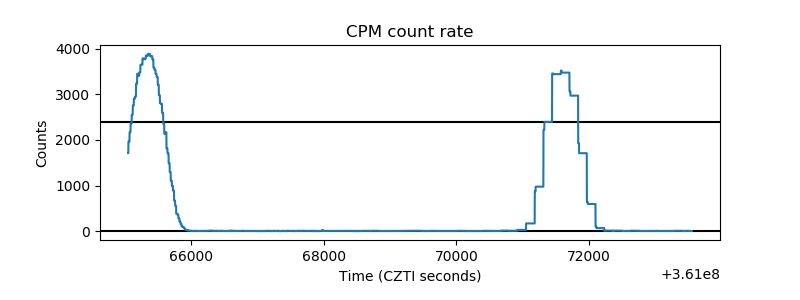 |
| CZT Counter | 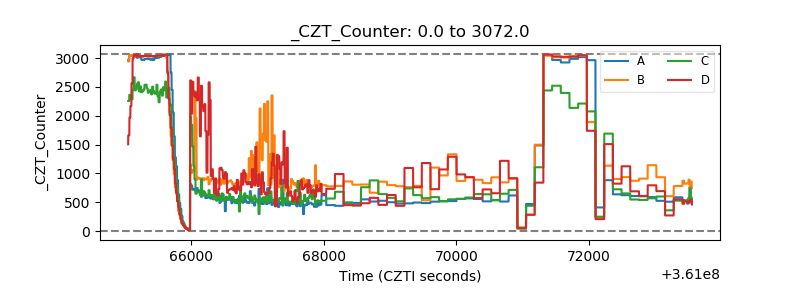 |
| +2.5 Volts monitor |  |
| +5 Volts monitor | 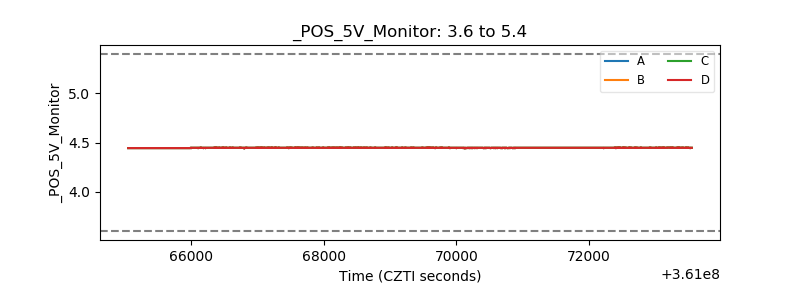 |
| _ROLL_ROT | 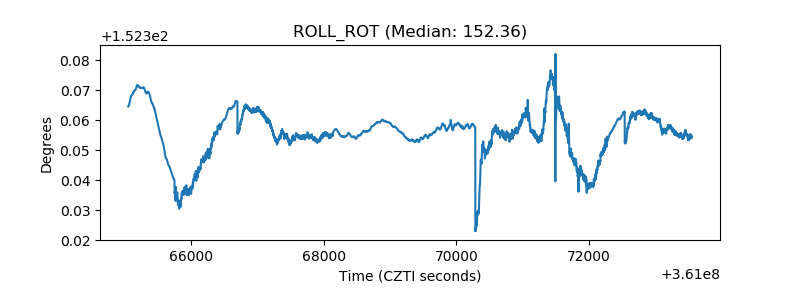 |
| _Roll_DEC | 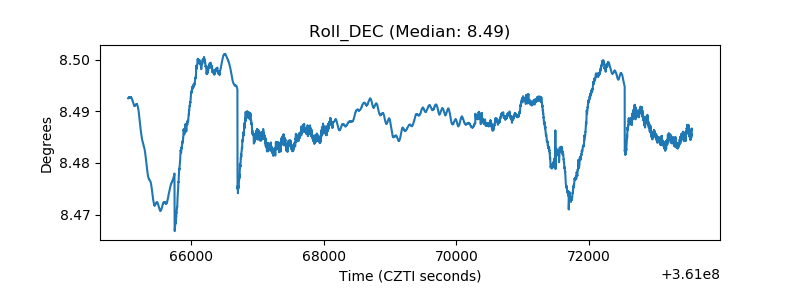 |
| _Roll_RA | 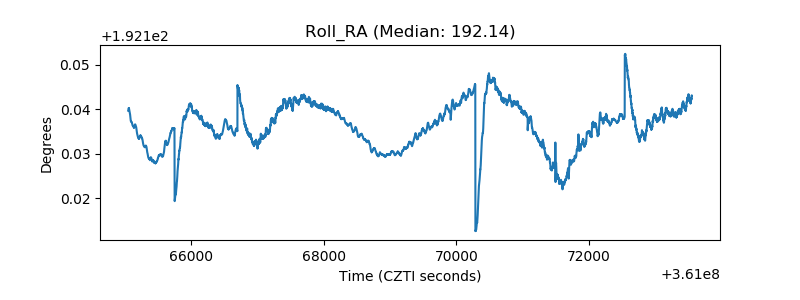 |
| Veto Counter | 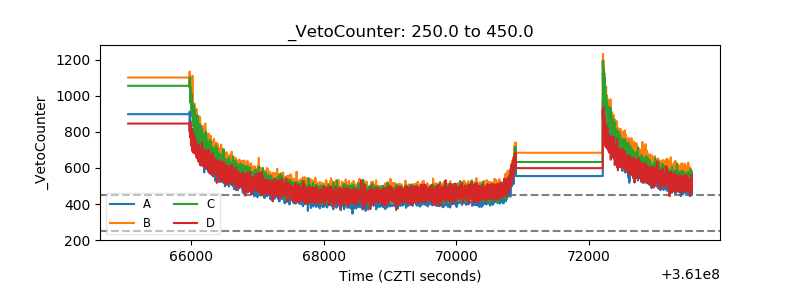 |