| Param | Original file | Final file |
|---|---|---|
| Filename | modeM0/AS1A10_071T38_9000004454_30833cztM0_level2.evt | modeM0/AS1A10_071T38_9000004454_30833cztM0_level2_quad_clean.evt |
| Size (bytes) | 583,168,320 | 63,898,560 |
| Size | 556.2 MB | 60.9 MB |
| Events in quadrant A | 3,324,474 | 390,763 |
| Events in quadrant B | 5,532,523 | 387,872 |
| Events in quadrant C | 3,468,105 | 365,698 |
| Events in quadrant D | 4,914,596 | 354,867 |
| Mode M9 | |||
|---|---|---|---|
| Quadrant | BADHDUFLAG | Total packets | Discarded packets |
| A | 0 | 13 | 0 |
| B | 0 | 13 | 0 |
| C | 0 | 13 | 0 |
| D | 0 | 13 | 0 |
| Mode M0 | |||
|---|---|---|---|
| Quadrant | BADHDUFLAG | Total packets | Discarded packets |
| A | 0 | 13194 | 1 |
| B | 0 | 20430 | 3 |
| C | 0 | 13705 | 1 |
| D | 0 | 18864 | 1 |
| Mode SS | |||
|---|---|---|---|
| Quadrant | BADHDUFLAG | Total packets | Discarded packets |
| A | 0 | 126 | 0 |
| B | 0 | 126 | 0 |
| C | 0 | 126 | 0 |
| D | 0 | 126 | 0 |
| Quadrant | Total seconds | Saturated seconds | Saturation percentage |
|---|---|---|---|
| A | 6240 | 45 | 0.721154% |
| B | 6240 | 287 | 4.599359% |
| C | 6240 | 136 | 2.179487% |
| D | 6240 | 163 | 2.612179% |
Noise dominated data is calculated using 1-second bins in cleaned event files. If a bin has >2000 counts, and if more than 50% of those come from <1% of pixels, then it is considered to be noise-dominated and hence unusable.
| Quadrant | # 1 sec bins | Bins with >0 counts | Bins with >2000 counts | High rate bins dominated by noise | Noise dominated (total time) | Noise dominated (detector-on time) | Marked lightcurve |
|---|---|---|---|---|---|---|---|
| A | 7500 | 6240 | 0 | 0 | 0.00% | 0.00% |  |
| B | 7500 | 6240 | 141 | 141 | 1.88% | 2.26% | 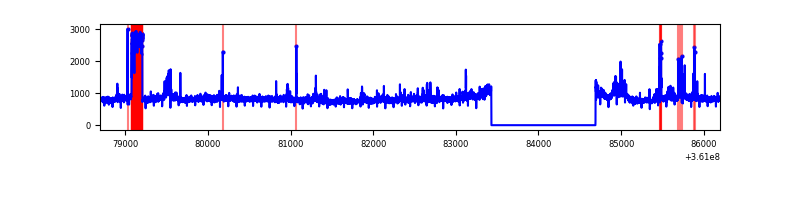 |
| C | 7500 | 6240 | 18 | 18 | 0.24% | 0.29% | 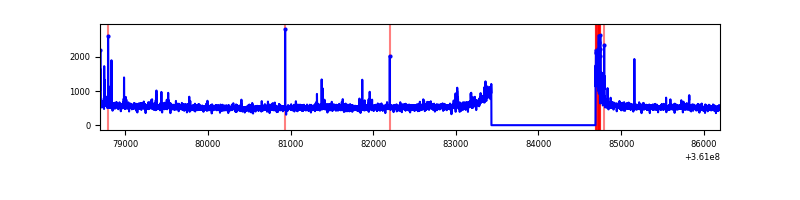 |
| D | 7500 | 6240 | 91 | 91 | 1.21% | 1.46% | 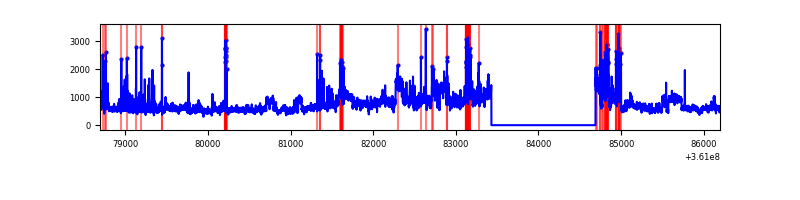 |
Top three noisy pixels from each quadrant. If the there are fewer than three noisy pixels in the level2.evt file, extra rows are filled as -1
| Pixel properties | Quadrant properties | ||||||
|---|---|---|---|---|---|---|---|
| Quadrant | DetID | PixID | Counts | Sigma | Mean | Median | Sigma |
| A | 13 | 254 | 12312 | 67.19 | 859 | 844 | 170.7 |
| A | 15 | 192 | 9321 | 49.66 | 859 | 844 | 170.7 |
| A | 3 | 137 | 7677 | 40.03 | 859 | 844 | 170.7 |
| B | 6 | 159 | 1663242 | 10581.45 | 833 | 814 | 157.1 |
| B | 0 | 229 | 326496 | 2072.98 | 833 | 814 | 157.1 |
| B | 6 | 36 | 108627 | 686.24 | 833 | 814 | 157.1 |
| C | 14 | 238 | 131085 | 697.44 | 801 | 807 | 186.8 |
| C | 0 | 10 | 126165 | 671.11 | 801 | 807 | 186.8 |
| C | 3 | 233 | 51929 | 273.68 | 801 | 807 | 186.8 |
| D | 8 | 195 | 1343678 | 7086.84 | 803 | 787 | 189.5 |
| D | 12 | 218 | 183672 | 965.14 | 803 | 787 | 189.5 |
| D | 1 | 52 | 112886 | 591.58 | 803 | 787 | 189.5 |
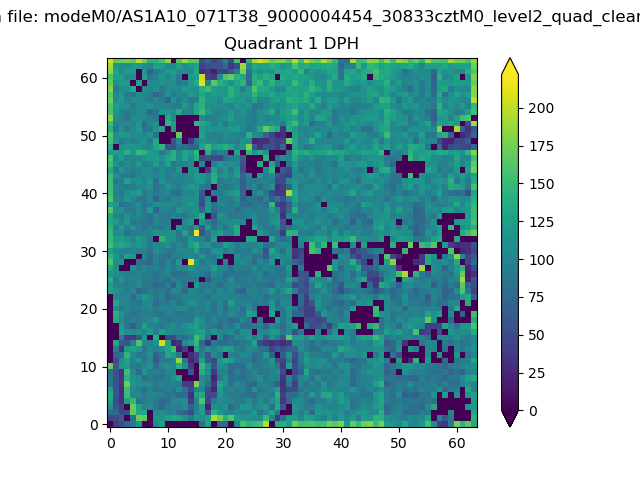
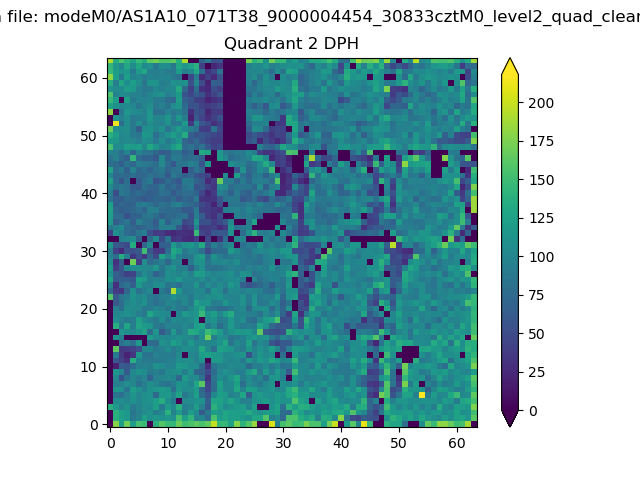
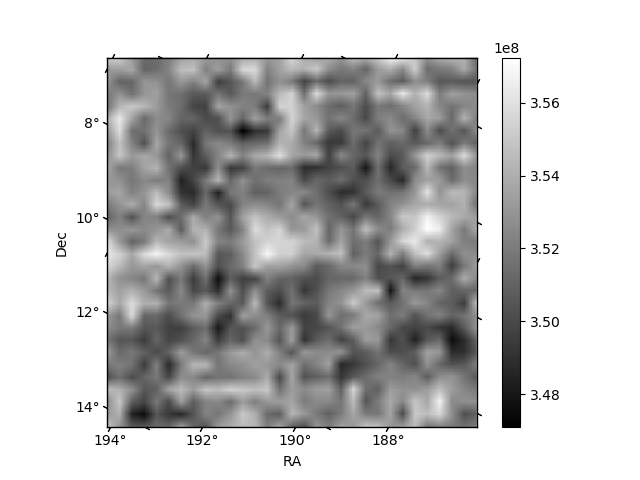
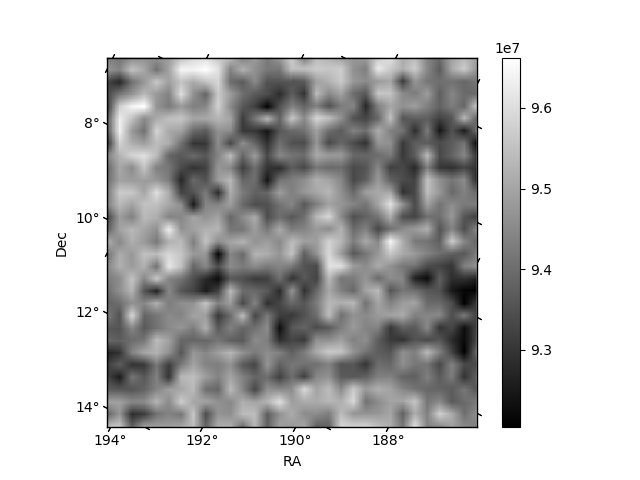
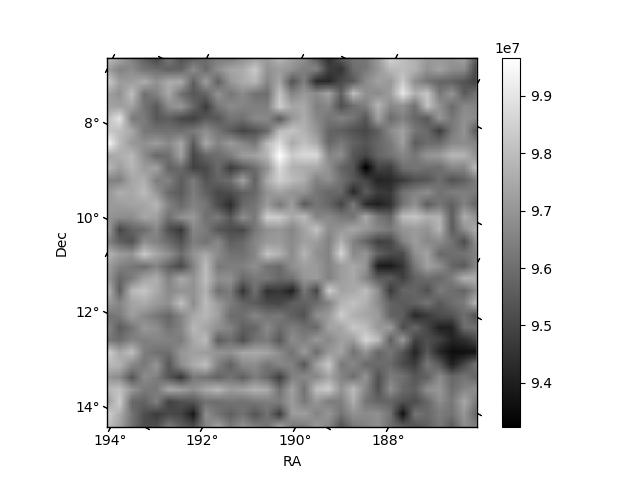
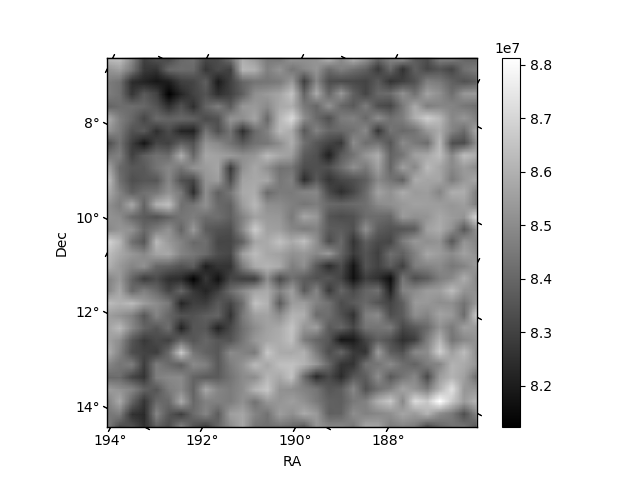
Histogram calculated using DETX and DETY for each event in the final _common_clean file
| Quadrant A | 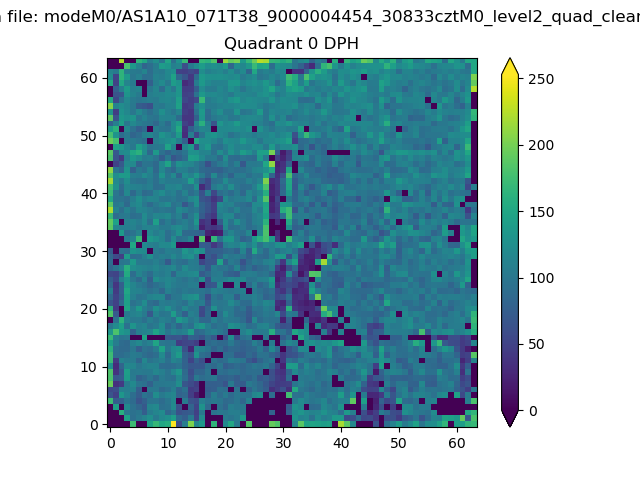 |
 |
Quadrant B |
|---|---|---|---|
| Quadrant D | 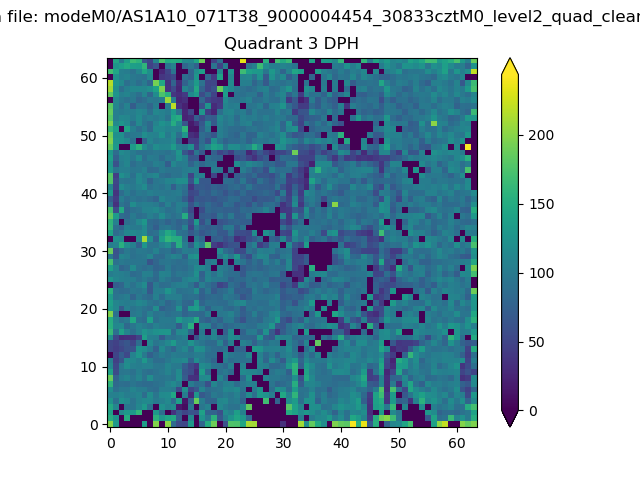 |
 |
Quadrant C |
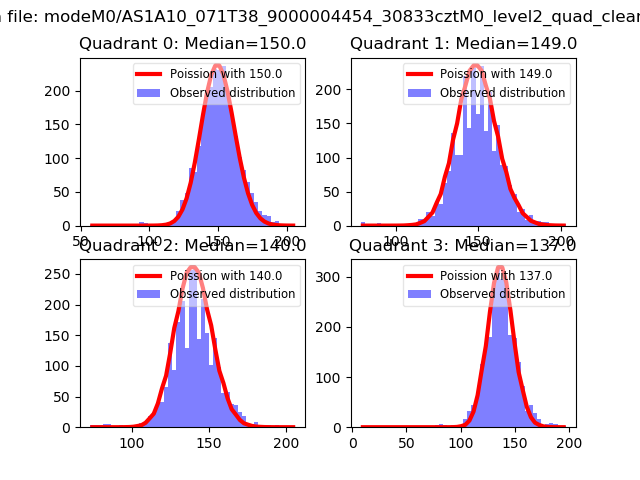
| Plot type | Count rate plots | Images |
|---|---|---|
| Comparison with Poisson distribution Blue bars denote a histogram of data divided into 1 sec bins. Red curve is a Poisson curve with rate = median count rate of data. |
 |
 |
| Quadrant-wise count rates Data is divided into 100 sec bins |
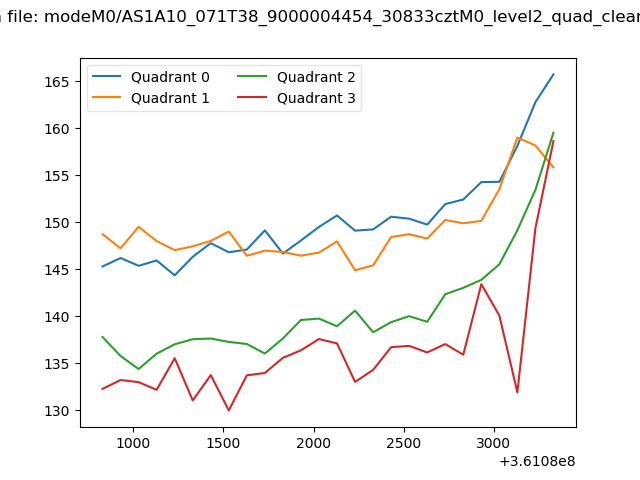 |
|
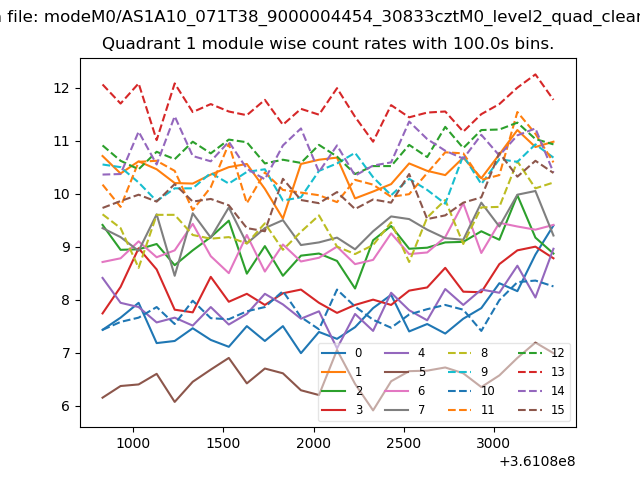
| Module-wise count rates for Quadrant A Data is divided into 100 sec bins |
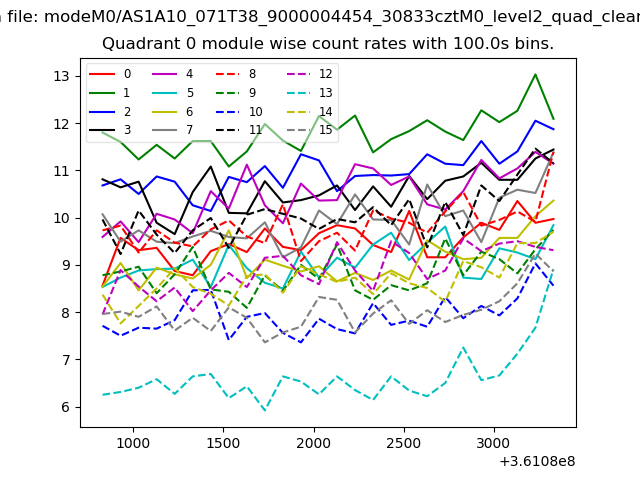 |
 |
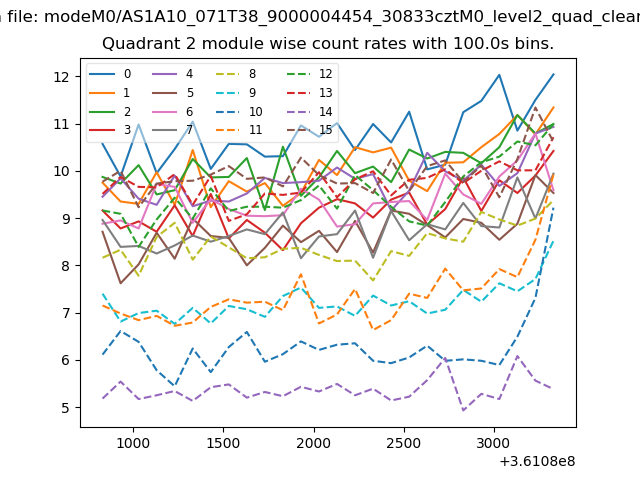
| Module-wise count rates for Quadrant B Data is divided into 100 sec bins |
 |
 |
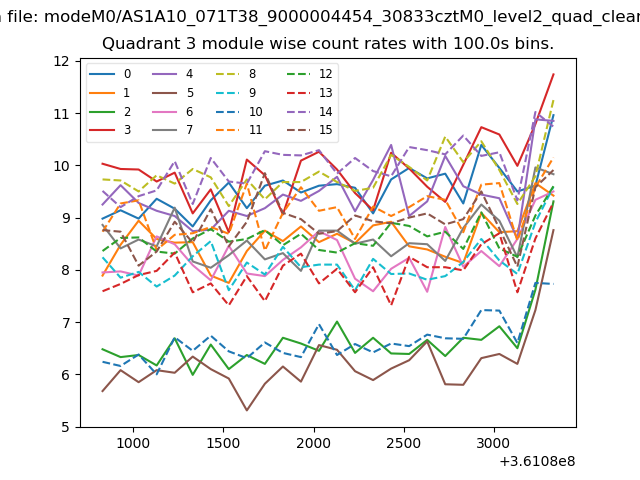
| Module-wise count rates for Quadrant C Data is divided into 100 sec bins |
 |
 |
| Module-wise count rates for Quadrant D Data is divided into 100 sec bins |
 |
 |
| Parameter | Plot |
|---|---|
| CZT HV Monitor | 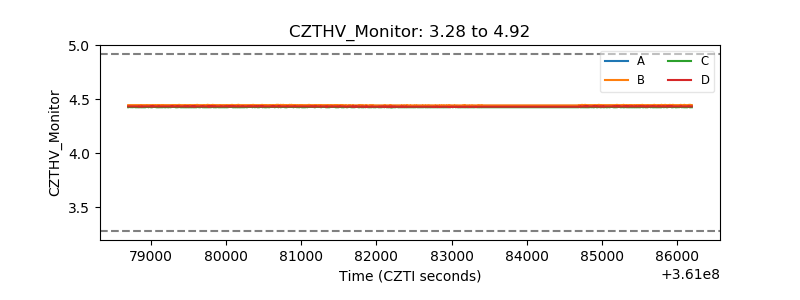 |
| D_VDD | 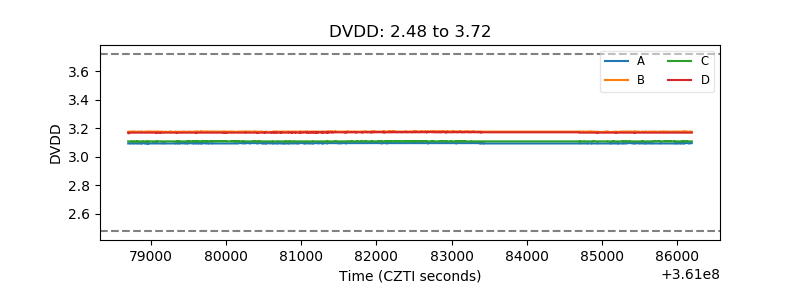 |
| Temperature 1 | 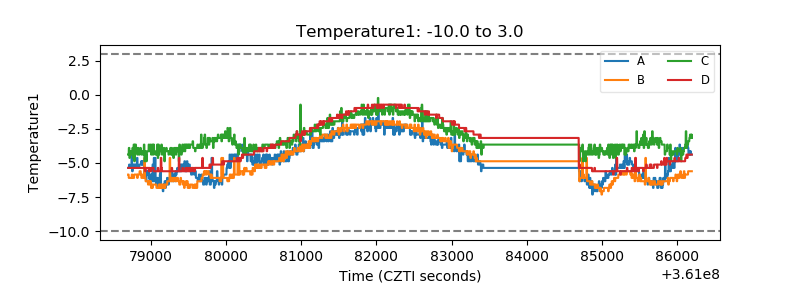 |
| Veto HV Monitor |  |
| Veto LLD | 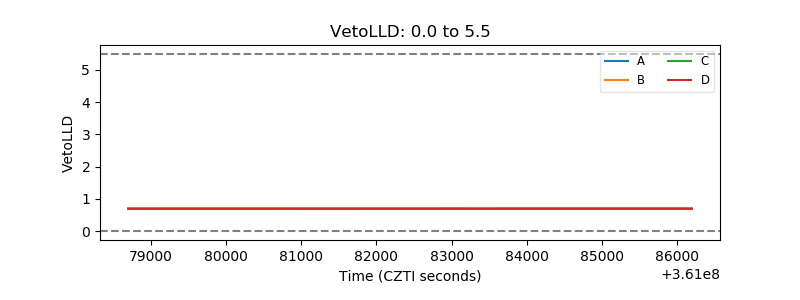 |
| Alpha Counter | 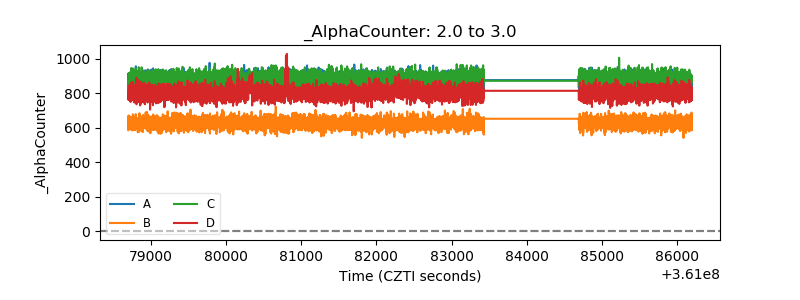 |
| _CPM_Rate | 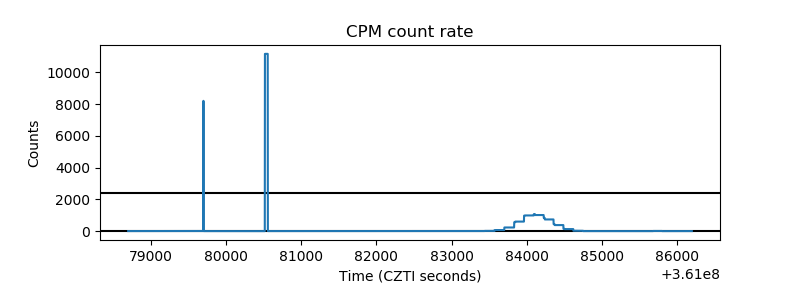 |
| CZT Counter | 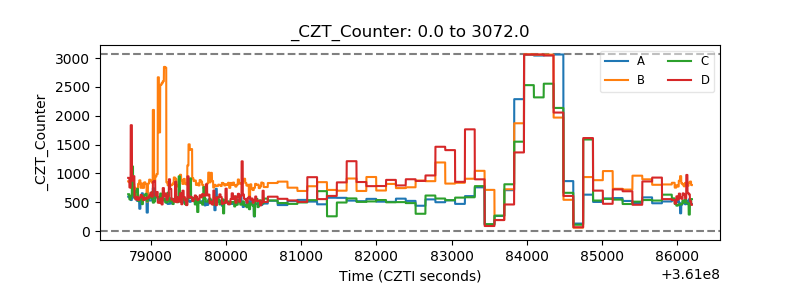 |
| +2.5 Volts monitor |  |
| +5 Volts monitor | 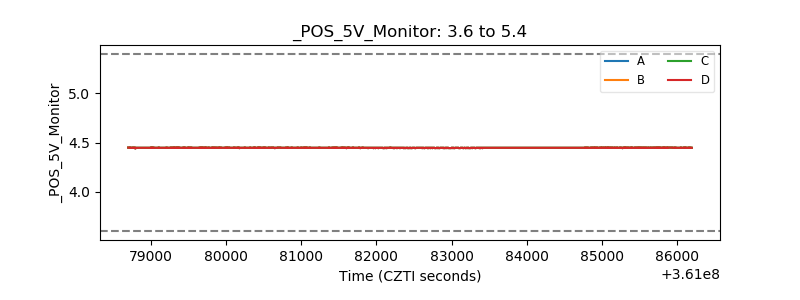 |
| _ROLL_ROT | 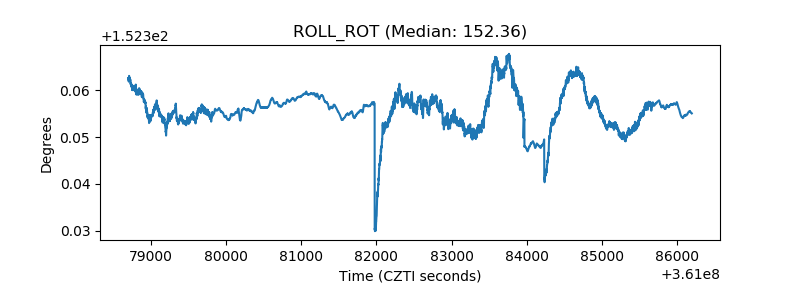 |
| _Roll_DEC | 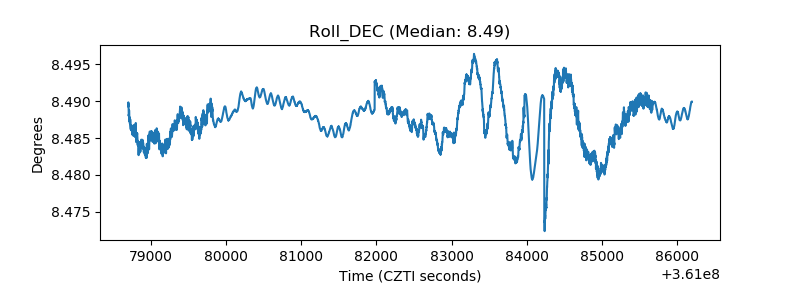 |
| _Roll_RA | 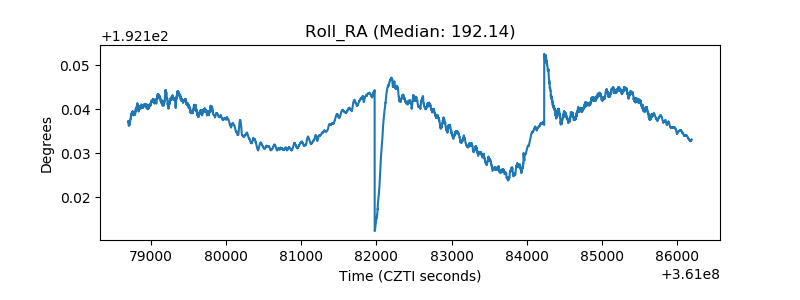 |
| Veto Counter | 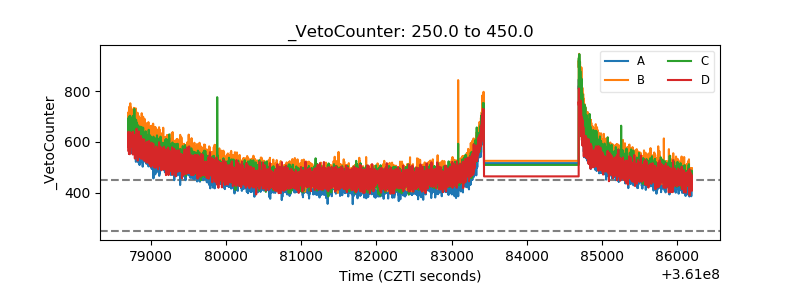 |