| Param | Original file | Final file |
|---|---|---|
| Filename | modeM0/AS1A10_071T38_9000004454_30834cztM0_level2.evt | modeM0/AS1A10_071T38_9000004454_30834cztM0_level2_quad_clean.evt |
| Size (bytes) | 640,742,400 | 74,767,680 |
| Size | 611.1 MB | 71.3 MB |
| Events in quadrant A | 3,497,805 | 468,397 |
| Events in quadrant B | 6,205,468 | 452,946 |
| Events in quadrant C | 3,730,776 | 441,318 |
| Events in quadrant D | 5,513,421 | 429,202 |
| Mode M9 | |||
|---|---|---|---|
| Quadrant | BADHDUFLAG | Total packets | Discarded packets |
| A | 0 | 11 | 0 |
| B | 0 | 12 | 0 |
| C | 0 | 12 | 0 |
| D | 0 | 12 | 0 |
| Mode M0 | |||
|---|---|---|---|
| Quadrant | BADHDUFLAG | Total packets | Discarded packets |
| A | 0 | 14177 | 2 |
| B | 0 | 22923 | 2 |
| C | 0 | 14836 | 2 |
| D | 0 | 21169 | 2 |
| Mode SS | |||
|---|---|---|---|
| Quadrant | BADHDUFLAG | Total packets | Discarded packets |
| A | 0 | 138 | 0 |
| B | 0 | 138 | 0 |
| C | 0 | 138 | 0 |
| D | 0 | 138 | 0 |
| Quadrant | Total seconds | Saturated seconds | Saturation percentage |
|---|---|---|---|
| A | 6769 | 93 | 1.373910% |
| B | 6769 | 395 | 5.835426% |
| C | 6769 | 189 | 2.792141% |
| D | 6769 | 158 | 2.334170% |
Noise dominated data is calculated using 1-second bins in cleaned event files. If a bin has >2000 counts, and if more than 50% of those come from <1% of pixels, then it is considered to be noise-dominated and hence unusable.
| Quadrant | # 1 sec bins | Bins with >0 counts | Bins with >2000 counts | High rate bins dominated by noise | Noise dominated (total time) | Noise dominated (detector-on time) | Marked lightcurve |
|---|---|---|---|---|---|---|---|
| A | 7764 | 6769 | 0 | 0 | 0.00% | 0.00% | 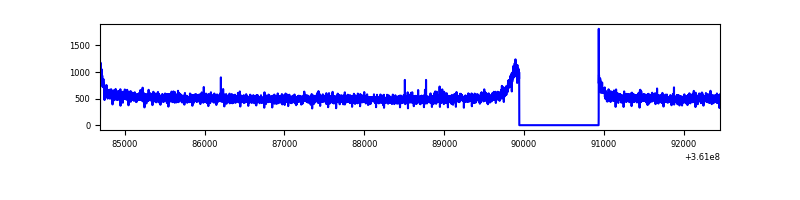 |
| B | 7764 | 6769 | 161 | 161 | 2.07% | 2.38% | 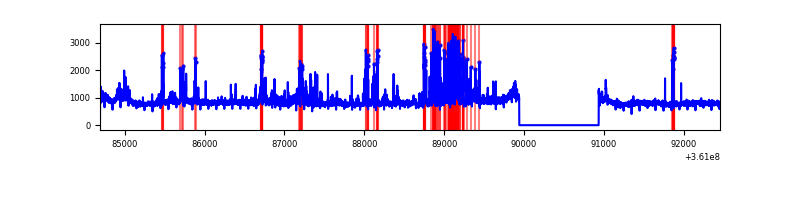 |
| C | 7764 | 6769 | 23 | 23 | 0.30% | 0.34% |  |
| D | 7764 | 6769 | 55 | 55 | 0.71% | 0.81% | 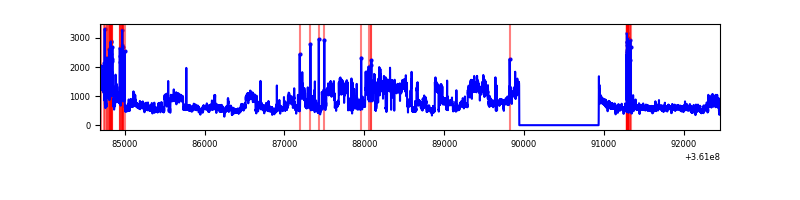 |
Top three noisy pixels from each quadrant. If the there are fewer than three noisy pixels in the level2.evt file, extra rows are filled as -1
| Pixel properties | Quadrant properties | ||||||
|---|---|---|---|---|---|---|---|
| Quadrant | DetID | PixID | Counts | Sigma | Mean | Median | Sigma |
| A | 13 | 254 | 12973 | 66.21 | 906 | 889 | 182.5 |
| A | 3 | 137 | 8783 | 43.25 | 906 | 889 | 182.5 |
| A | 0 | 226 | 7593 | 36.73 | 906 | 889 | 182.5 |
| B | 6 | 159 | 1811774 | 10812.87 | 879 | 859 | 167.5 |
| B | 6 | 36 | 734099 | 4378.13 | 879 | 859 | 167.5 |
| B | 5 | 255 | 87125 | 515.09 | 879 | 859 | 167.5 |
| C | 0 | 10 | 180732 | 905.11 | 847 | 853 | 198.7 |
| C | 14 | 238 | 138804 | 694.14 | 847 | 853 | 198.7 |
| C | 3 | 233 | 55355 | 274.24 | 847 | 853 | 198.7 |
| D | 8 | 195 | 1898098 | 9330.39 | 853 | 835 | 203.3 |
| D | 12 | 218 | 177744 | 870.01 | 853 | 835 | 203.3 |
| D | 1 | 52 | 113966 | 556.36 | 853 | 835 | 203.3 |
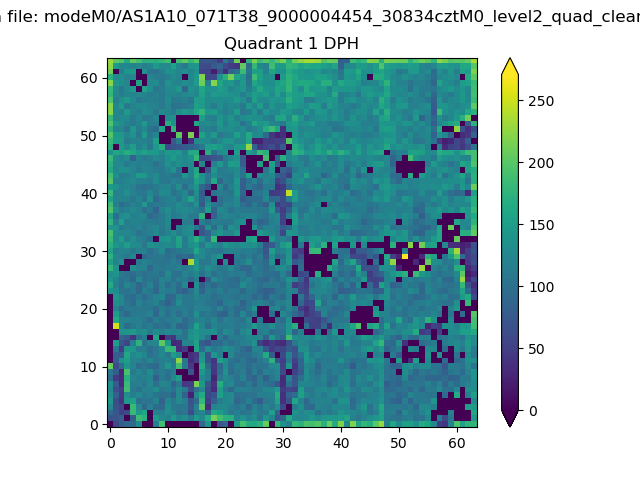
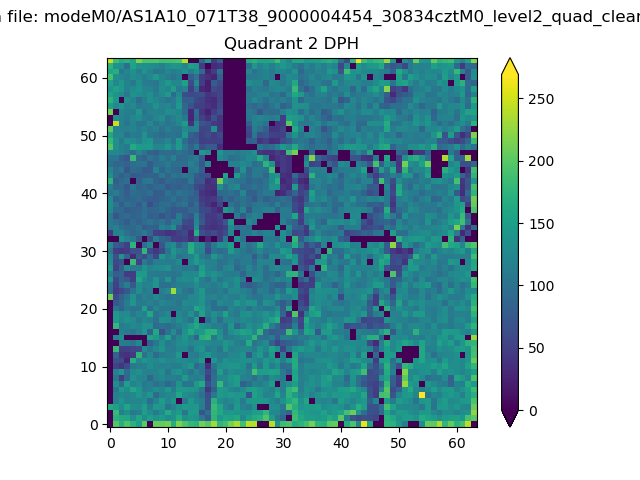
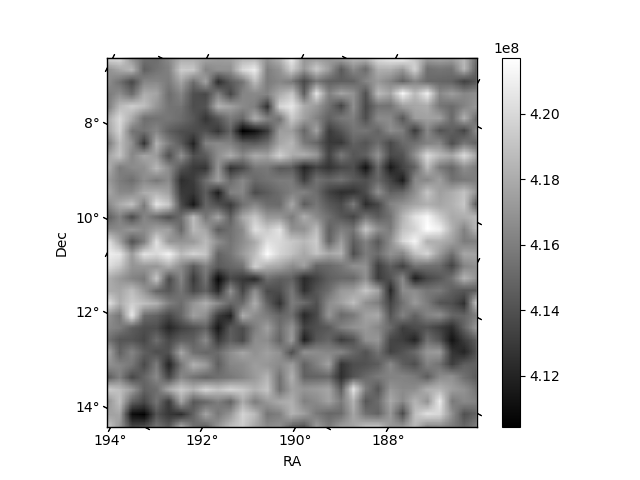
Histogram calculated using DETX and DETY for each event in the final _common_clean file
| Quadrant A | 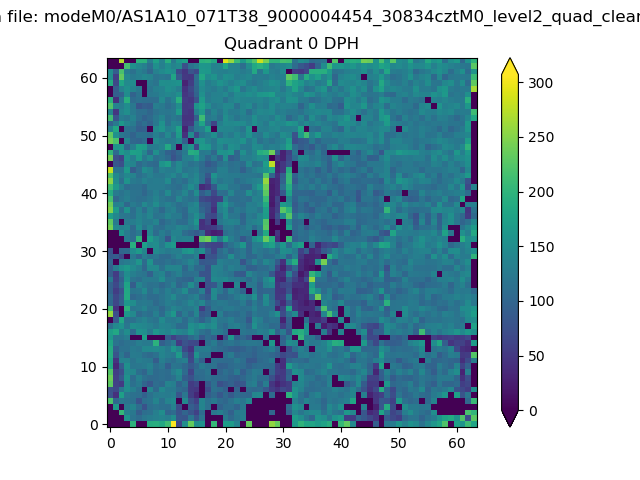 |
 |
Quadrant B |
|---|---|---|---|
| Quadrant D | 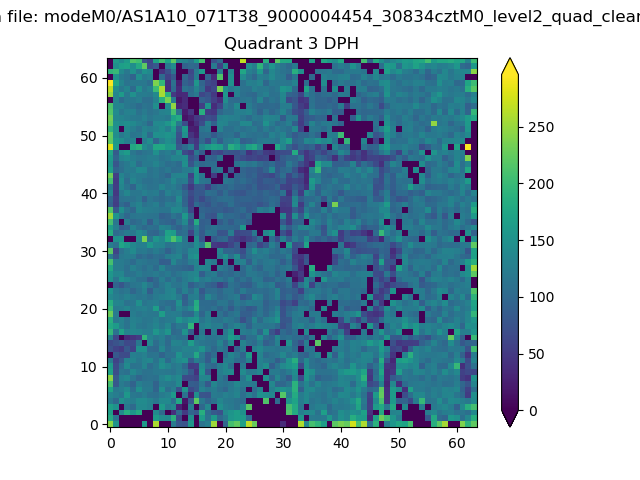 |
 |
Quadrant C |
| Plot type | Count rate plots | Images |
|---|---|---|
| Comparison with Poisson distribution Blue bars denote a histogram of data divided into 1 sec bins. Red curve is a Poisson curve with rate = median count rate of data. |
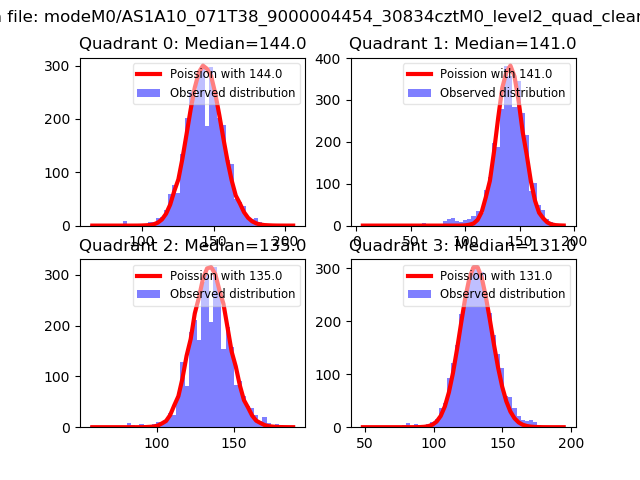 |
 |
| Quadrant-wise count rates Data is divided into 100 sec bins |
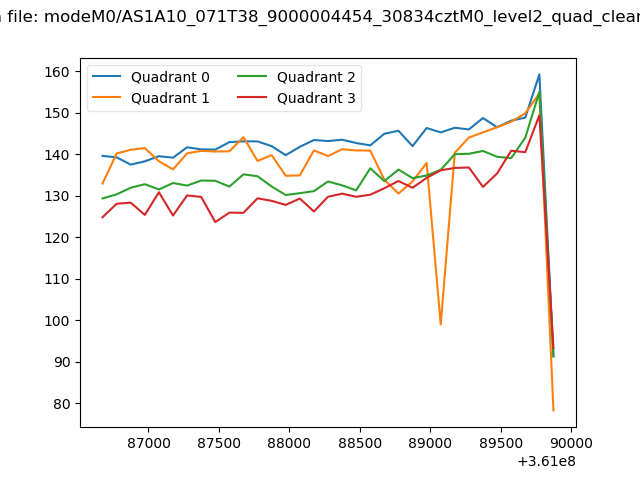 |
|
| Module-wise count rates for Quadrant A Data is divided into 100 sec bins |
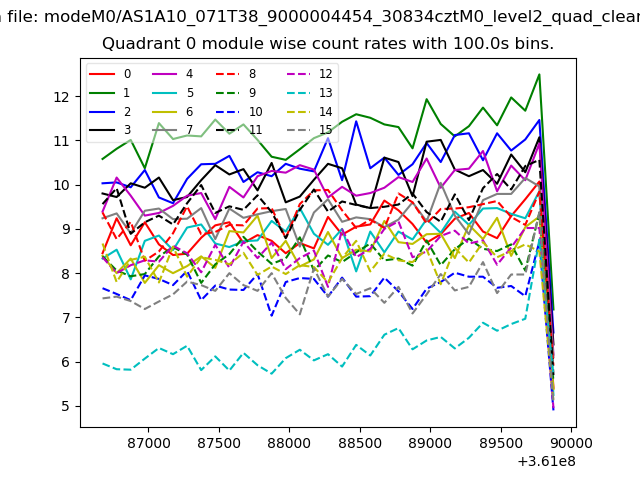 |
 |
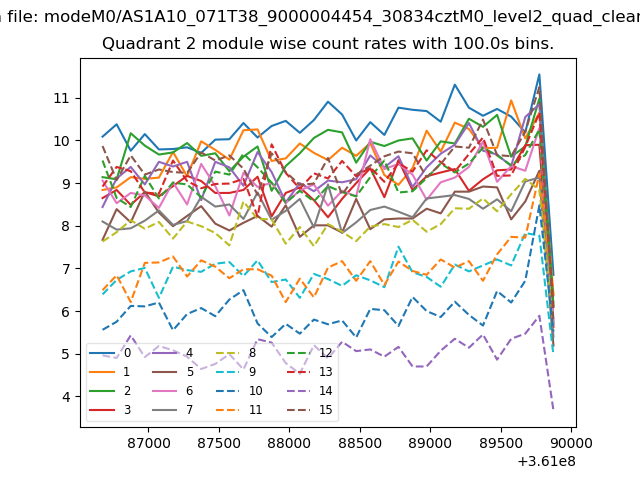
| Module-wise count rates for Quadrant B Data is divided into 100 sec bins |
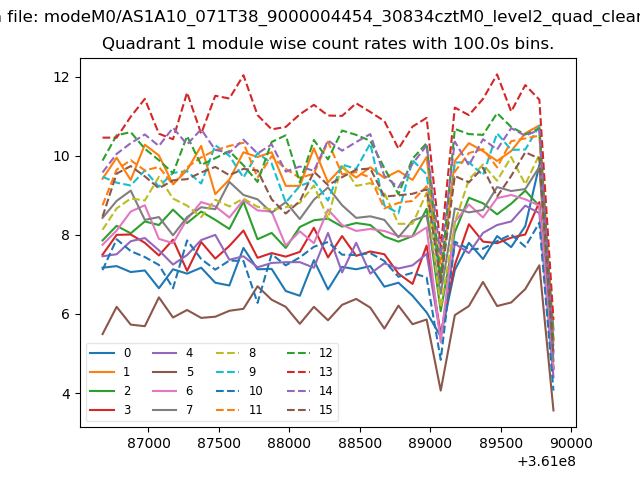 |
 |
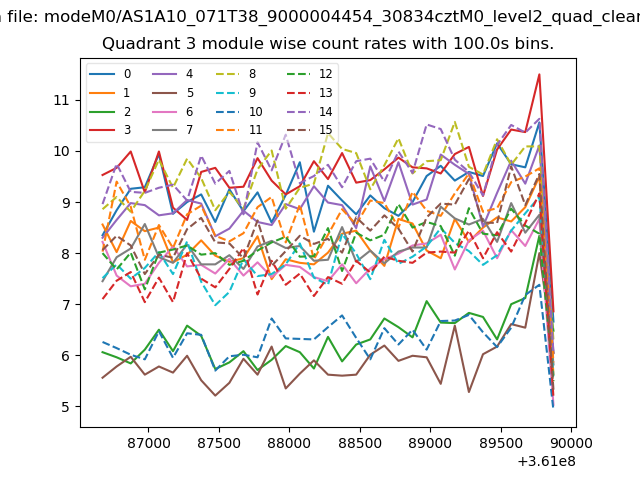
| Module-wise count rates for Quadrant C Data is divided into 100 sec bins |
 |
 |
| Module-wise count rates for Quadrant D Data is divided into 100 sec bins |
 |
 |
| Parameter | Plot |
|---|---|
| CZT HV Monitor | 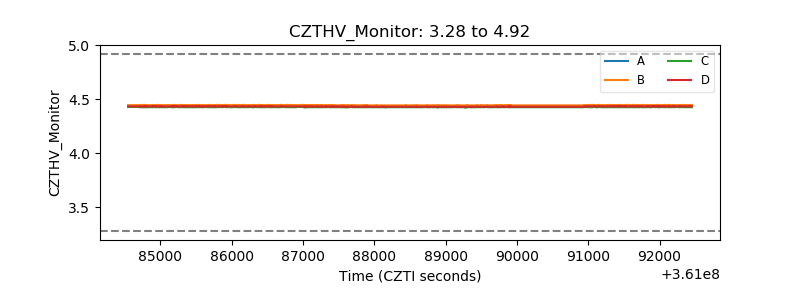 |
| D_VDD | 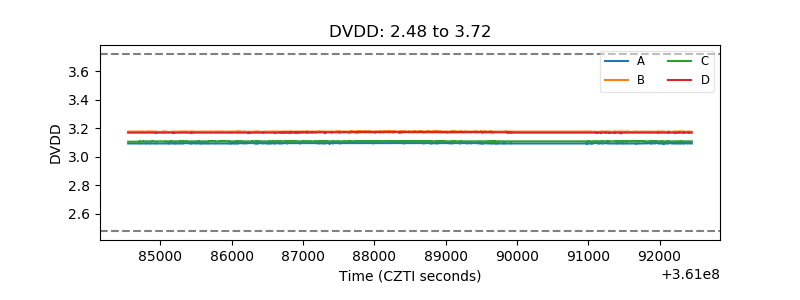 |
| Temperature 1 | 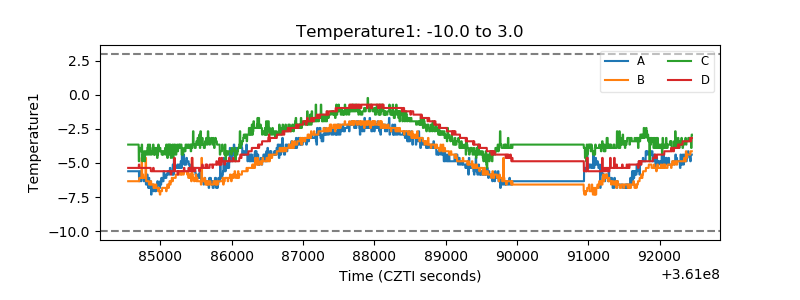 |
| Veto HV Monitor | 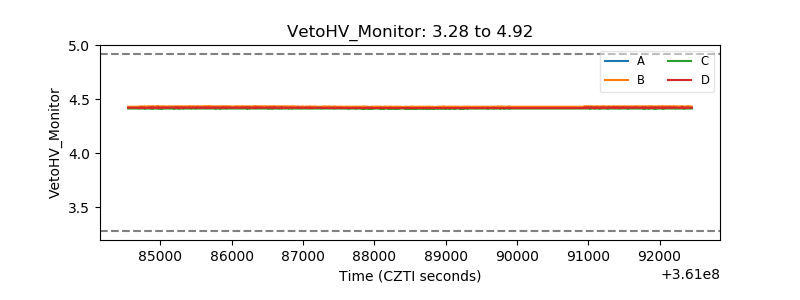 |
| Veto LLD | 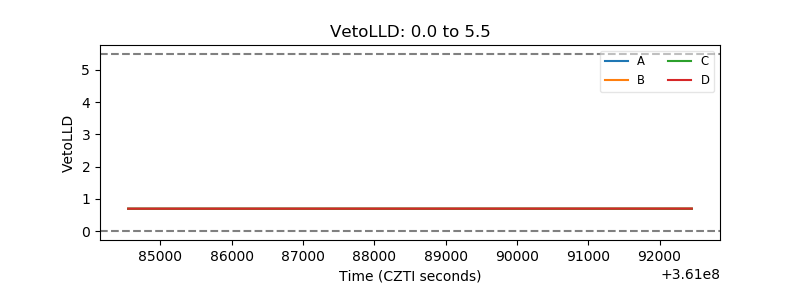 |
| Alpha Counter | 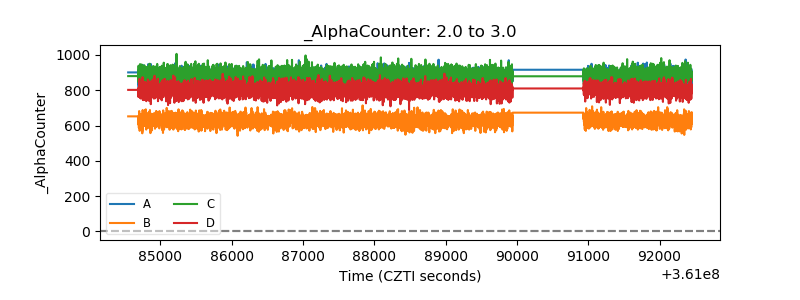 |
| _CPM_Rate | 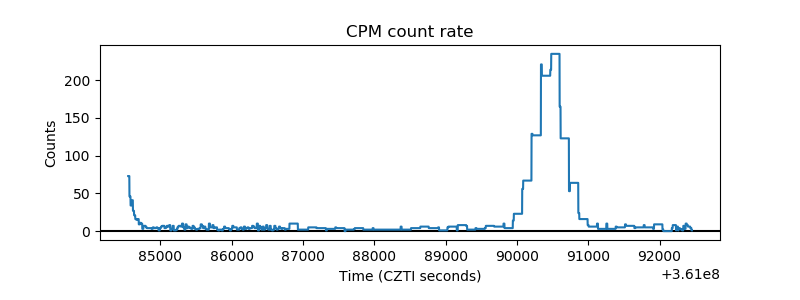 |
| CZT Counter | 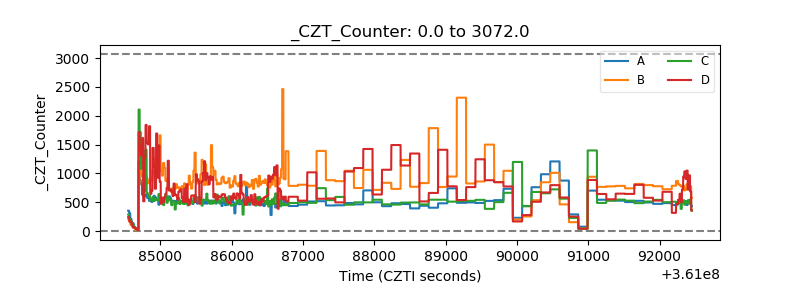 |
| +2.5 Volts monitor |  |
| +5 Volts monitor |  |
| _ROLL_ROT | 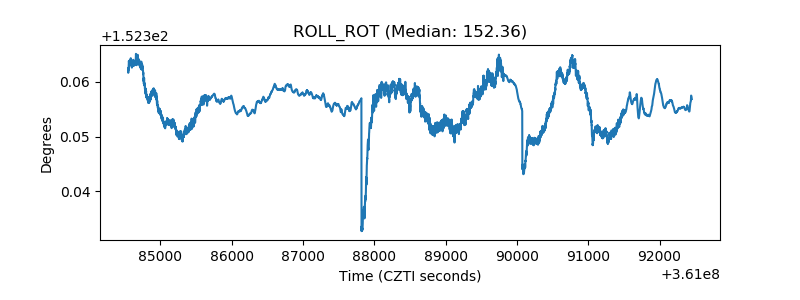 |
| _Roll_DEC | 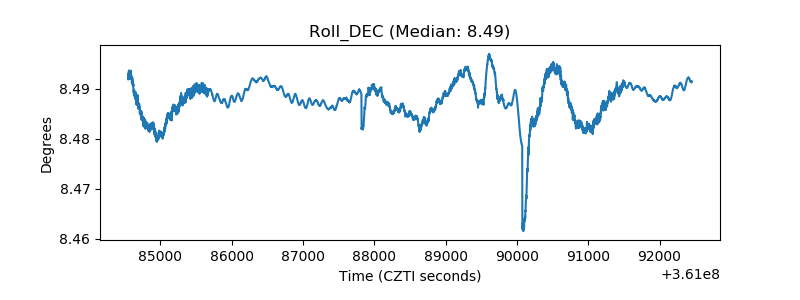 |
| _Roll_RA | 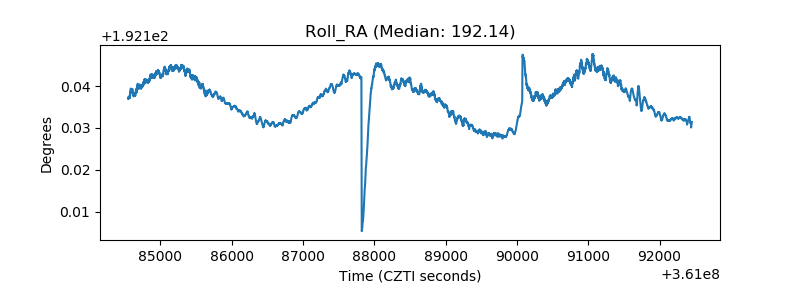 |
| Veto Counter | 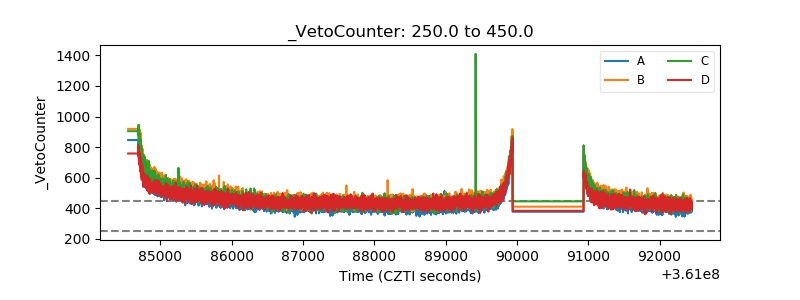 |