| Param | Original file | Final file |
|---|---|---|
| Filename | modeM0/AS1A10_071T40_9000004458cztM0_level2.fits | modeM0/AS1A10_071T40_9000004458cztM0_level2_quad_clean.evt |
| Size (bytes) | 733,893,120 | 559,932,480 |
| Size | 699.9 MB | 534.0 MB |
| Events in quadrant A | 4,736,148 | 3,287,847 |
| Events in quadrant B | 3,979,194 | 2,736,134 |
| Events in quadrant C | 4,461,686 | 3,036,826 |
| Events in quadrant D | 3,948,494 | 2,803,304 |
| Mode M0 | |||
|---|---|---|---|
| Quadrant | BADHDUFLAG | Total packets | Discarded packets |
| A | 0 | 155455 | 0 |
| B | 0 | 349812 | 0 |
| C | 0 | 164179 | 0 |
| D | 0 | 182998 | 0 |
| Mode SS | |||
|---|---|---|---|
| Quadrant | BADHDUFLAG | Total packets | Discarded packets |
| A | 0 | 1512 | 0 |
| B | 0 | 1512 | 0 |
| C | 0 | 1512 | 0 |
| D | 0 | 1512 | 0 |
| Mode M9 | |||
|---|---|---|---|
| Quadrant | BADHDUFLAG | Total packets | Discarded packets |
| A | 0 | 111 | 0 |
| B | 0 | 111 | 0 |
| C | 0 | 111 | 0 |
| D | 0 | 111 | 0 |
| Quadrant | Total seconds | Saturated seconds | Saturation percentage |
|---|---|---|---|
| A | 74230 | 1464 | 1.972248% |
| B | 74230 | 20680 | 27.859356% |
| C | 74230 | 2553 | 3.439310% |
| D | 74230 | 1766 | 2.379092% |
Noise dominated data is calculated using 1-second bins in cleaned event files. If a bin has >2000 counts, and if more than 50% of those come from <1% of pixels, then it is considered to be noise-dominated and hence unusable.
| Quadrant | # 1 sec bins | Bins with >0 counts | Bins with >2000 counts | High rate bins dominated by noise | Noise dominated (total time) | Noise dominated (detector-on time) | Marked lightcurve |
|---|---|---|---|---|---|---|---|
| A | 85375 | 74221 | 0 | 0 | 0.00% | 0.00% | 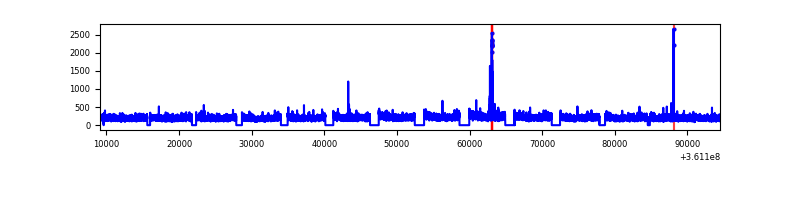 |
| B | 85375 | 74217 | 0 | 0 | 0.00% | 0.00% |  |
| C | 85375 | 74212 | 0 | 0 | 0.00% | 0.00% |  |
| D | 85375 | 74199 | 0 | 0 | 0.00% | 0.00% |  |
Top three noisy pixels from each quadrant. If the there are fewer than three noisy pixels in the level2.evt file, extra rows are filled as -1
| Pixel properties | Quadrant properties | ||||||
|---|---|---|---|---|---|---|---|
| Quadrant | DetID | PixID | Counts | Sigma | Mean | Median | Sigma |
| A | 0 | 29 | 4422 | 10.85 | 1232 | 1158 | 301.0 |
| A | 7 | 110 | 3659 | 8.31 | 1232 | 1158 | 301.0 |
| A | 9 | 19 | 3540 | 7.91 | 1232 | 1158 | 301.0 |
| B | 2 | 9 | 3189 | 10.6 | 1053 | 1006 | 206.0 |
| B | 5 | 128 | 2646 | 7.96 | 1053 | 1006 | 206.0 |
| B | 2 | 8 | 2628 | 7.87 | 1053 | 1006 | 206.0 |
| C | 12 | 241 | 3142 | 6.82 | 1180 | 1099 | 299.6 |
| C | 9 | 209 | 3017 | 6.4 | 1180 | 1099 | 299.6 |
| C | 7 | 111 | 3005 | 6.36 | 1180 | 1099 | 299.6 |
| D | 7 | 3 | 2809 | 5.99 | 1126 | 1021 | 298.7 |
| D | 10 | 189 | 2774 | 5.87 | 1126 | 1021 | 298.7 |
| D | 15 | 47 | 2751 | 5.79 | 1126 | 1021 | 298.7 |
Histogram calculated using DETX and DETY for each event in the final _common_clean file
| Quadrant A |  |
 |
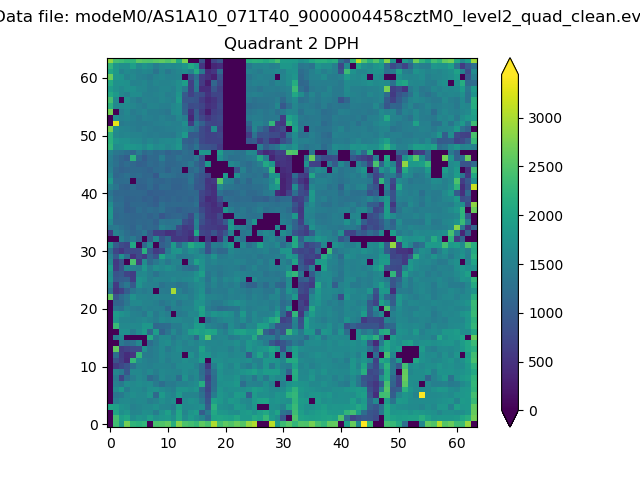
Quadrant B |
|---|---|---|---|
| Quadrant D |  |
 |
Quadrant C |
| Plot type | Count rate plots | Images |
|---|---|---|
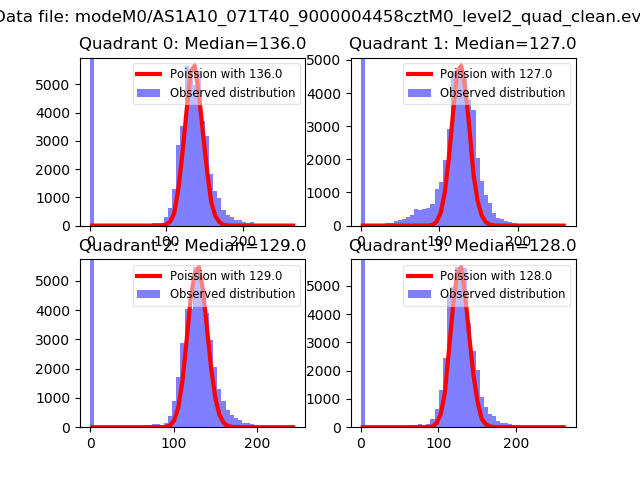
| Comparison with Poisson distribution Blue bars denote a histogram of data divided into 1 sec bins. Red curve is a Poisson curve with rate = median count rate of data. |
 |
 |
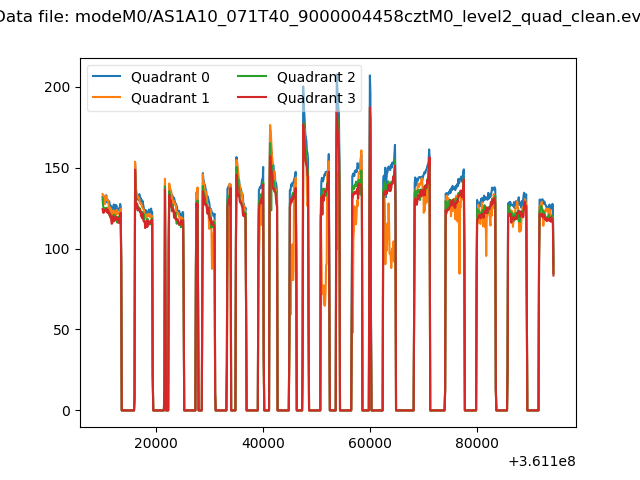
| Quadrant-wise count rates Data is divided into 100 sec bins |
 |
|
| Module-wise count rates for Quadrant A Data is divided into 100 sec bins |
 |
 |
| Module-wise count rates for Quadrant B Data is divided into 100 sec bins |
 |
 |
| Module-wise count rates for Quadrant C Data is divided into 100 sec bins |
 |
 |
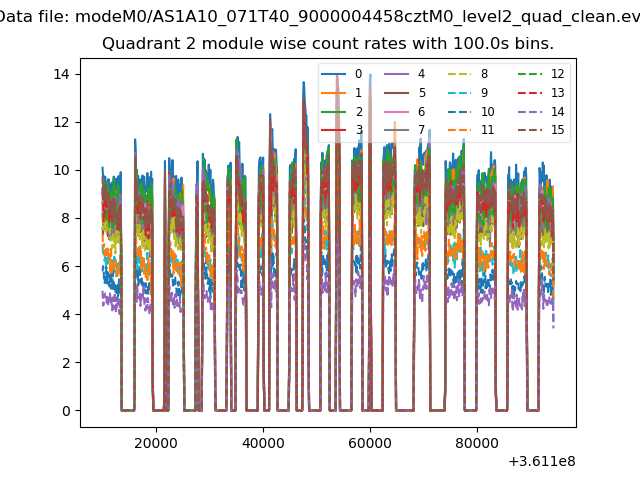
| Module-wise count rates for Quadrant D Data is divided into 100 sec bins |
 |
 |
| Parameter | Plot |
|---|---|
| CZT HV Monitor |  |
| D_VDD |  |
| Temperature 1 | 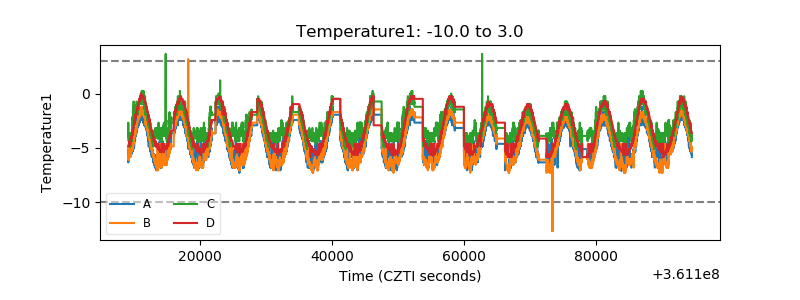 |
| Veto HV Monitor |  |
| Veto LLD | 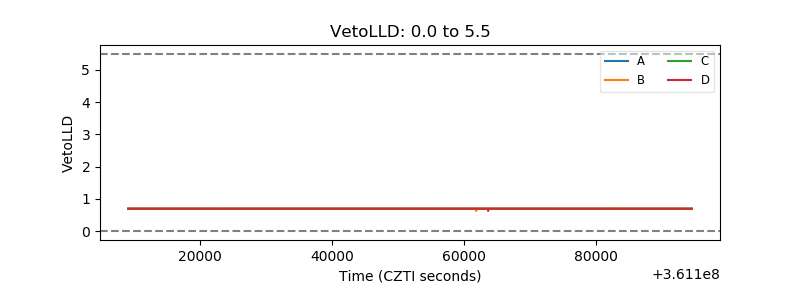 |
| Alpha Counter |  |
| _CPM_Rate |  |
| CZT Counter |  |
| +2.5 Volts monitor |  |
| +5 Volts monitor |  |
| _ROLL_ROT | 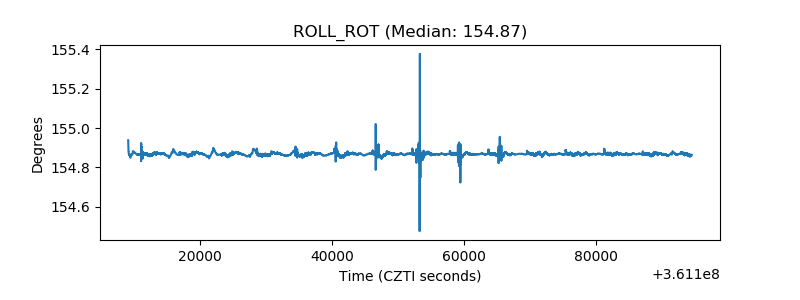 |
| _Roll_DEC |  |
| _Roll_RA |  |
| Veto Counter |  |