| Param | Original file | Final file |
|---|---|---|
| Filename | modeM0/AS1A10_071T40_9000004458_30837cztM0_level2.evt | modeM0/AS1A10_071T40_9000004458_30837cztM0_level2_quad_clean.evt |
| Size (bytes) | 204,405,120 | 28,664,640 |
| Size | 194.9 MB | 27.3 MB |
| Events in quadrant A | 1,264,576 | 182,167 |
| Events in quadrant B | 1,902,387 | 181,826 |
| Events in quadrant C | 1,413,791 | 173,356 |
| Events in quadrant D | 1,458,932 | 172,058 |
| Mode M0 | |||
|---|---|---|---|
| Quadrant | BADHDUFLAG | Total packets | Discarded packets |
| A | 0 | 5011 | 1 |
| B | 0 | 7201 | 1 |
| C | 0 | 5639 | 1 |
| D | 0 | 5679 | 1 |
| Mode SS | |||
|---|---|---|---|
| Quadrant | BADHDUFLAG | Total packets | Discarded packets |
| A | 0 | 44 | 0 |
| B | 0 | 44 | 0 |
| C | 0 | 44 | 0 |
| D | 0 | 44 | 0 |
| Quadrant | Total seconds | Saturated seconds | Saturation percentage |
|---|---|---|---|
| A | 2184 | 308 | 14.102564% |
| B | 2184 | 420 | 19.230769% |
| C | 2184 | 380 | 17.399267% |
| D | 2184 | 277 | 12.683150% |
Noise dominated data is calculated using 1-second bins in cleaned event files. If a bin has >2000 counts, and if more than 50% of those come from <1% of pixels, then it is considered to be noise-dominated and hence unusable.
| Quadrant | # 1 sec bins | Bins with >0 counts | Bins with >2000 counts | High rate bins dominated by noise | Noise dominated (total time) | Noise dominated (detector-on time) | Marked lightcurve |
|---|---|---|---|---|---|---|---|
| A | 2199 | 2184 | 0 | 0 | 0.00% | 0.00% | 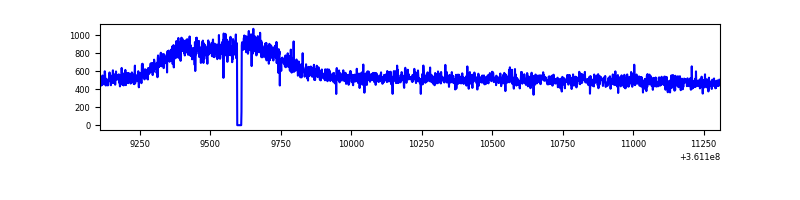 |
| B | 2199 | 2184 | 5 | 5 | 0.23% | 0.23% | 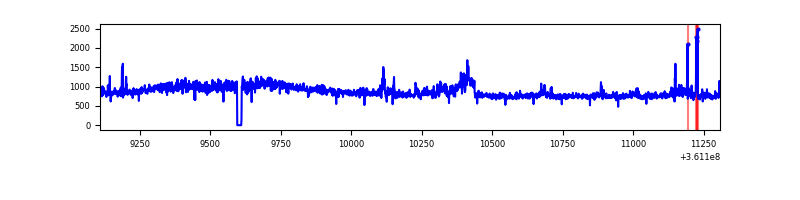 |
| C | 2199 | 2184 | 0 | 0 | 0.00% | 0.00% | 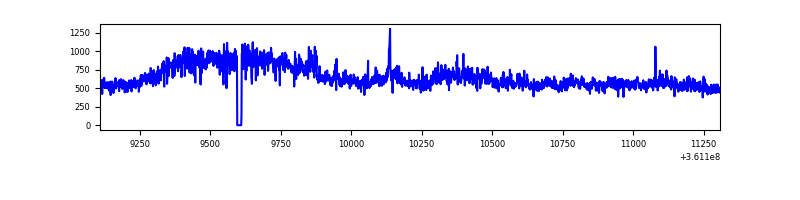 |
| D | 2199 | 2184 | 1 | 1 | 0.05% | 0.05% | 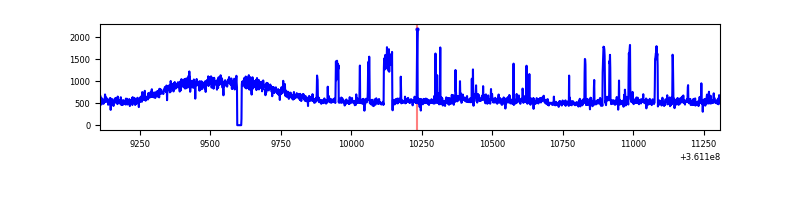 |
Top three noisy pixels from each quadrant. If the there are fewer than three noisy pixels in the level2.evt file, extra rows are filled as -1
| Pixel properties | Quadrant properties | ||||||
|---|---|---|---|---|---|---|---|
| Quadrant | DetID | PixID | Counts | Sigma | Mean | Median | Sigma |
| A | 3 | 137 | 3619 | 46.35 | 328 | 319 | 71.2 |
| A | 13 | 254 | 3452 | 44.0 | 328 | 319 | 71.2 |
| A | 0 | 226 | 2805 | 34.91 | 328 | 319 | 71.2 |
| B | 6 | 159 | 579965 | 9101.39 | 310 | 300 | 63.7 |
| B | 6 | 36 | 27389 | 425.33 | 310 | 300 | 63.7 |
| B | 0 | 190 | 27157 | 421.69 | 310 | 300 | 63.7 |
| C | 3 | 233 | 139641 | 1835.53 | 305 | 304 | 75.9 |
| C | 14 | 238 | 56289 | 737.51 | 305 | 304 | 75.9 |
| C | 14 | 254 | 13393 | 172.43 | 305 | 304 | 75.9 |
| D | 8 | 195 | 153565 | 1914.99 | 323 | 313 | 80.0 |
| D | 1 | 52 | 55297 | 687.06 | 323 | 313 | 80.0 |
| D | 2 | 250 | 18752 | 230.41 | 323 | 313 | 80.0 |
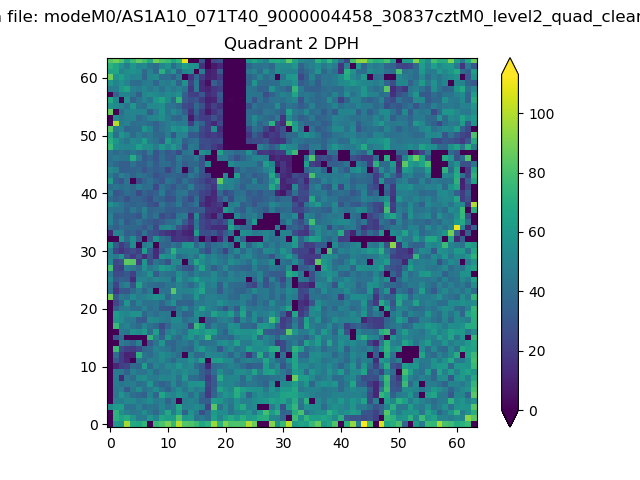
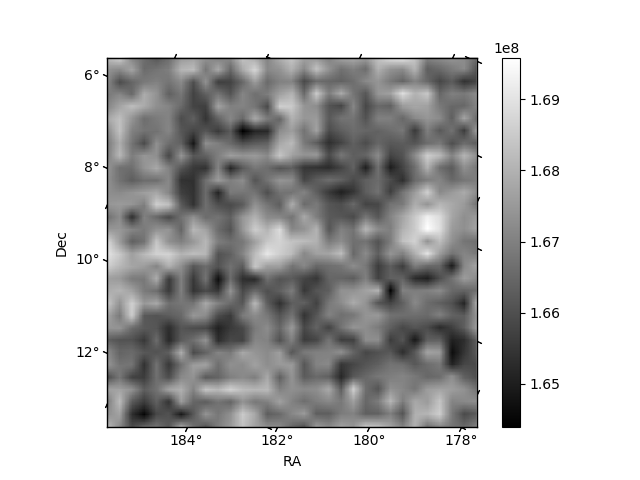
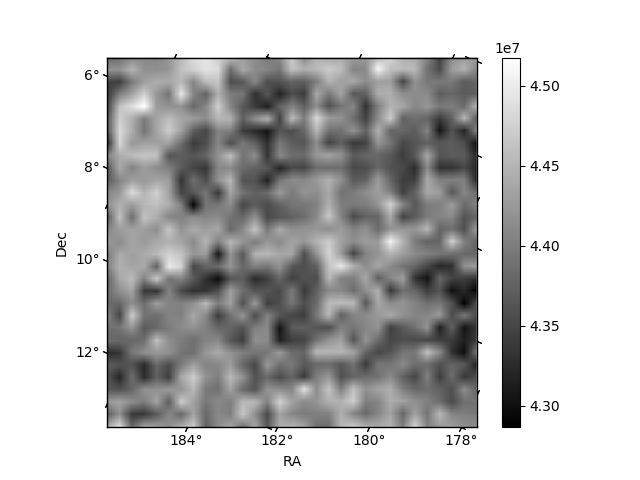
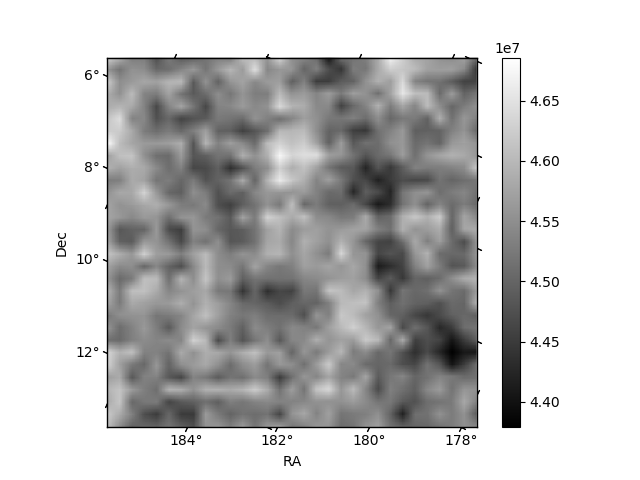
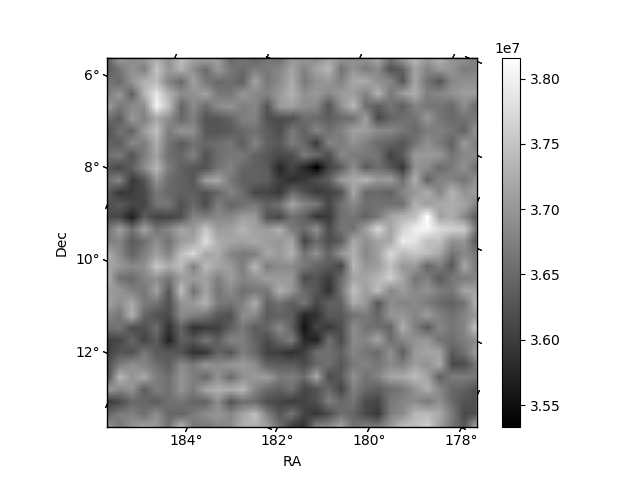
Histogram calculated using DETX and DETY for each event in the final _common_clean file
| Quadrant A | 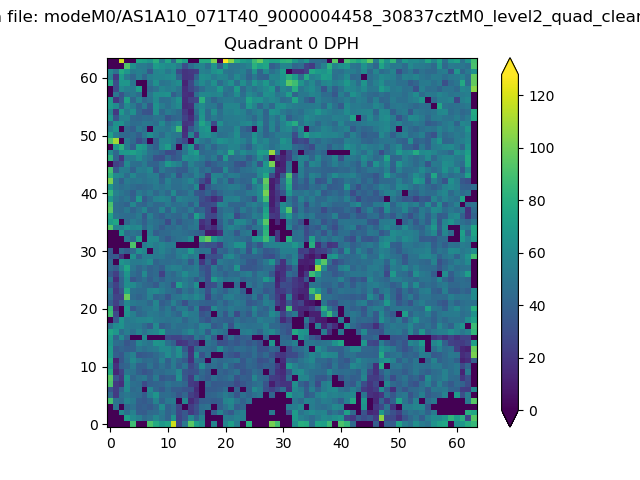 |
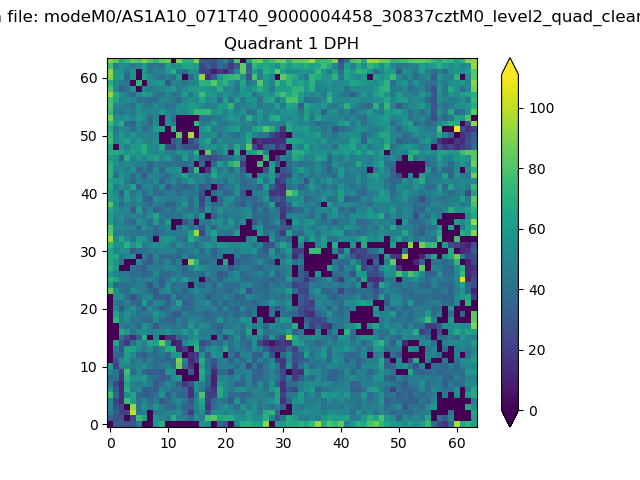 |
Quadrant B |
|---|---|---|---|
| Quadrant D | 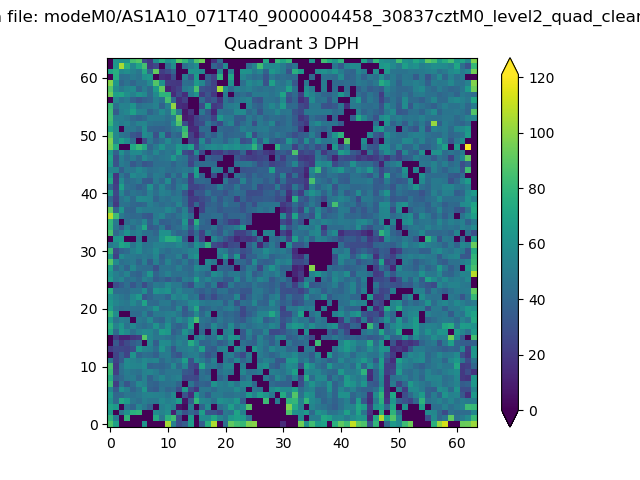 |
 |
Quadrant C |
| Plot type | Count rate plots | Images |
|---|---|---|
| Comparison with Poisson distribution Blue bars denote a histogram of data divided into 1 sec bins. Red curve is a Poisson curve with rate = median count rate of data. |
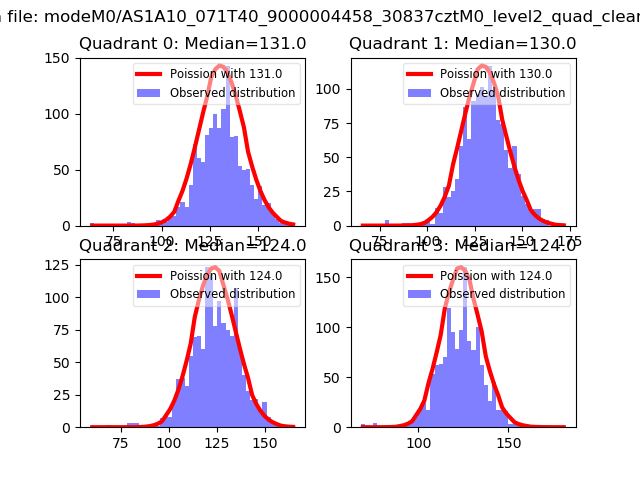 |
 |
| Quadrant-wise count rates Data is divided into 100 sec bins |
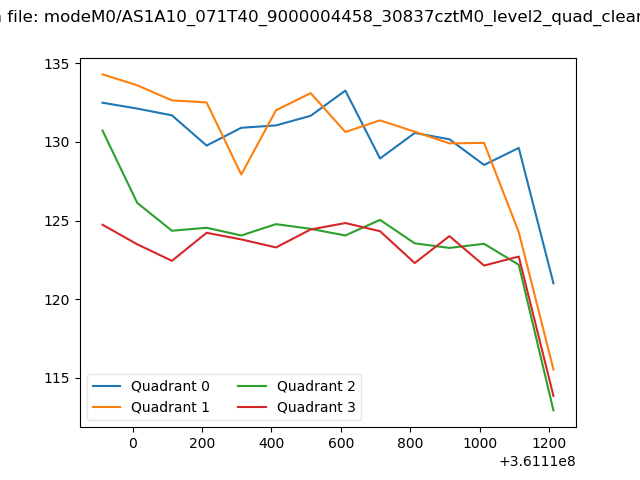 |
|
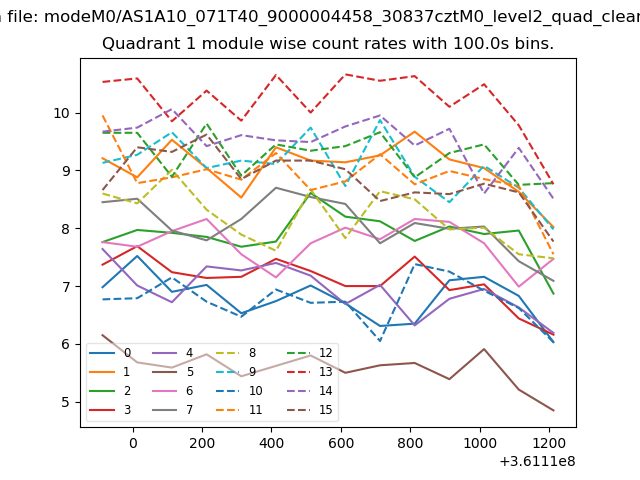
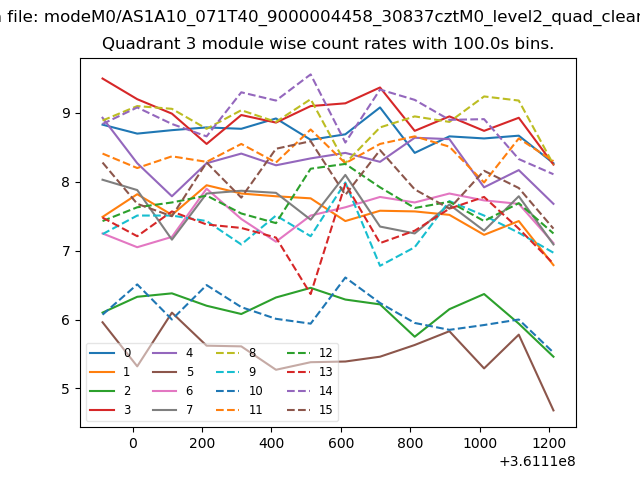
| Module-wise count rates for Quadrant A Data is divided into 100 sec bins |
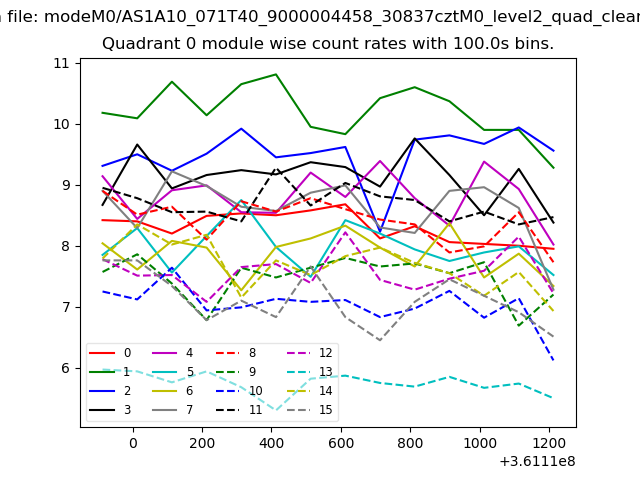 |
 |
| Module-wise count rates for Quadrant B Data is divided into 100 sec bins |
 |
 |
| Module-wise count rates for Quadrant C Data is divided into 100 sec bins |
 |
 |
| Module-wise count rates for Quadrant D Data is divided into 100 sec bins |
 |
 |
| Parameter | Plot |
|---|---|
| CZT HV Monitor | 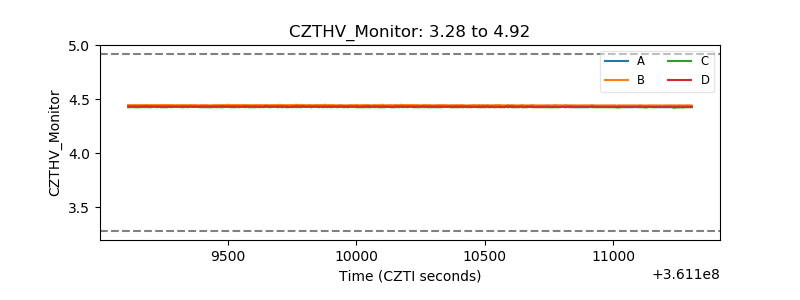 |
| D_VDD | 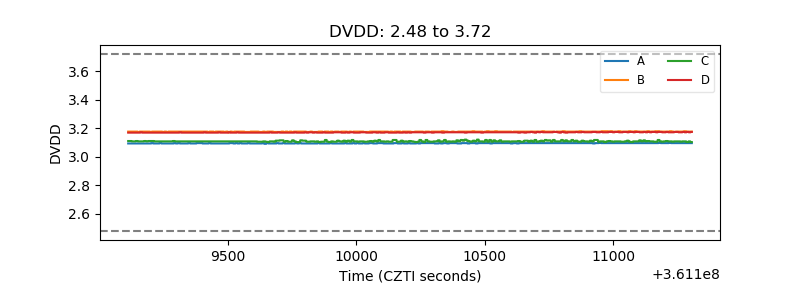 |
| Temperature 1 | 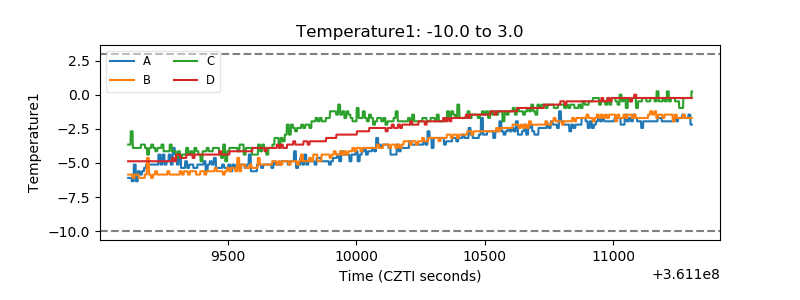 |
| Veto HV Monitor | 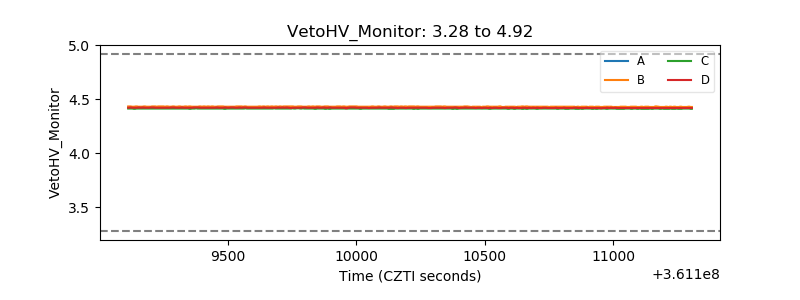 |
| Veto LLD | 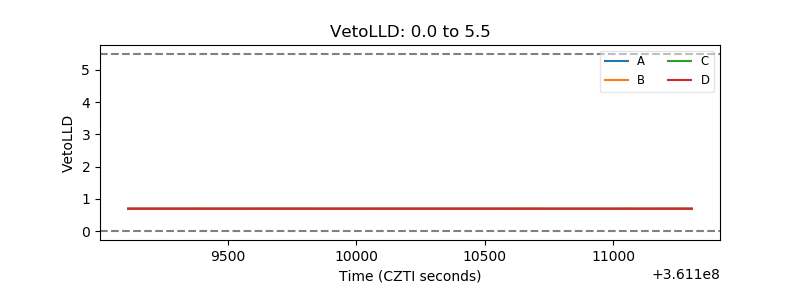 |
| Alpha Counter | 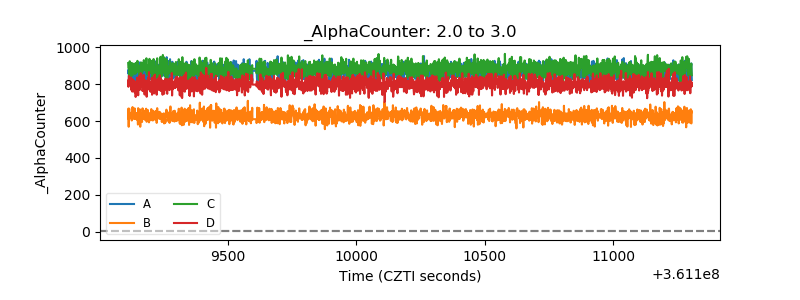 |
| _CPM_Rate | 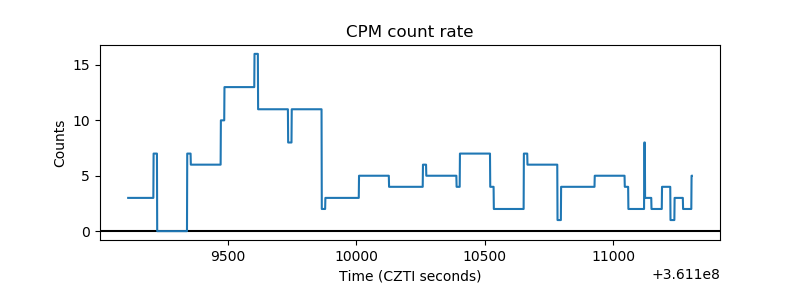 |
| CZT Counter |  |
| +2.5 Volts monitor |  |
| +5 Volts monitor |  |
| _ROLL_ROT | 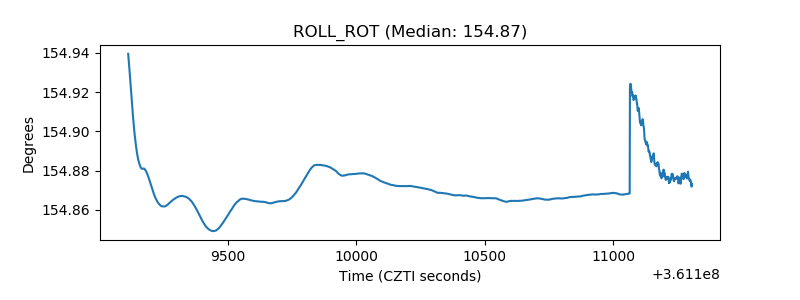 |
| _Roll_DEC | 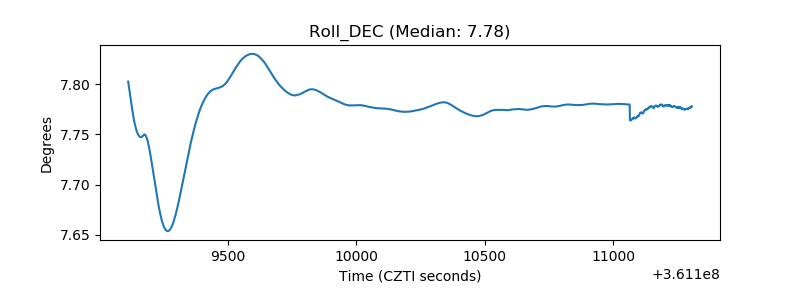 |
| _Roll_RA | 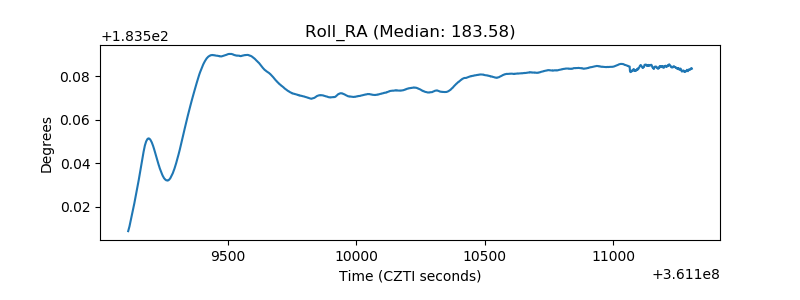 |
| Veto Counter | 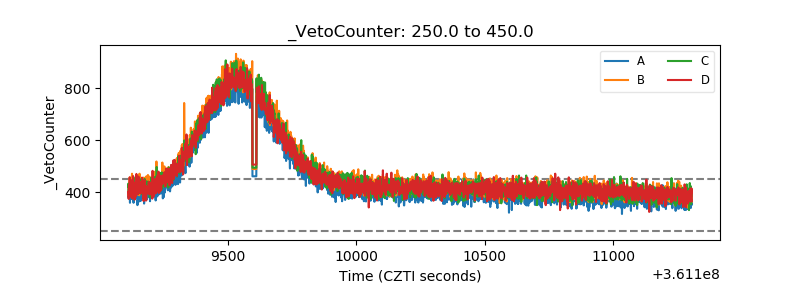 |