| Param | Original file | Final file |
|---|---|---|
| Filename | modeM0/AS1A10_071T40_9000004458_30840cztM0_level2.evt | modeM0/AS1A10_071T40_9000004458_30840cztM0_level2_quad_clean.evt |
| Size (bytes) | 1,475,735,040 | 228,441,600 |
| Size | 1.4 GB | 217.9 MB |
| Events in quadrant A | 8,534,563 | 1,464,192 |
| Events in quadrant B | 14,551,378 | 1,441,309 |
| Events in quadrant C | 9,477,653 | 1,385,543 |
| Events in quadrant D | 10,913,416 | 1,384,630 |
| Mode M0 | |||
|---|---|---|---|
| Quadrant | BADHDUFLAG | Total packets | Discarded packets |
| A | 0 | 37084 | 3 |
| B | 0 | 56122 | 3 |
| C | 0 | 39595 | 4 |
| D | 0 | 43980 | 3 |
| Mode SS | |||
|---|---|---|---|
| Quadrant | BADHDUFLAG | Total packets | Discarded packets |
| A | 0 | 368 | 0 |
| B | 0 | 368 | 0 |
| C | 0 | 368 | 0 |
| D | 0 | 368 | 0 |
| Mode M9 | |||
|---|---|---|---|
| Quadrant | BADHDUFLAG | Total packets | Discarded packets |
| A | 0 | 17 | 0 |
| B | 0 | 17 | 0 |
| C | 0 | 17 | 0 |
| D | 0 | 17 | 0 |
| Quadrant | Total seconds | Saturated seconds | Saturation percentage |
|---|---|---|---|
| A | 18031 | 191 | 1.059287% |
| B | 18032 | 488 | 2.706300% |
| C | 18031 | 518 | 2.872830% |
| D | 18031 | 209 | 1.159115% |
Noise dominated data is calculated using 1-second bins in cleaned event files. If a bin has >2000 counts, and if more than 50% of those come from <1% of pixels, then it is considered to be noise-dominated and hence unusable.
| Quadrant | # 1 sec bins | Bins with >0 counts | Bins with >2000 counts | High rate bins dominated by noise | Noise dominated (total time) | Noise dominated (detector-on time) | Marked lightcurve |
|---|---|---|---|---|---|---|---|
| A | 19801 | 18031 | 0 | 0 | 0.00% | 0.00% | 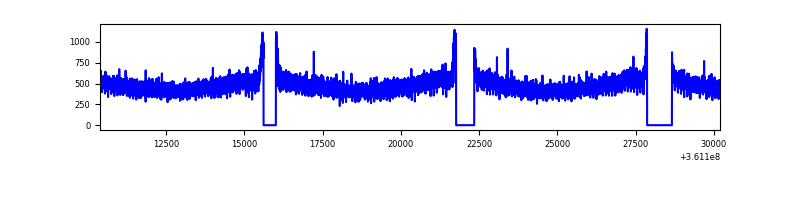 |
| B | 19802 | 18032 | 113 | 113 | 0.57% | 0.63% | 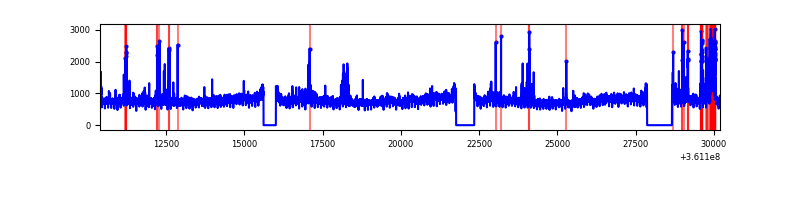 |
| C | 19801 | 18031 | 2 | 2 | 0.01% | 0.01% | 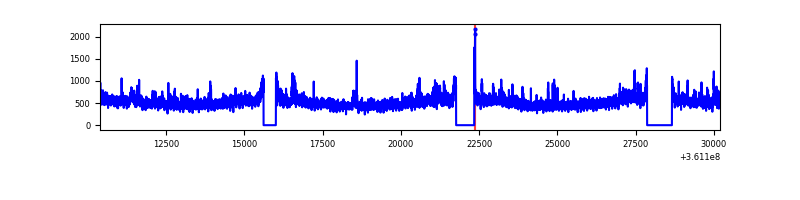 |
| D | 19801 | 18031 | 57 | 57 | 0.29% | 0.32% | 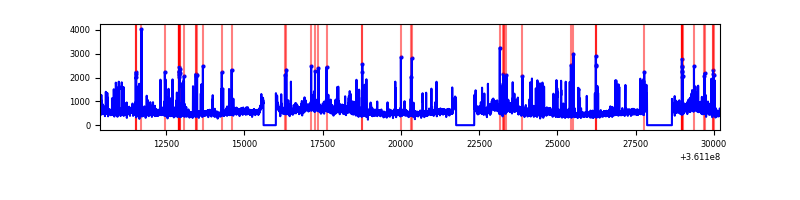 |
Top three noisy pixels from each quadrant. If the there are fewer than three noisy pixels in the level2.evt file, extra rows are filled as -1
| Pixel properties | Quadrant properties | ||||||
|---|---|---|---|---|---|---|---|
| Quadrant | DetID | PixID | Counts | Sigma | Mean | Median | Sigma |
| A | 13 | 254 | 33401 | 70.17 | 2212 | 2163 | 445.1 |
| A | 3 | 137 | 22497 | 45.68 | 2212 | 2163 | 445.1 |
| A | 0 | 226 | 18394 | 36.46 | 2212 | 2163 | 445.1 |
| B | 6 | 159 | 5145212 | 12351.44 | 2175 | 2118 | 416.4 |
| B | 5 | 172 | 378908 | 904.88 | 2175 | 2118 | 416.4 |
| B | 6 | 36 | 257311 | 612.86 | 2175 | 2118 | 416.4 |
| C | 3 | 233 | 644682 | 1278.42 | 2105 | 2117 | 502.6 |
| C | 14 | 238 | 421736 | 834.85 | 2105 | 2117 | 502.6 |
| C | 14 | 254 | 119852 | 234.24 | 2105 | 2117 | 502.6 |
| D | 8 | 195 | 1773299 | 3505.0 | 2136 | 2090 | 505.3 |
| D | 1 | 52 | 641173 | 1264.67 | 2136 | 2090 | 505.3 |
| D | 2 | 250 | 102843 | 199.38 | 2136 | 2090 | 505.3 |
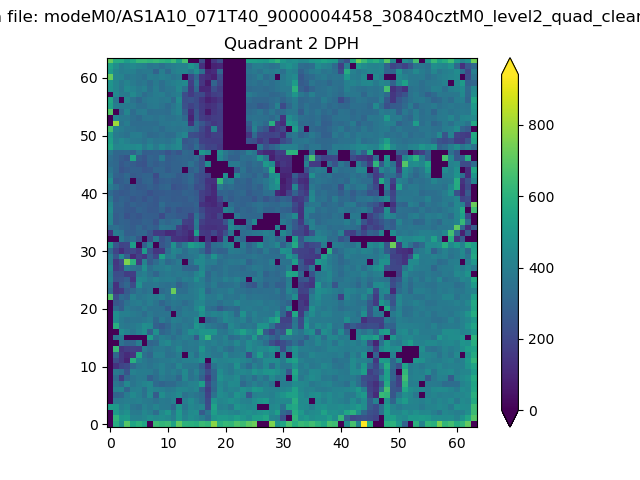
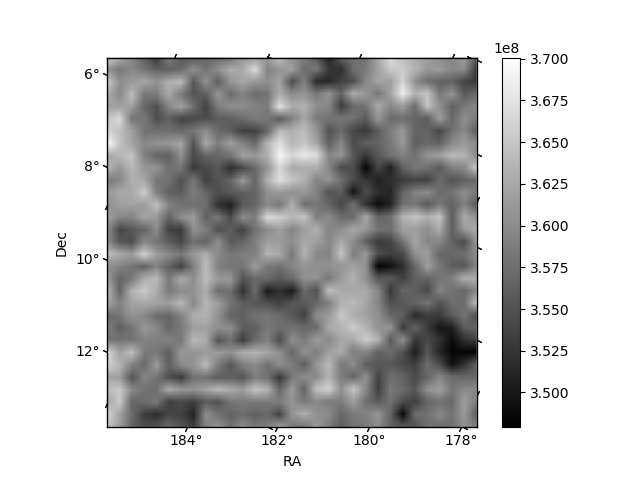
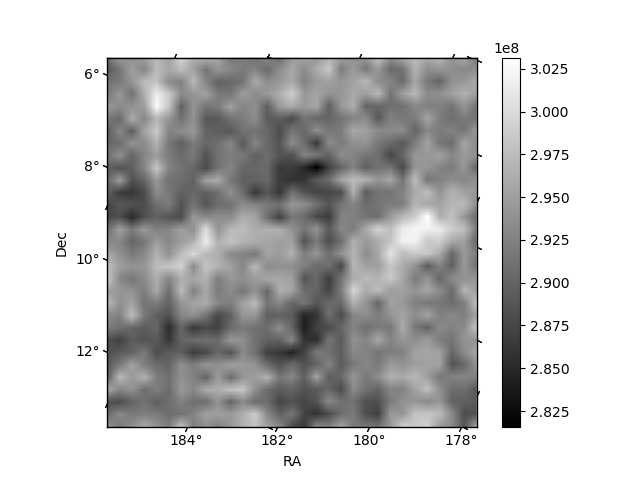
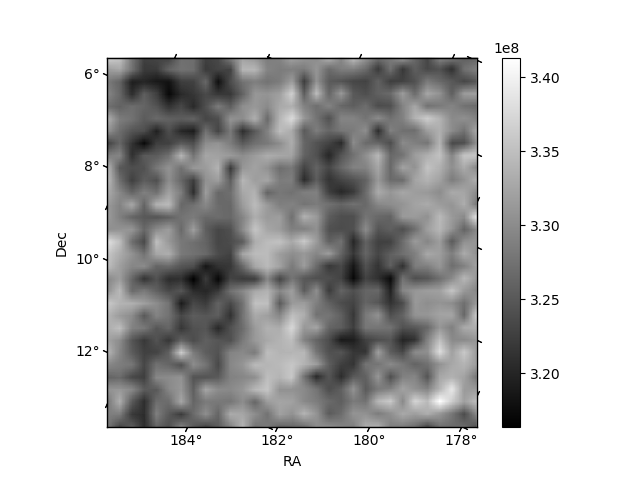
Histogram calculated using DETX and DETY for each event in the final _common_clean file
| Quadrant A | 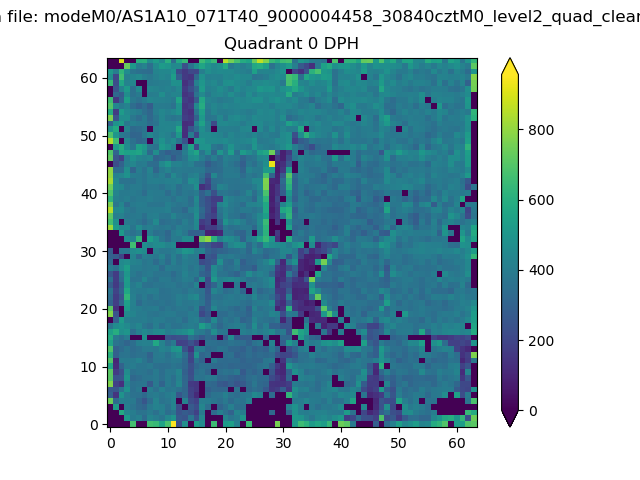 |
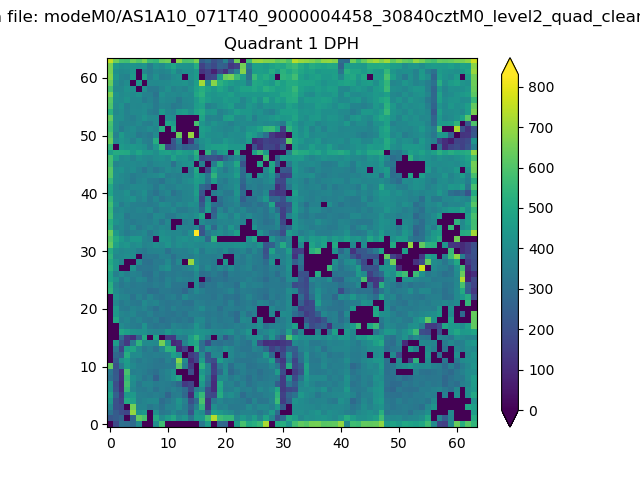 |
Quadrant B |
|---|---|---|---|
| Quadrant D | 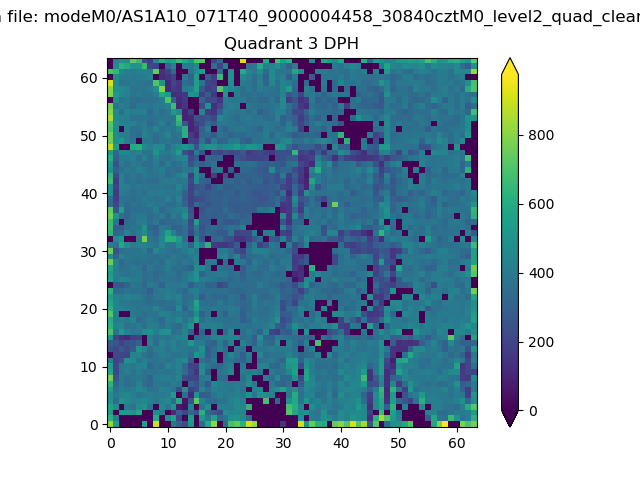 |
 |
Quadrant C |
| Plot type | Count rate plots | Images |
|---|---|---|
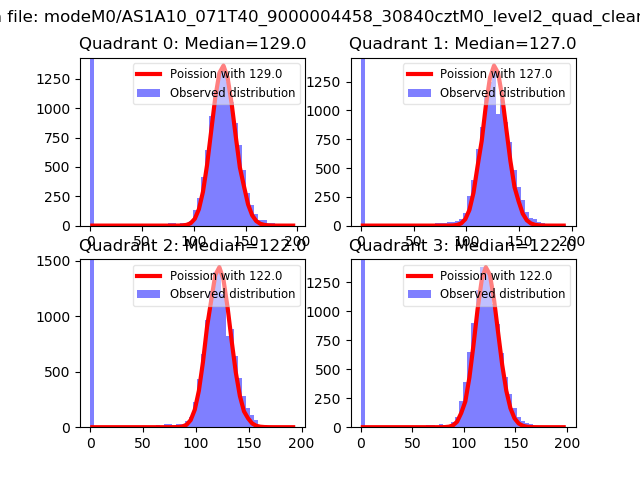
| Comparison with Poisson distribution Blue bars denote a histogram of data divided into 1 sec bins. Red curve is a Poisson curve with rate = median count rate of data. |
 |
 |
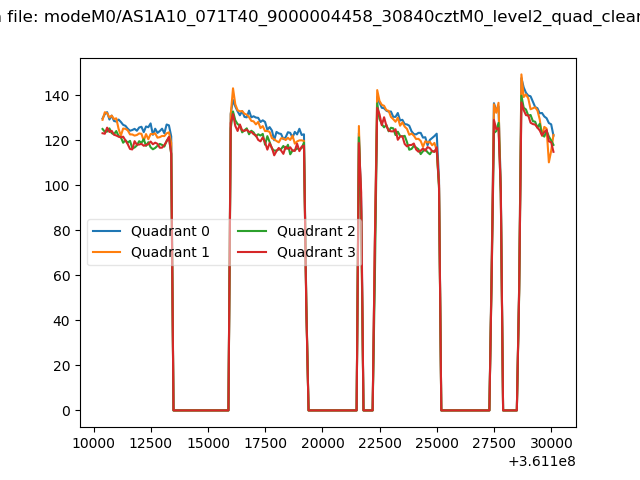
| Quadrant-wise count rates Data is divided into 100 sec bins |
 |
|
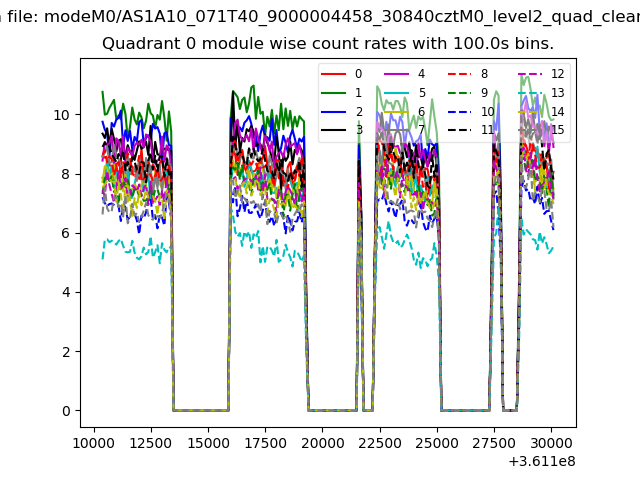
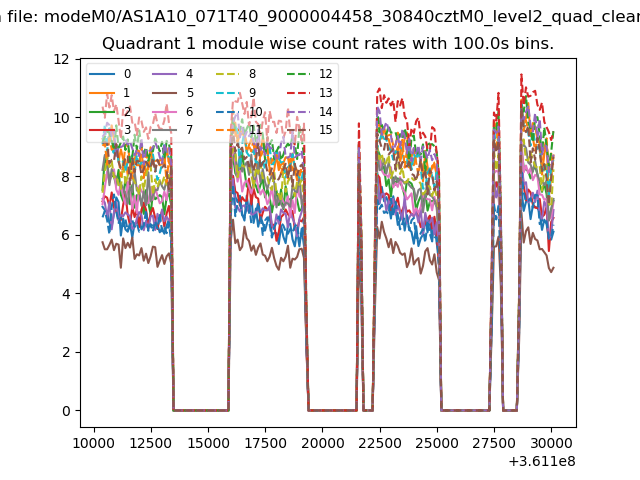
| Module-wise count rates for Quadrant A Data is divided into 100 sec bins |
 |
 |
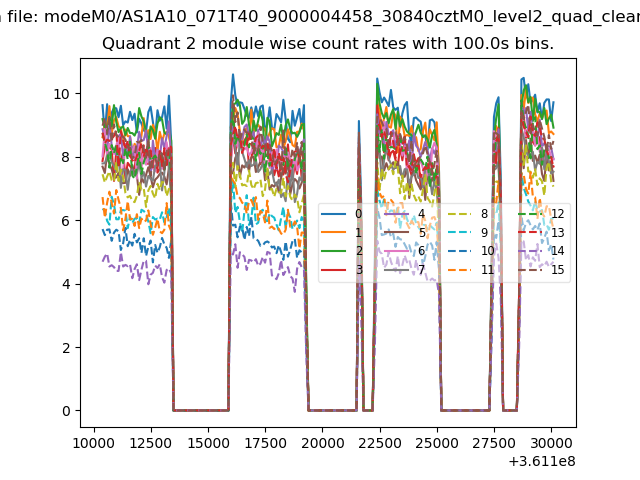
| Module-wise count rates for Quadrant B Data is divided into 100 sec bins |
 |
 |
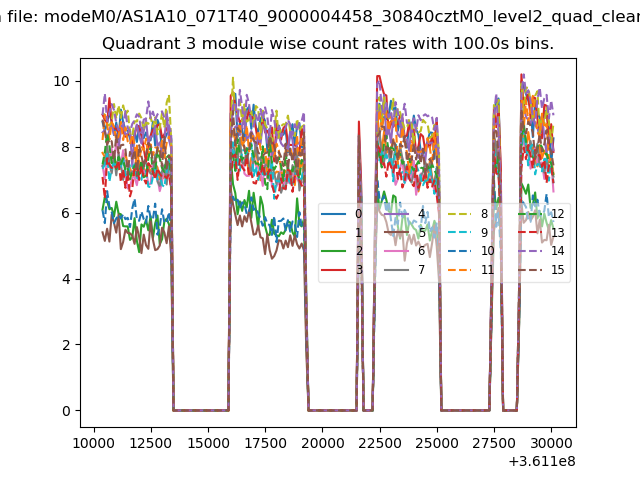
| Module-wise count rates for Quadrant C Data is divided into 100 sec bins |
 |
 |
| Module-wise count rates for Quadrant D Data is divided into 100 sec bins |
 |
 |
| Parameter | Plot |
|---|---|
| CZT HV Monitor | 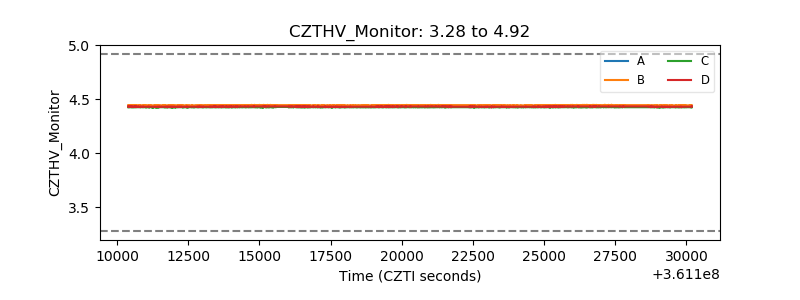 |
| D_VDD |  |
| Temperature 1 | 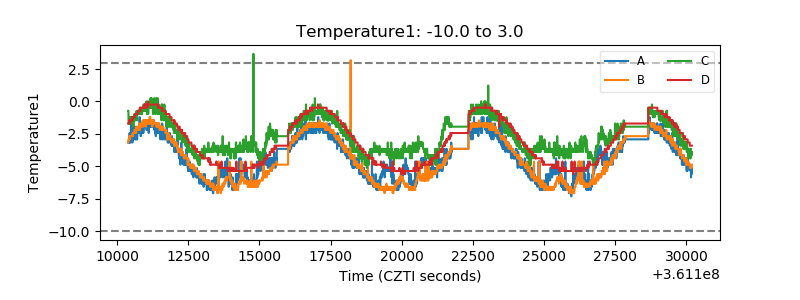 |
| Veto HV Monitor | 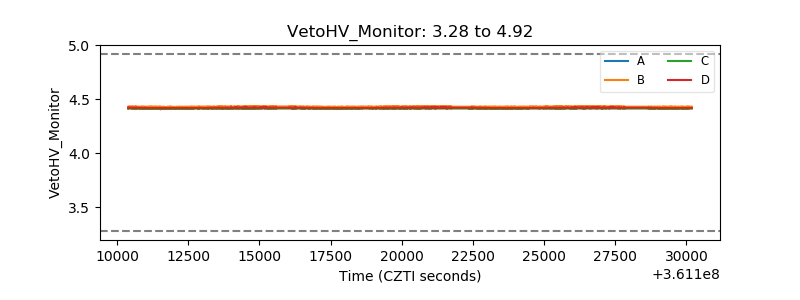 |
| Veto LLD | 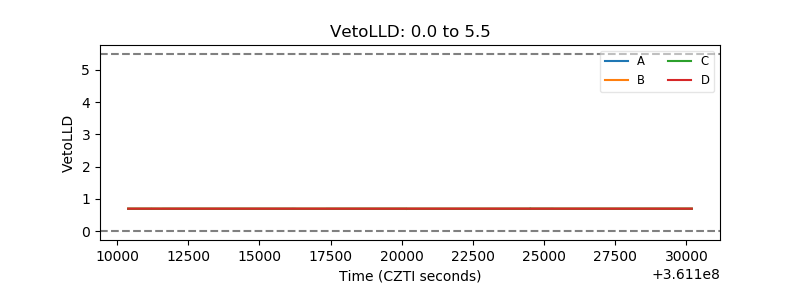 |
| Alpha Counter | 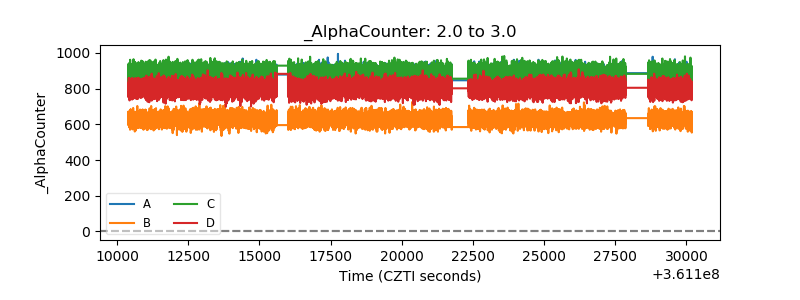 |
| _CPM_Rate | 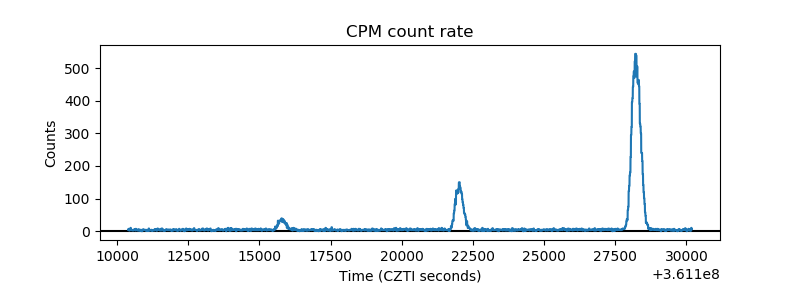 |
| CZT Counter | 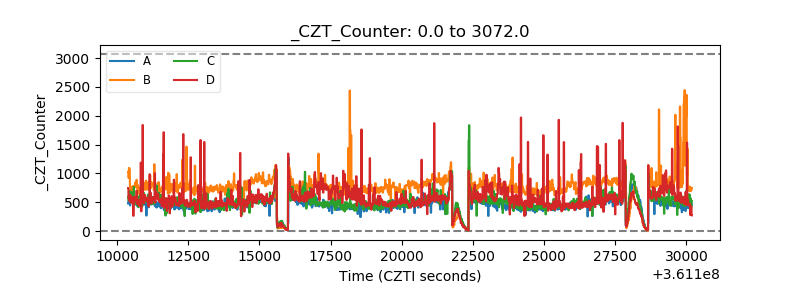 |
| +2.5 Volts monitor |  |
| +5 Volts monitor |  |
| _ROLL_ROT | 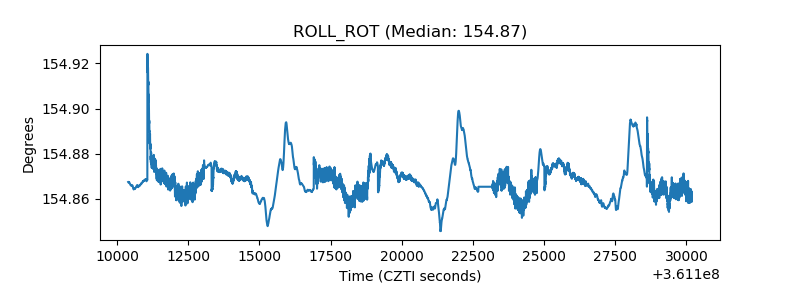 |
| _Roll_DEC | 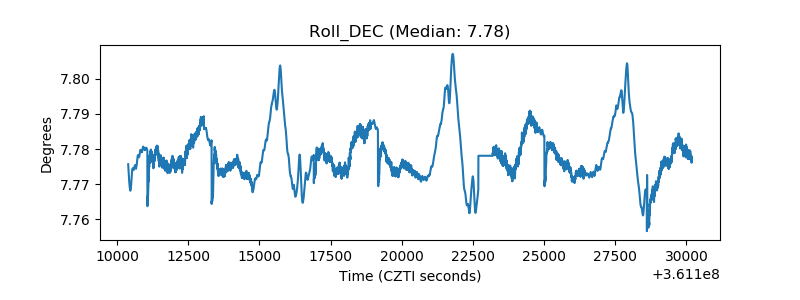 |
| _Roll_RA |  |
| Veto Counter | 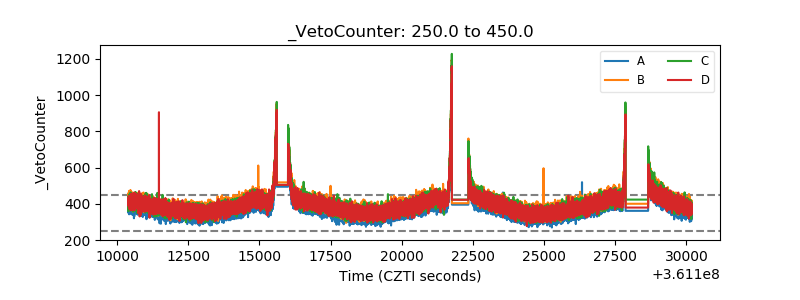 |