| Param | Original file | Final file |
|---|---|---|
| Filename | modeM0/AS1A10_071T40_9000004458_30843cztM0_level2.evt | modeM0/AS1A10_071T40_9000004458_30843cztM0_level2_quad_clean.evt |
| Size (bytes) | 625,858,560 | 90,843,840 |
| Size | 596.9 MB | 86.6 MB |
| Events in quadrant A | 3,113,663 | 598,840 |
| Events in quadrant B | 8,157,696 | 578,783 |
| Events in quadrant C | 3,391,180 | 565,242 |
| Events in quadrant D | 3,855,002 | 558,184 |
| Mode M0 | |||
|---|---|---|---|
| Quadrant | BADHDUFLAG | Total packets | Discarded packets |
| A | 0 | 13308 | 2 |
| B | 0 | 28780 | 2 |
| C | 0 | 14024 | 2 |
| D | 0 | 15695 | 2 |
| Mode SS | |||
|---|---|---|---|
| Quadrant | BADHDUFLAG | Total packets | Discarded packets |
| A | 0 | 132 | 0 |
| B | 0 | 132 | 0 |
| C | 0 | 132 | 0 |
| D | 0 | 132 | 0 |
| Mode M9 | |||
|---|---|---|---|
| Quadrant | BADHDUFLAG | Total packets | Discarded packets |
| A | 0 | 11 | 0 |
| B | 0 | 12 | 0 |
| C | 0 | 12 | 0 |
| D | 0 | 12 | 0 |
| Quadrant | Total seconds | Saturated seconds | Saturation percentage |
|---|---|---|---|
| A | 6447 | 27 | 0.418799% |
| B | 6447 | 1466 | 22.739259% |
| C | 6446 | 148 | 2.295998% |
| D | 6446 | 37 | 0.573999% |
Noise dominated data is calculated using 1-second bins in cleaned event files. If a bin has >2000 counts, and if more than 50% of those come from <1% of pixels, then it is considered to be noise-dominated and hence unusable.
| Quadrant | # 1 sec bins | Bins with >0 counts | Bins with >2000 counts | High rate bins dominated by noise | Noise dominated (total time) | Noise dominated (detector-on time) | Marked lightcurve |
|---|---|---|---|---|---|---|---|
| A | 7542 | 6447 | 0 | 0 | 0.00% | 0.00% | 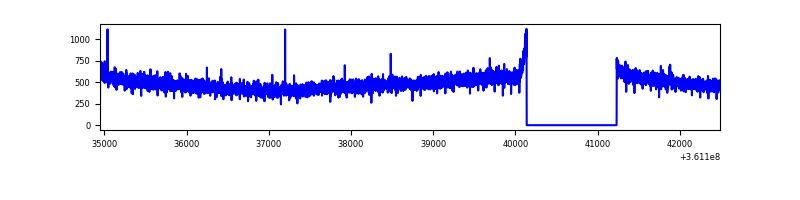 |
| B | 7542 | 6447 | 849 | 849 | 11.26% | 13.17% | 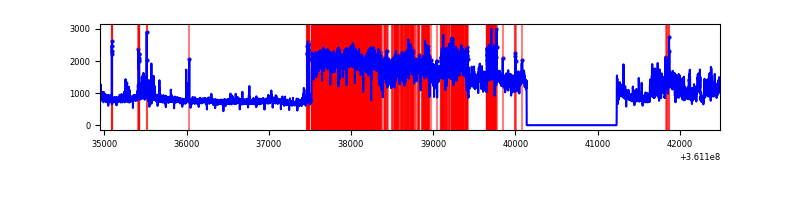 |
| C | 7541 | 6446 | 10 | 10 | 0.13% | 0.16% | 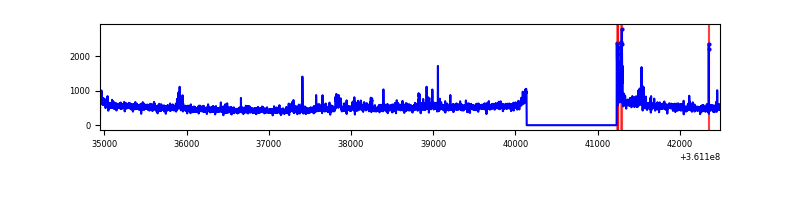 |
| D | 7541 | 6447 | 14 | 14 | 0.19% | 0.22% | 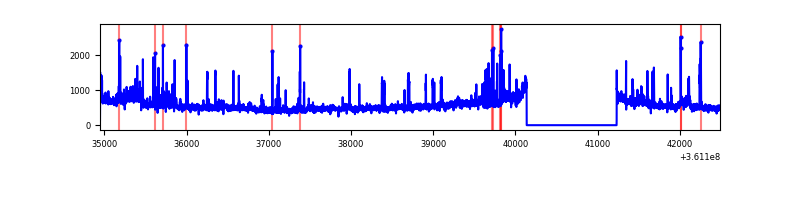 |
Top three noisy pixels from each quadrant. If the there are fewer than three noisy pixels in the level2.evt file, extra rows are filled as -1
| Pixel properties | Quadrant properties | ||||||
|---|---|---|---|---|---|---|---|
| Quadrant | DetID | PixID | Counts | Sigma | Mean | Median | Sigma |
| A | 13 | 254 | 12120 | 70.42 | 806 | 790 | 160.9 |
| A | 3 | 137 | 8094 | 45.4 | 806 | 790 | 160.9 |
| A | 0 | 226 | 6654 | 36.45 | 806 | 790 | 160.9 |
| B | 6 | 36 | 3157291 | 21407.16 | 770 | 752 | 147.5 |
| B | 6 | 159 | 1795810 | 12173.81 | 770 | 752 | 147.5 |
| B | 5 | 172 | 77912 | 523.29 | 770 | 752 | 147.5 |
| C | 14 | 238 | 145117 | 802.26 | 765 | 770 | 179.9 |
| C | 3 | 233 | 107875 | 595.28 | 765 | 770 | 179.9 |
| C | 0 | 10 | 56127 | 307.67 | 765 | 770 | 179.9 |
| D | 8 | 195 | 667381 | 3656.75 | 769 | 751 | 182.3 |
| D | 1 | 52 | 112351 | 612.17 | 769 | 751 | 182.3 |
| D | 2 | 250 | 60150 | 325.83 | 769 | 751 | 182.3 |
Histogram calculated using DETX and DETY for each event in the final _common_clean file
| Quadrant A |  |
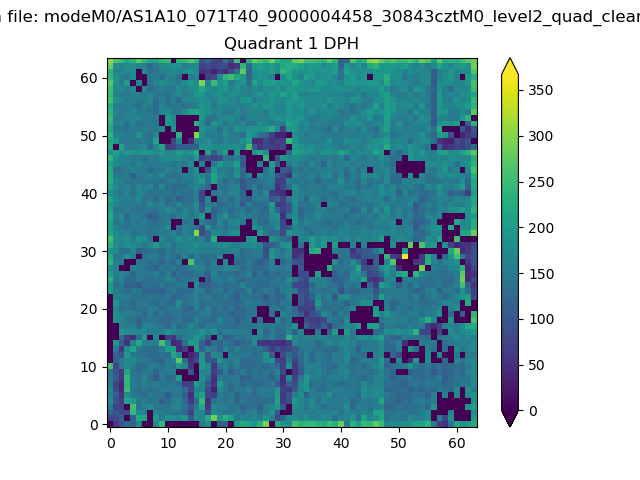 |
Quadrant B |
|---|---|---|---|
| Quadrant D |  |
 |
Quadrant C |
| Plot type | Count rate plots | Images |
|---|---|---|
| Comparison with Poisson distribution Blue bars denote a histogram of data divided into 1 sec bins. Red curve is a Poisson curve with rate = median count rate of data. |
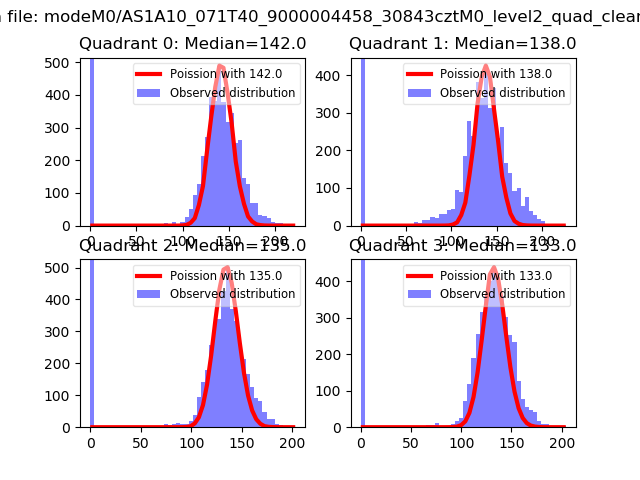 |
 |
| Quadrant-wise count rates Data is divided into 100 sec bins |
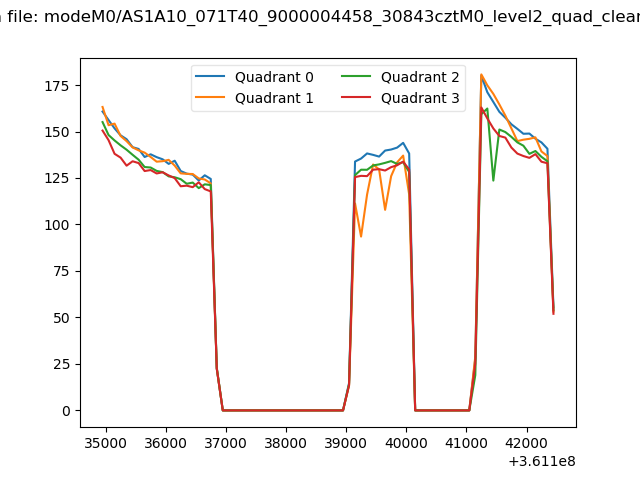 |
|
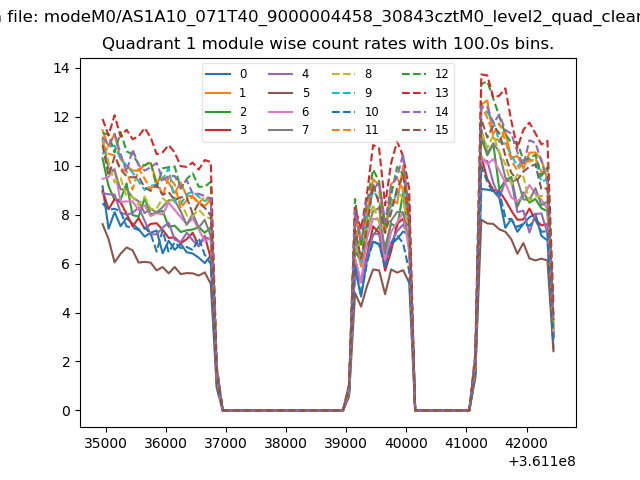
| Module-wise count rates for Quadrant A Data is divided into 100 sec bins |
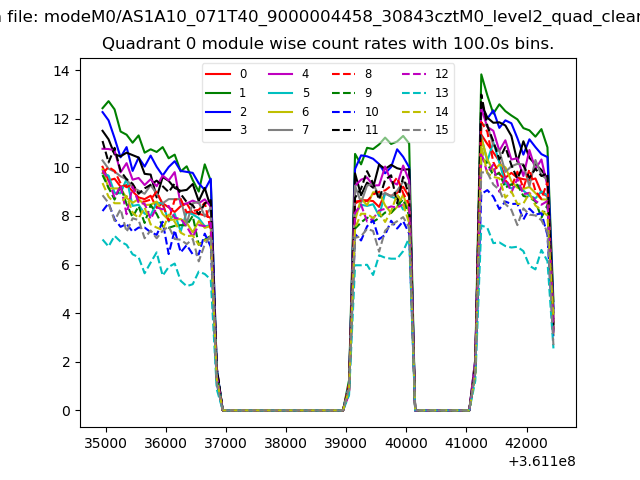 |
 |
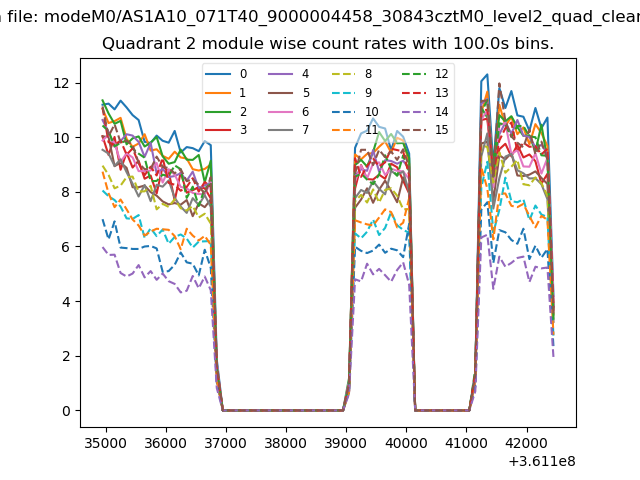
| Module-wise count rates for Quadrant B Data is divided into 100 sec bins |
 |
 |
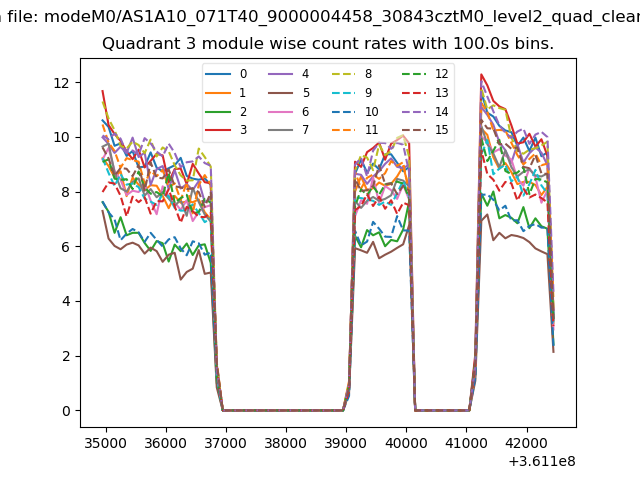
| Module-wise count rates for Quadrant C Data is divided into 100 sec bins |
 |
 |
| Module-wise count rates for Quadrant D Data is divided into 100 sec bins |
 |
 |
| Parameter | Plot |
|---|---|
| CZT HV Monitor | 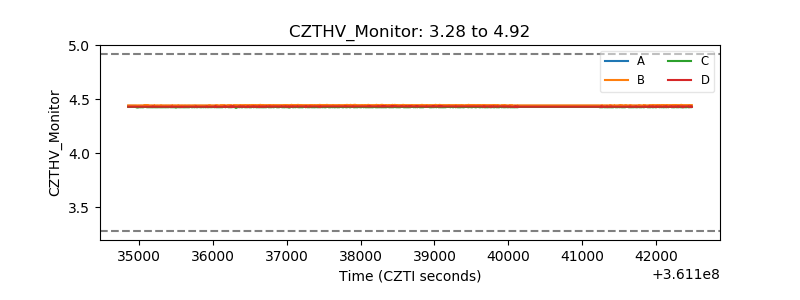 |
| D_VDD | 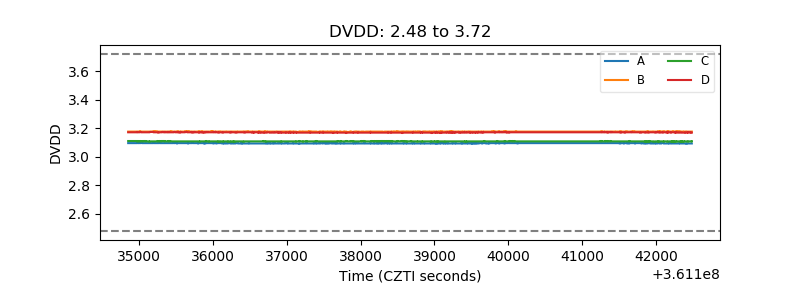 |
| Temperature 1 | 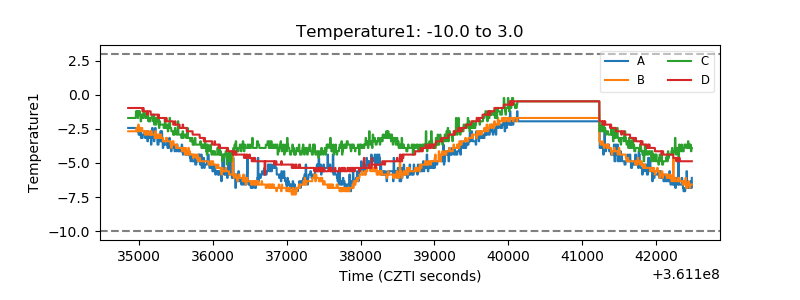 |
| Veto HV Monitor | 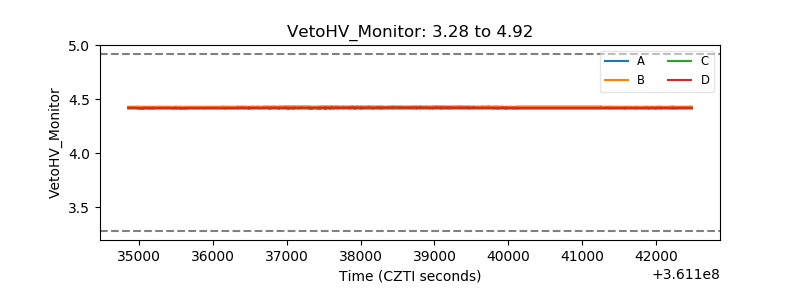 |
| Veto LLD | 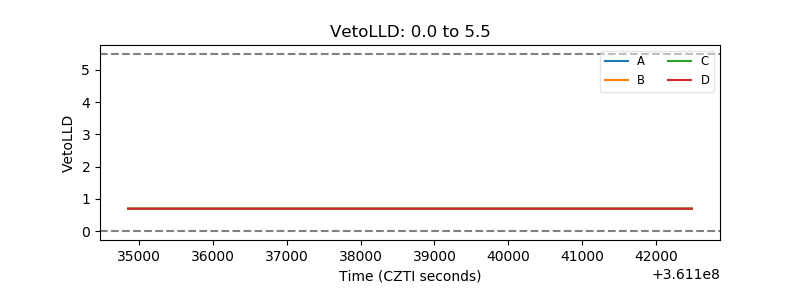 |
| Alpha Counter | 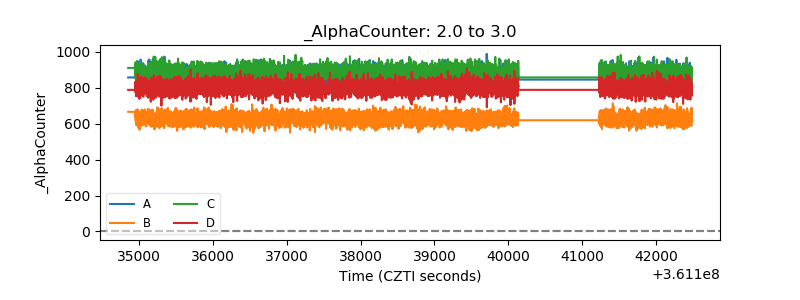 |
| _CPM_Rate | 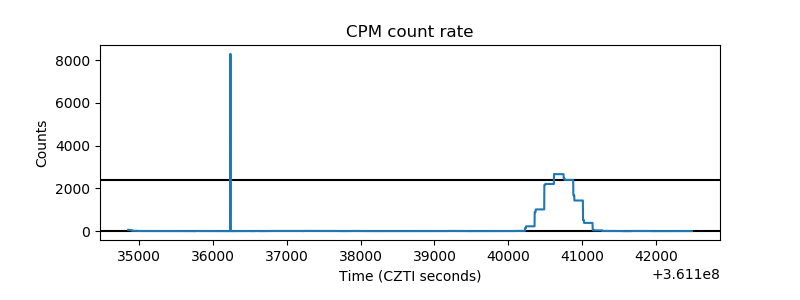 |
| CZT Counter |  |
| +2.5 Volts monitor |  |
| +5 Volts monitor |  |
| _ROLL_ROT | 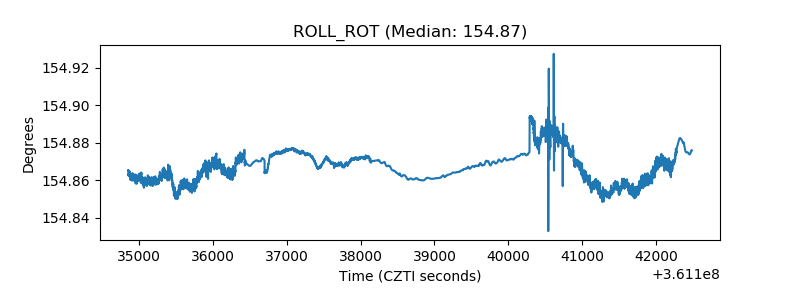 |
| _Roll_DEC | 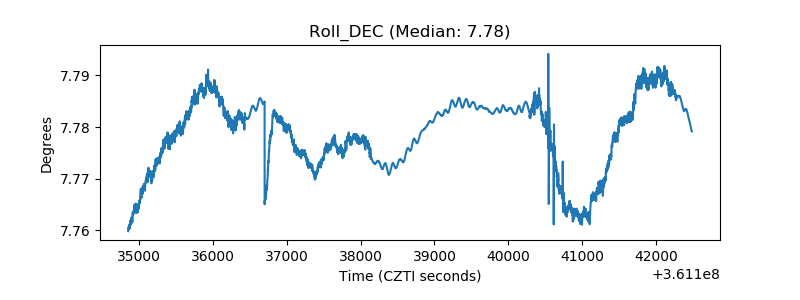 |
| _Roll_RA | 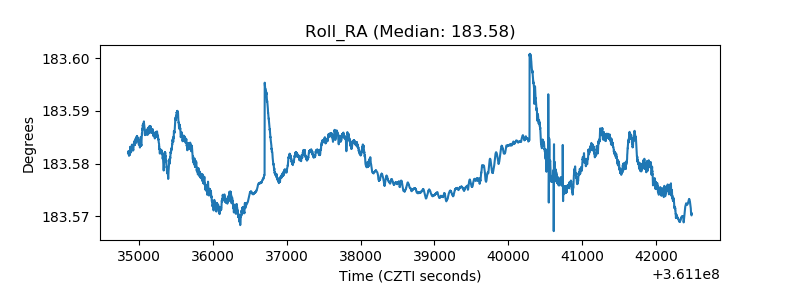 |
| Veto Counter | 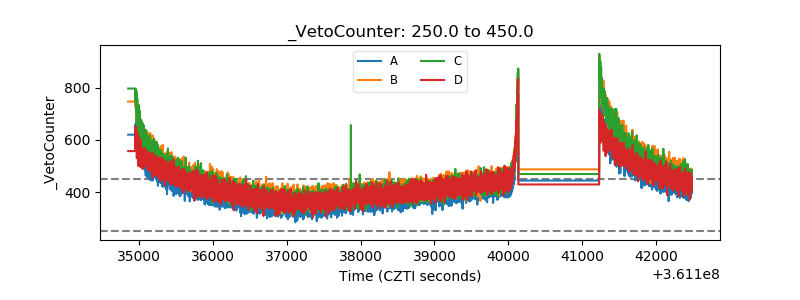 |