| Param | Original file | Final file |
|---|---|---|
| Filename | modeM0/AS1A10_071T40_9000004458_30844cztM0_level2.evt | modeM0/AS1A10_071T40_9000004458_30844cztM0_level2_quad_clean.evt |
| Size (bytes) | 697,775,040 | 87,796,800 |
| Size | 665.5 MB | 83.7 MB |
| Events in quadrant A | 3,189,586 | 593,375 |
| Events in quadrant B | 10,060,425 | 520,390 |
| Events in quadrant C | 3,655,640 | 551,933 |
| Events in quadrant D | 3,795,757 | 547,752 |
| Mode M0 | |||
|---|---|---|---|
| Quadrant | BADHDUFLAG | Total packets | Discarded packets |
| A | 0 | 13299 | 2 |
| B | 0 | 34276 | 9 |
| C | 0 | 14700 | 2 |
| D | 0 | 15376 | 2 |
| Mode SS | |||
|---|---|---|---|
| Quadrant | BADHDUFLAG | Total packets | Discarded packets |
| A | 0 | 130 | 0 |
| B | 0 | 130 | 0 |
| C | 0 | 130 | 0 |
| D | 0 | 130 | 0 |
| Mode M9 | |||
|---|---|---|---|
| Quadrant | BADHDUFLAG | Total packets | Discarded packets |
| A | 0 | 20 | 0 |
| B | 0 | 21 | 0 |
| C | 0 | 21 | 0 |
| D | 0 | 21 | 0 |
| Quadrant | Total seconds | Saturated seconds | Saturation percentage |
|---|---|---|---|
| A | 6369 | 14 | 0.219815% |
| B | 6368 | 2469 | 38.771985% |
| C | 6368 | 198 | 3.109296% |
| D | 6368 | 28 | 0.439698% |
Noise dominated data is calculated using 1-second bins in cleaned event files. If a bin has >2000 counts, and if more than 50% of those come from <1% of pixels, then it is considered to be noise-dominated and hence unusable.
| Quadrant | # 1 sec bins | Bins with >0 counts | Bins with >2000 counts | High rate bins dominated by noise | Noise dominated (total time) | Noise dominated (detector-on time) | Marked lightcurve |
|---|---|---|---|---|---|---|---|
| A | 7584 | 6370 | 0 | 0 | 0.00% | 0.00% | 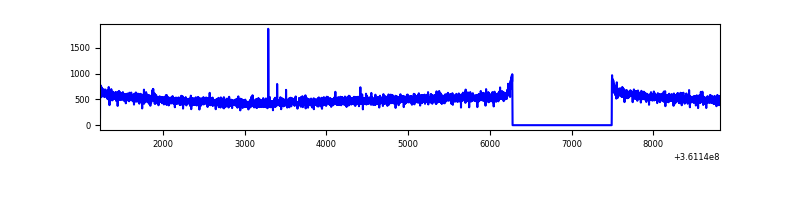 |
| B | 7582 | 6368 | 1927 | 1927 | 25.42% | 30.26% | 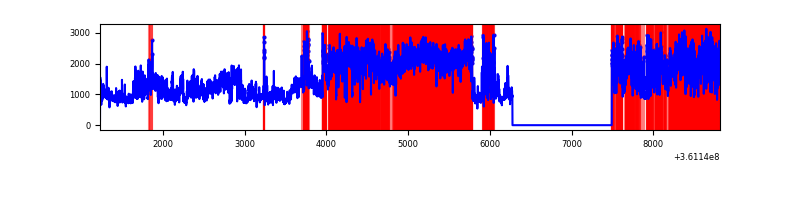 |
| C | 7583 | 6368 | 30 | 30 | 0.40% | 0.47% | 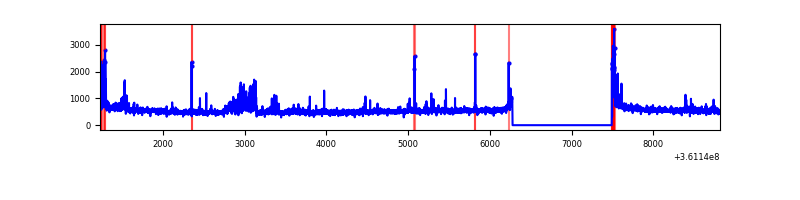 |
| D | 7583 | 6369 | 13 | 13 | 0.17% | 0.20% |  |
Top three noisy pixels from each quadrant. If the there are fewer than three noisy pixels in the level2.evt file, extra rows are filled as -1
| Pixel properties | Quadrant properties | ||||||
|---|---|---|---|---|---|---|---|
| Quadrant | DetID | PixID | Counts | Sigma | Mean | Median | Sigma |
| A | 13 | 254 | 12013 | 68.07 | 824 | 810 | 164.6 |
| A | 3 | 137 | 8234 | 45.11 | 824 | 810 | 164.6 |
| A | 0 | 226 | 6831 | 36.58 | 824 | 810 | 164.6 |
| B | 6 | 36 | 5394128 | 38771.89 | 738 | 721 | 139.1 |
| B | 6 | 159 | 1676697 | 12048.18 | 738 | 721 | 139.1 |
| B | 5 | 255 | 20441 | 141.76 | 738 | 721 | 139.1 |
| C | 2 | 16 | 193507 | 1053.93 | 777 | 782 | 182.9 |
| C | 0 | 10 | 162646 | 885.17 | 777 | 782 | 182.9 |
| C | 14 | 238 | 145233 | 789.94 | 777 | 782 | 182.9 |
| D | 8 | 195 | 674328 | 3652.58 | 781 | 765 | 184.4 |
| D | 12 | 218 | 49123 | 262.23 | 781 | 765 | 184.4 |
| D | 2 | 250 | 38487 | 204.56 | 781 | 765 | 184.4 |
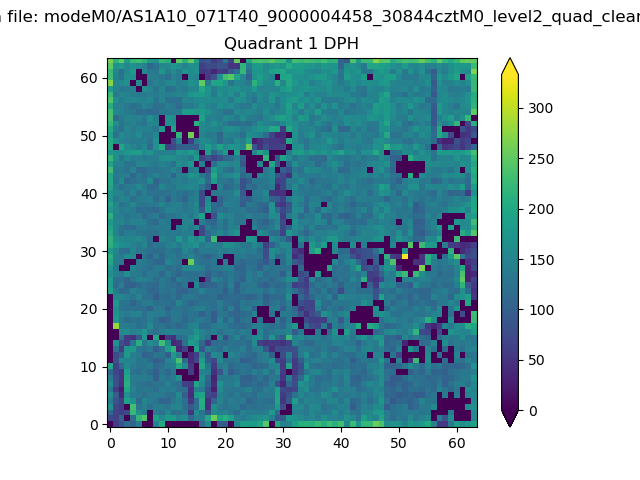
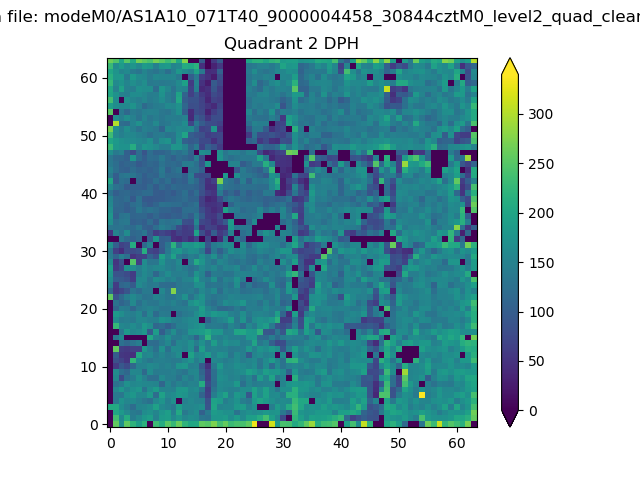
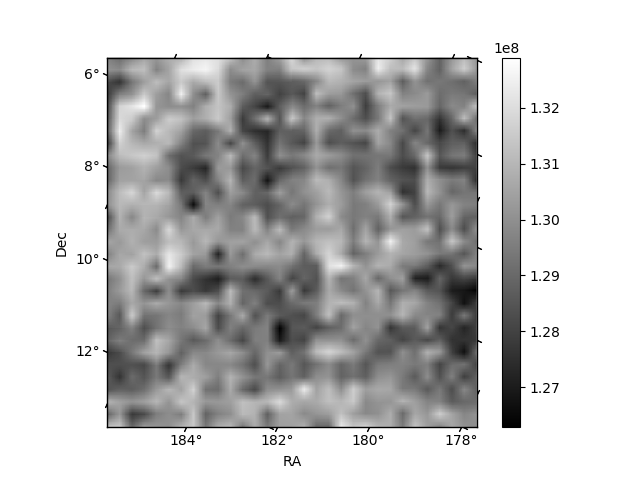
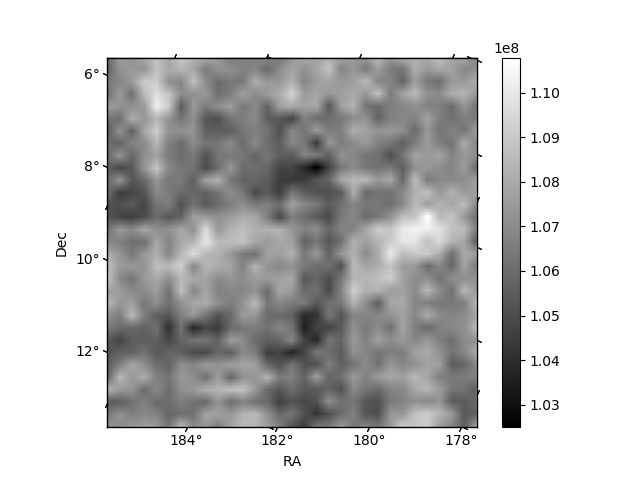
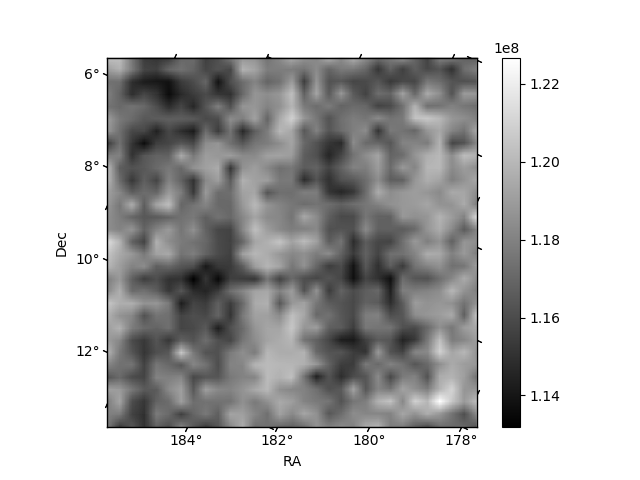
Histogram calculated using DETX and DETY for each event in the final _common_clean file
| Quadrant A |  |
 |
Quadrant B |
|---|---|---|---|
| Quadrant D | 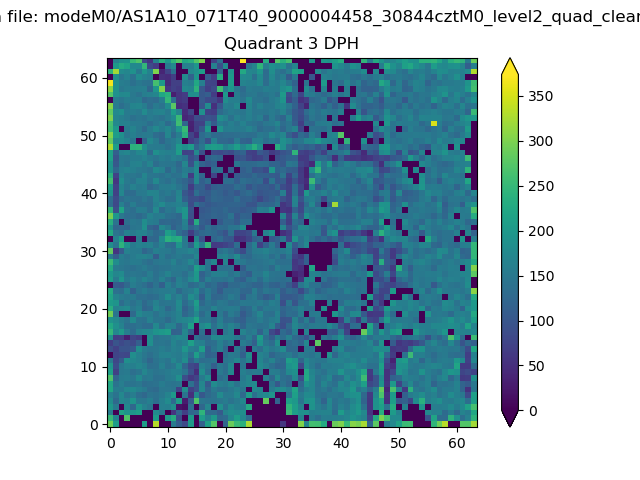 |
 |
Quadrant C |
| Plot type | Count rate plots | Images |
|---|---|---|
| Comparison with Poisson distribution Blue bars denote a histogram of data divided into 1 sec bins. Red curve is a Poisson curve with rate = median count rate of data. |
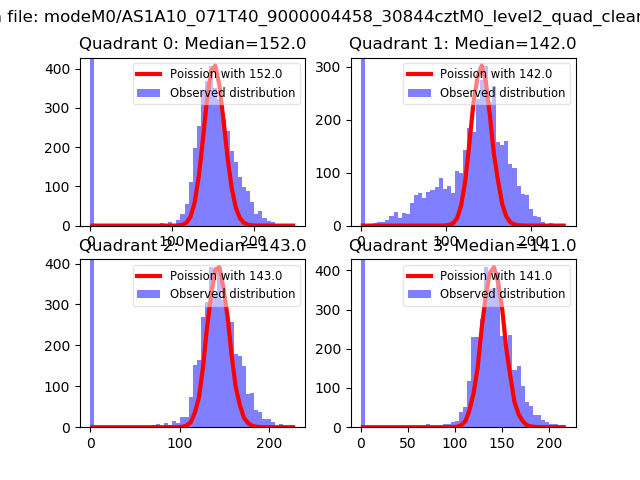 |
 |
| Quadrant-wise count rates Data is divided into 100 sec bins |
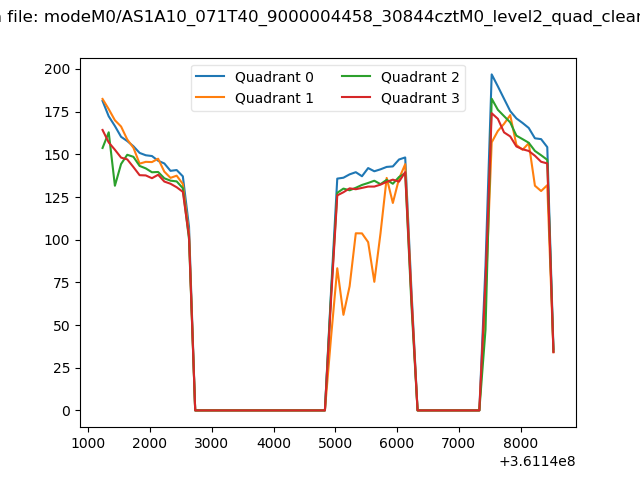 |
|
| Module-wise count rates for Quadrant A Data is divided into 100 sec bins |
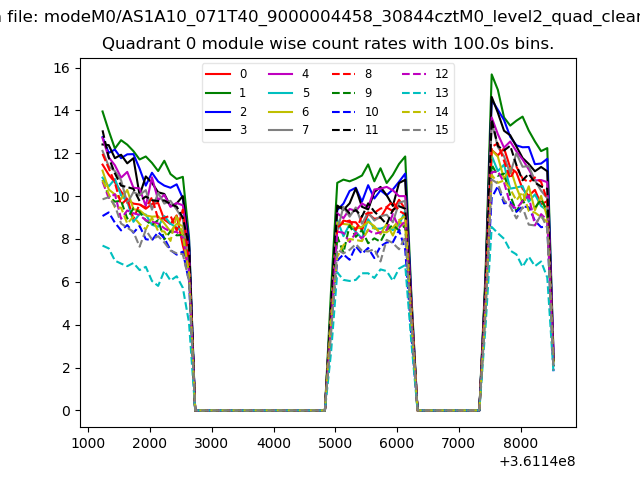 |
 |
| Module-wise count rates for Quadrant B Data is divided into 100 sec bins |
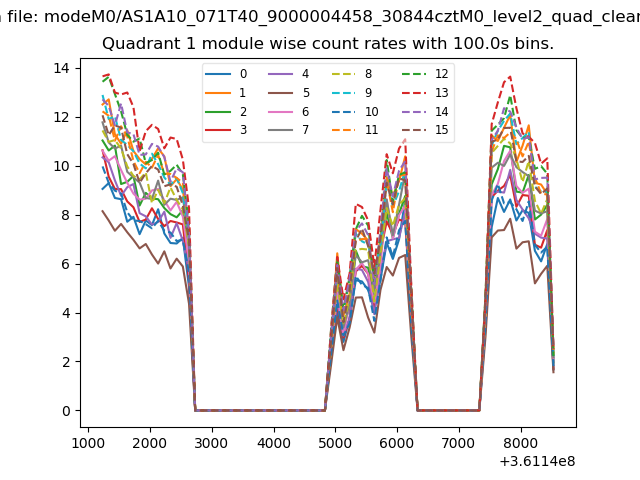 |
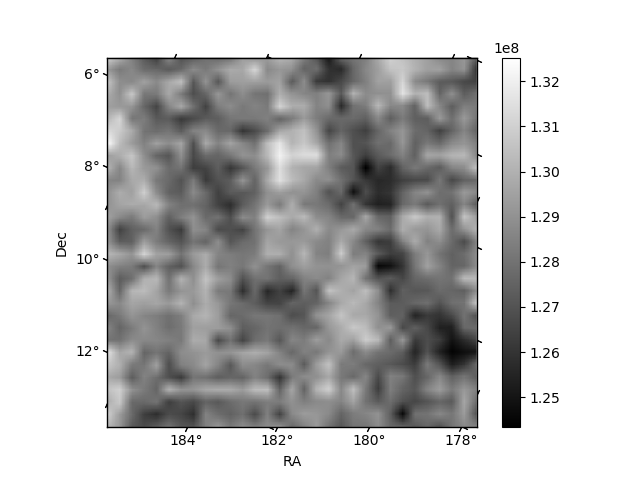 |
| Module-wise count rates for Quadrant C Data is divided into 100 sec bins |
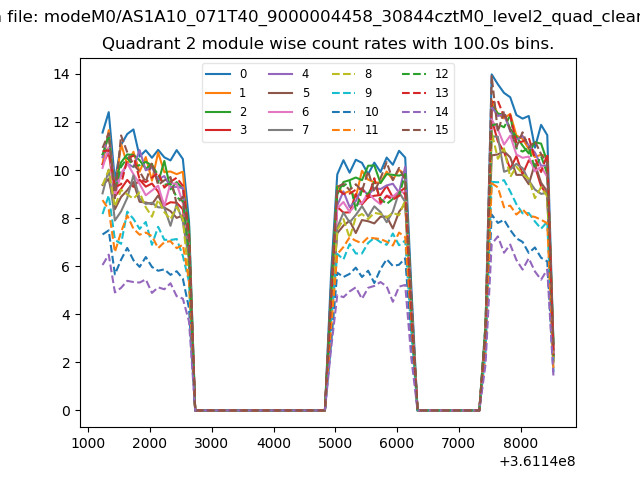 |
 |
| Module-wise count rates for Quadrant D Data is divided into 100 sec bins |
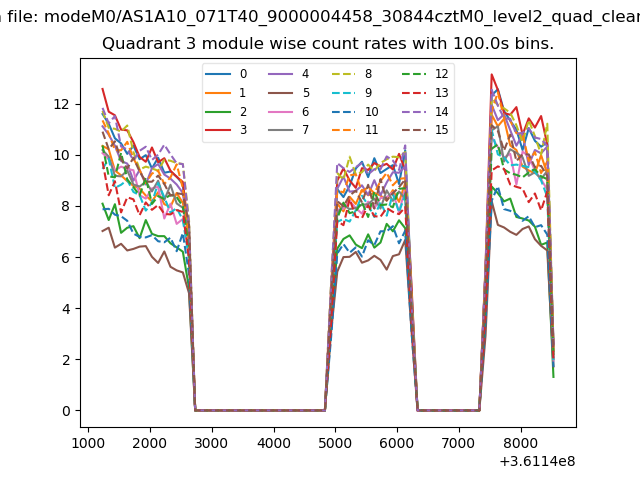 |
 |
| Parameter | Plot |
|---|---|
| CZT HV Monitor | 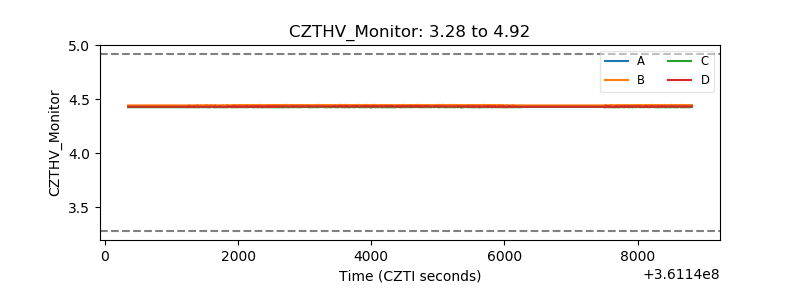 |
| D_VDD | 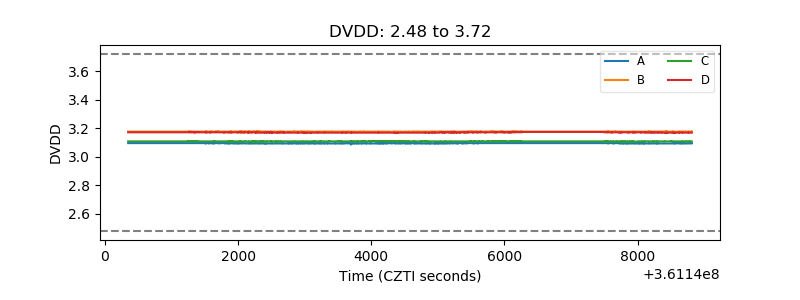 |
| Temperature 1 | 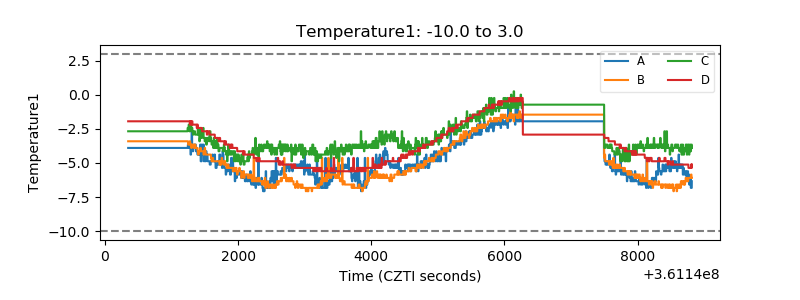 |
| Veto HV Monitor | 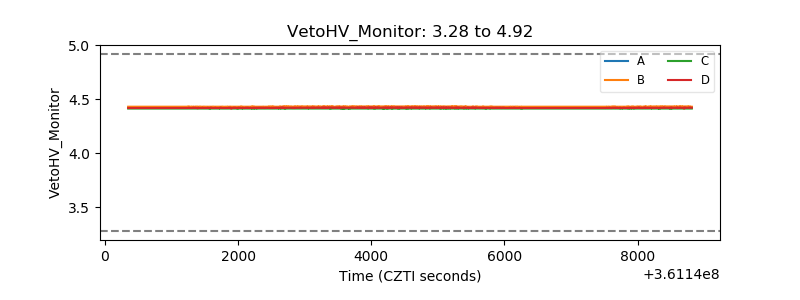 |
| Veto LLD | 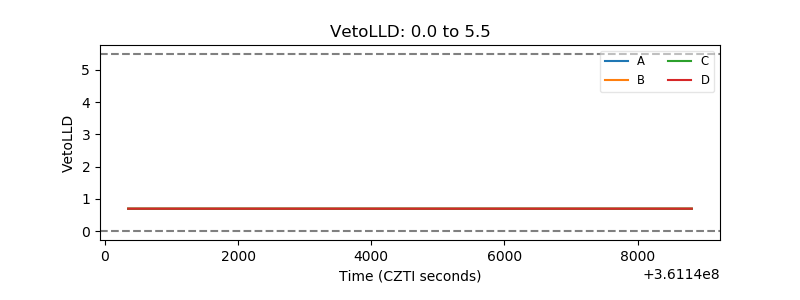 |
| Alpha Counter | 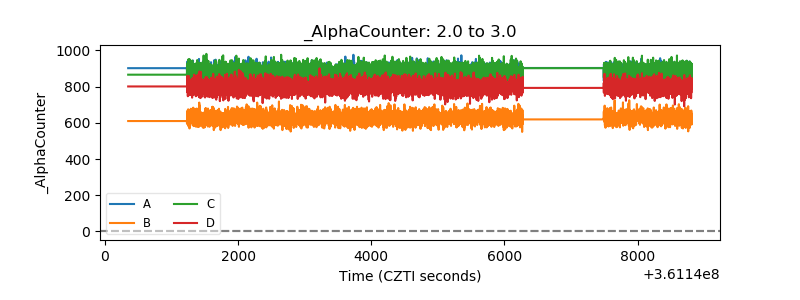 |
| _CPM_Rate | 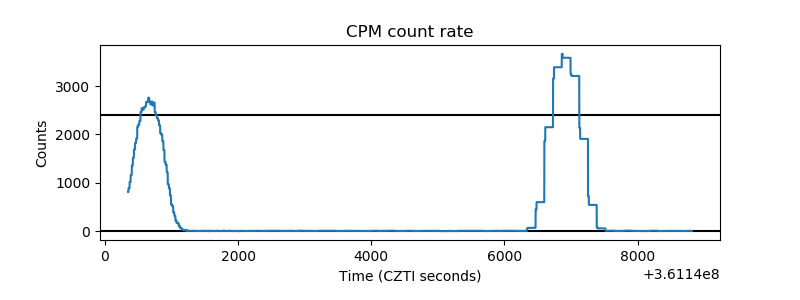 |
| CZT Counter |  |
| +2.5 Volts monitor |  |
| +5 Volts monitor |  |
| _ROLL_ROT | 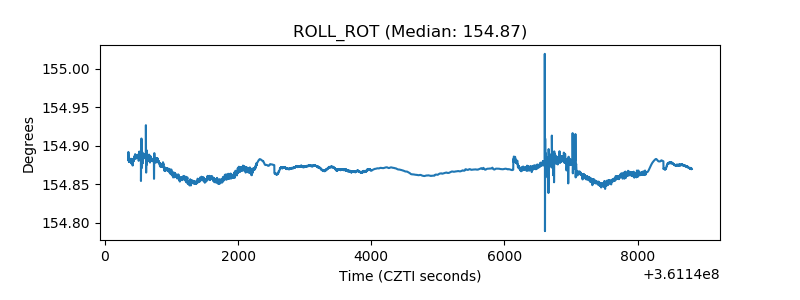 |
| _Roll_DEC | 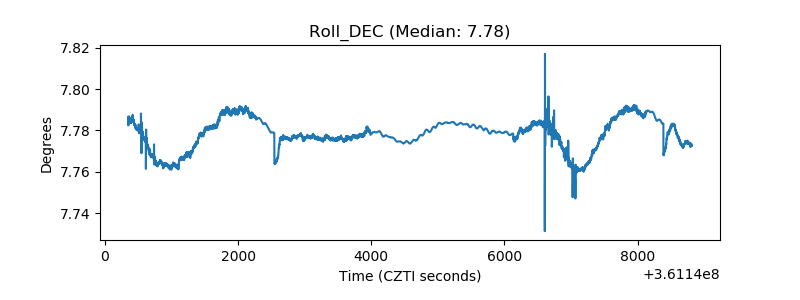 |
| _Roll_RA | 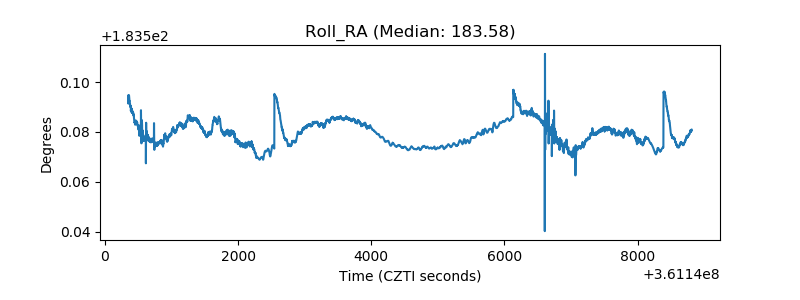 |
| Veto Counter | 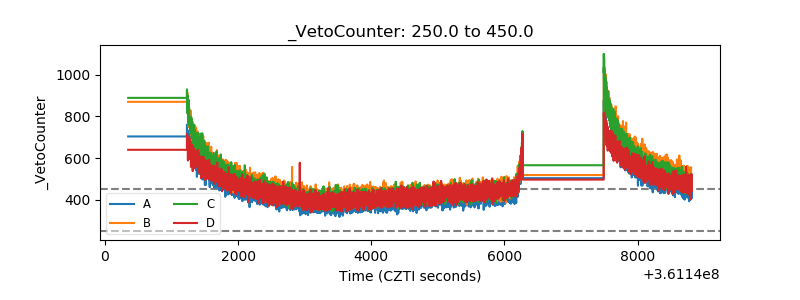 |