| Param | Original file | Final file |
|---|---|---|
| Filename | modeM0/AS1A10_071T40_9000004458_30845cztM0_level2.evt | modeM0/AS1A10_071T40_9000004458_30845cztM0_level2_quad_clean.evt |
| Size (bytes) | 763,427,520 | 79,580,160 |
| Size | 728.1 MB | 75.9 MB |
| Events in quadrant A | 3,301,337 | 552,466 |
| Events in quadrant B | 11,186,922 | 405,669 |
| Events in quadrant C | 3,787,854 | 508,331 |
| Events in quadrant D | 4,419,251 | 503,241 |
| Mode M0 | |||
|---|---|---|---|
| Quadrant | BADHDUFLAG | Total packets | Discarded packets |
| A | 0 | 13452 | 2 |
| B | 0 | 37445 | 2 |
| C | 0 | 15129 | 2 |
| D | 0 | 17322 | 2 |
| Mode SS | |||
|---|---|---|---|
| Quadrant | BADHDUFLAG | Total packets | Discarded packets |
| A | 0 | 130 | 0 |
| B | 0 | 130 | 0 |
| C | 0 | 130 | 0 |
| D | 0 | 130 | 0 |
| Mode M9 | |||
|---|---|---|---|
| Quadrant | BADHDUFLAG | Total packets | Discarded packets |
| A | 0 | 18 | 0 |
| B | 0 | 19 | 0 |
| C | 0 | 19 | 0 |
| D | 0 | 19 | 0 |
| Quadrant | Total seconds | Saturated seconds | Saturation percentage |
|---|---|---|---|
| A | 6281 | 35 | 0.557236% |
| B | 6281 | 3443 | 54.816112% |
| C | 6281 | 185 | 2.945391% |
| D | 6281 | 294 | 4.680783% |
Noise dominated data is calculated using 1-second bins in cleaned event files. If a bin has >2000 counts, and if more than 50% of those come from <1% of pixels, then it is considered to be noise-dominated and hence unusable.
| Quadrant | # 1 sec bins | Bins with >0 counts | Bins with >2000 counts | High rate bins dominated by noise | Noise dominated (total time) | Noise dominated (detector-on time) | Marked lightcurve |
|---|---|---|---|---|---|---|---|
| A | 7561 | 6282 | 0 | 0 | 0.00% | 0.00% | 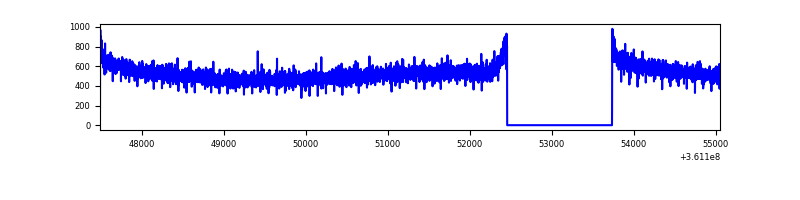 |
| B | 7561 | 6281 | 2988 | 2988 | 39.52% | 47.57% | 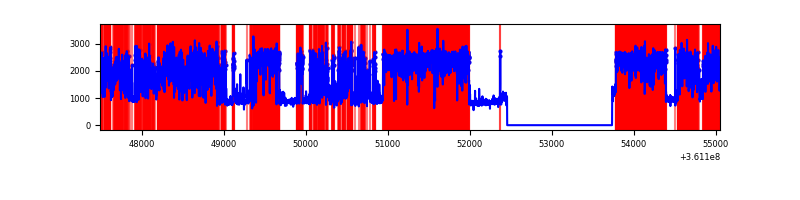 |
| C | 7561 | 6281 | 56 | 56 | 0.74% | 0.89% |  |
| D | 7561 | 6282 | 242 | 242 | 3.20% | 3.85% | 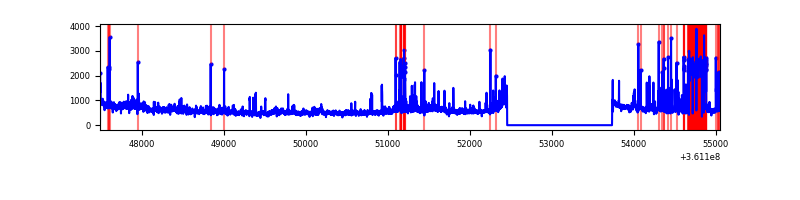 |
Top three noisy pixels from each quadrant. If the there are fewer than three noisy pixels in the level2.evt file, extra rows are filled as -1
| Pixel properties | Quadrant properties | ||||||
|---|---|---|---|---|---|---|---|
| Quadrant | DetID | PixID | Counts | Sigma | Mean | Median | Sigma |
| A | 13 | 254 | 11526 | 62.87 | 856 | 842 | 169.9 |
| A | 3 | 137 | 8089 | 42.64 | 856 | 842 | 169.9 |
| A | 0 | 226 | 7240 | 37.65 | 856 | 842 | 169.9 |
| B | 6 | 36 | 6850590 | 52688.55 | 696 | 680 | 130.0 |
| B | 6 | 159 | 1527397 | 11743.29 | 696 | 680 | 130.0 |
| B | 5 | 255 | 30755 | 231.33 | 696 | 680 | 130.0 |
| C | 0 | 10 | 226967 | 1204.97 | 802 | 809 | 187.7 |
| C | 3 | 233 | 207031 | 1098.75 | 802 | 809 | 187.7 |
| C | 14 | 238 | 133055 | 704.61 | 802 | 809 | 187.7 |
| D | 8 | 195 | 670179 | 3660.21 | 781 | 765 | 182.9 |
| D | 13 | 174 | 636254 | 3474.71 | 781 | 765 | 182.9 |
| D | 12 | 233 | 40732 | 218.53 | 781 | 765 | 182.9 |
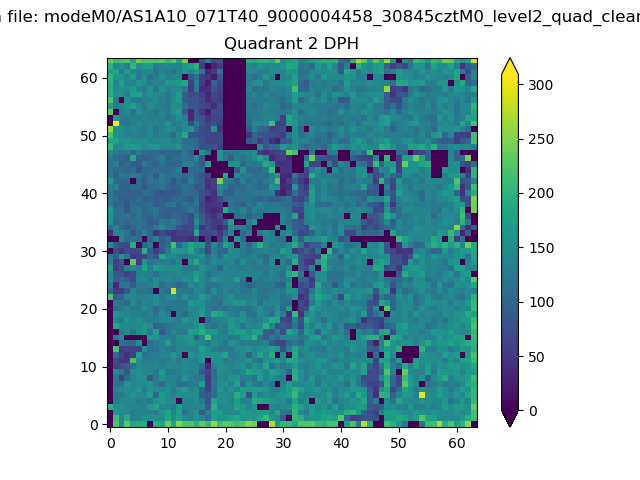
Histogram calculated using DETX and DETY for each event in the final _common_clean file
| Quadrant A | 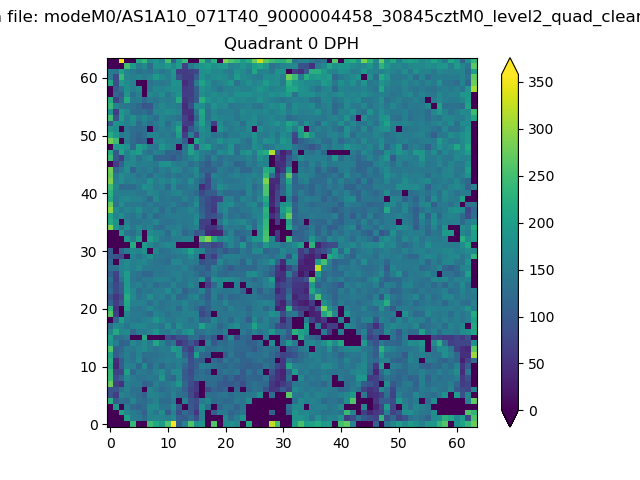 |
 |
Quadrant B |
|---|---|---|---|
| Quadrant D |  |
 |
Quadrant C |
| Plot type | Count rate plots | Images |
|---|---|---|
| Comparison with Poisson distribution Blue bars denote a histogram of data divided into 1 sec bins. Red curve is a Poisson curve with rate = median count rate of data. |
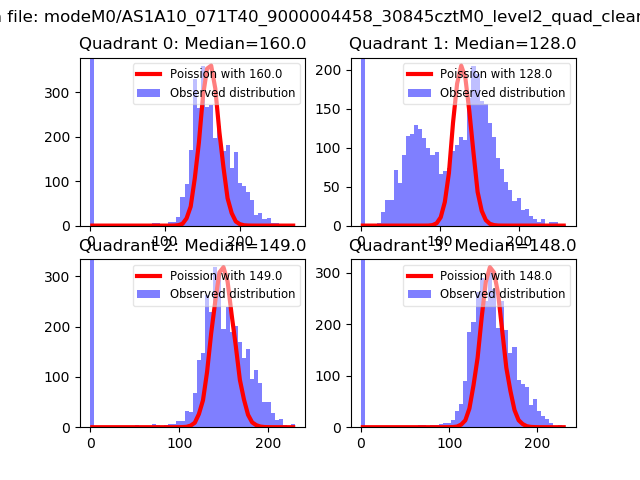 |
 |
| Quadrant-wise count rates Data is divided into 100 sec bins |
 |
|
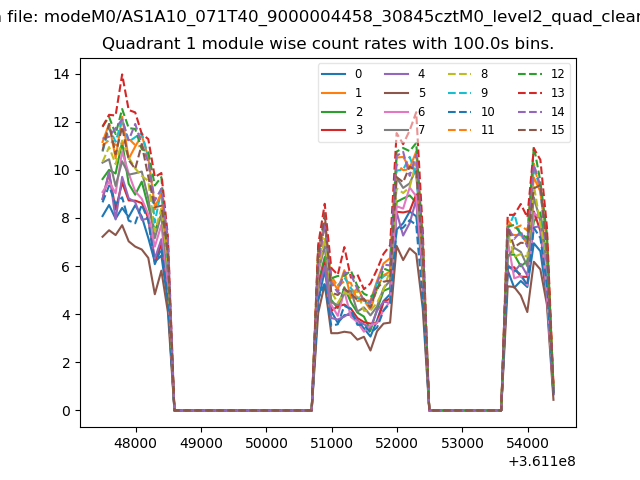
| Module-wise count rates for Quadrant A Data is divided into 100 sec bins |
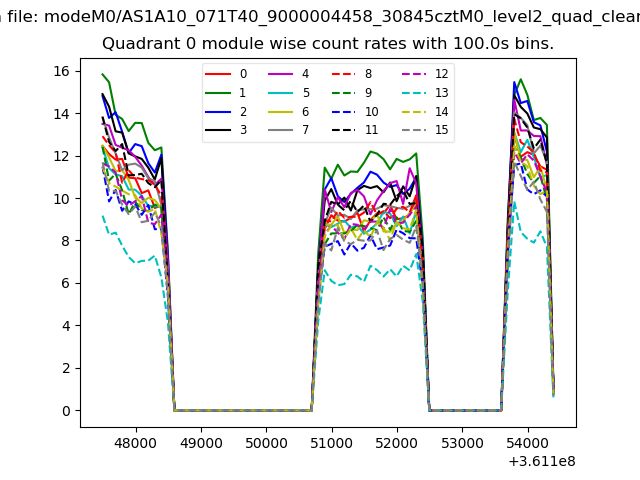 |
 |
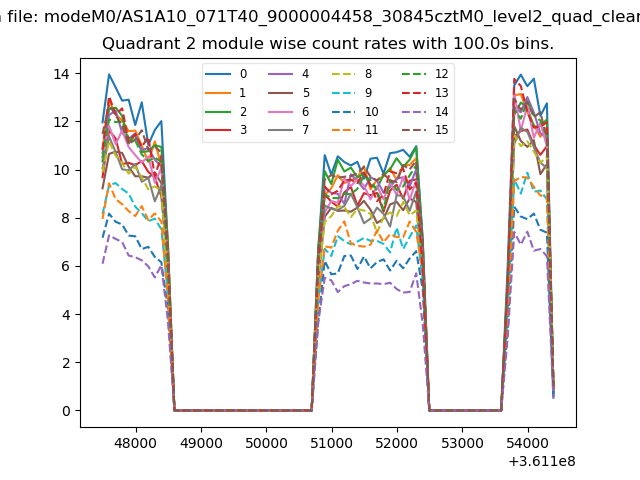
| Module-wise count rates for Quadrant B Data is divided into 100 sec bins |
 |
 |
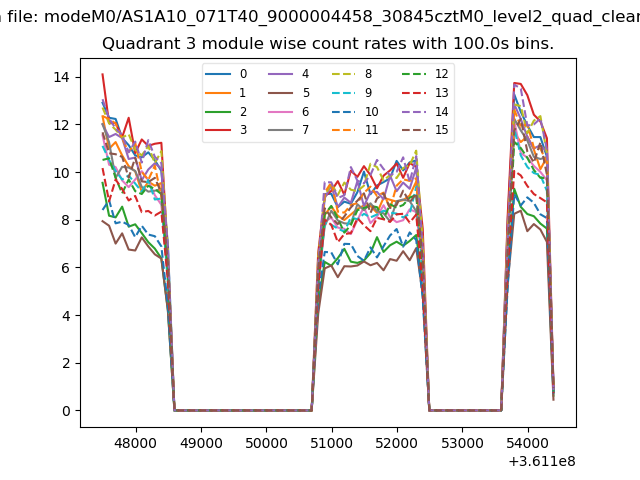
| Module-wise count rates for Quadrant C Data is divided into 100 sec bins |
 |
 |
| Module-wise count rates for Quadrant D Data is divided into 100 sec bins |
 |
 |
| Parameter | Plot |
|---|---|
| CZT HV Monitor | 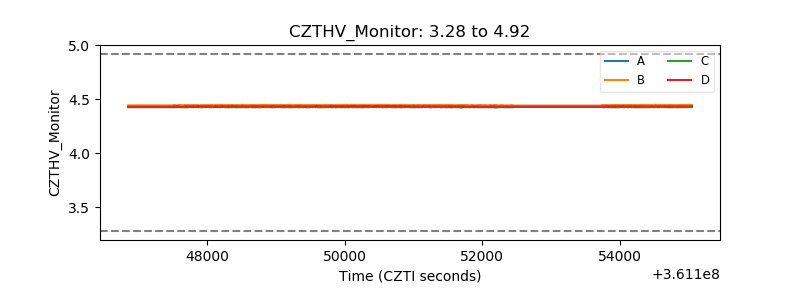 |
| D_VDD | 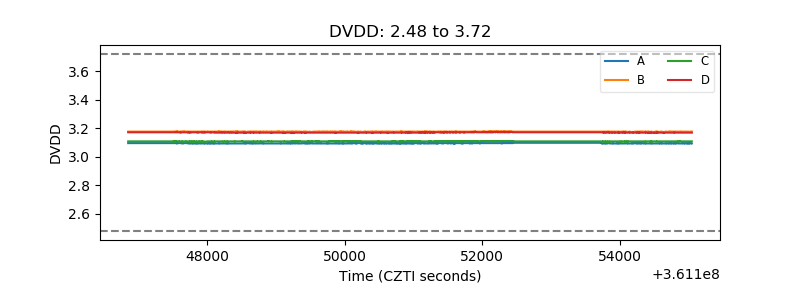 |
| Temperature 1 | 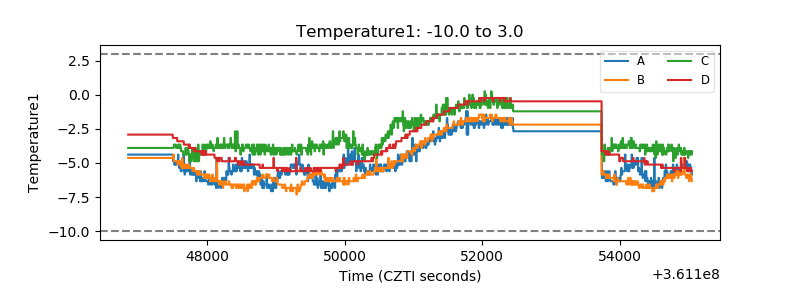 |
| Veto HV Monitor | 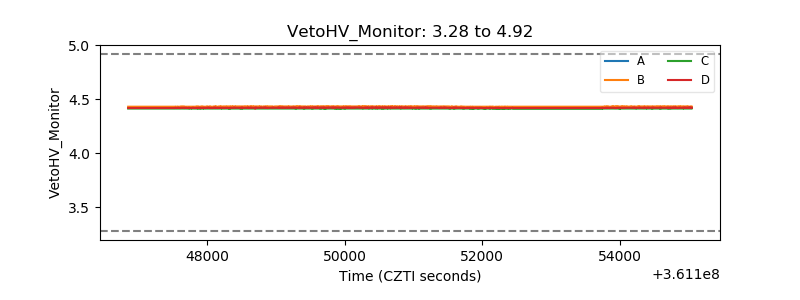 |
| Veto LLD | 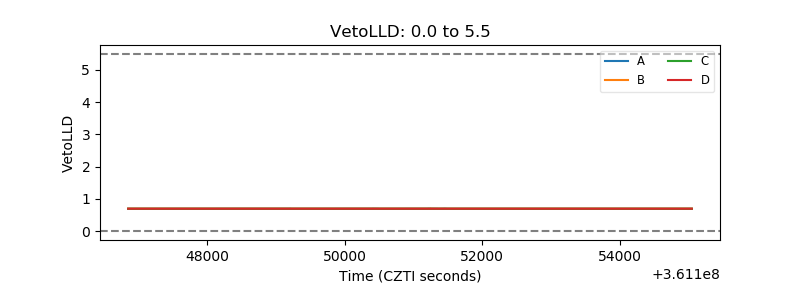 |
| Alpha Counter | 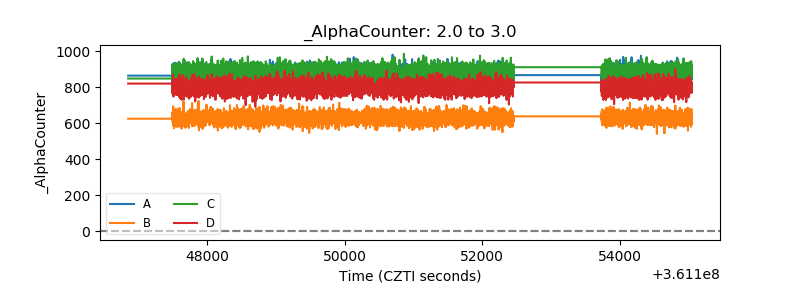 |
| _CPM_Rate | 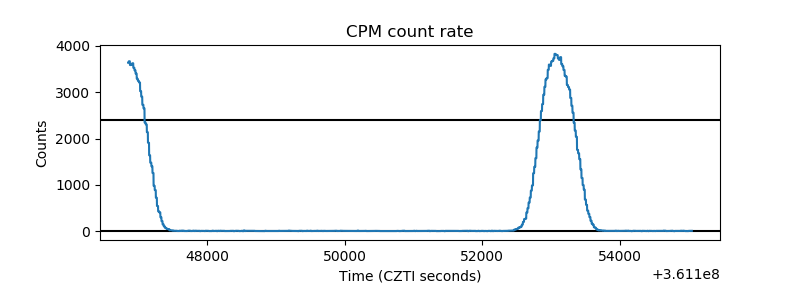 |
| CZT Counter | 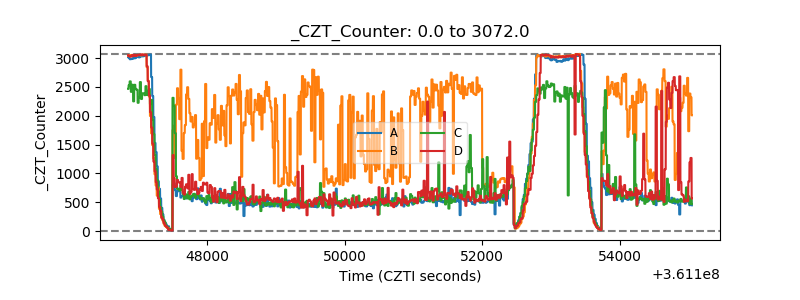 |
| +2.5 Volts monitor |  |
| +5 Volts monitor |  |
| _ROLL_ROT | 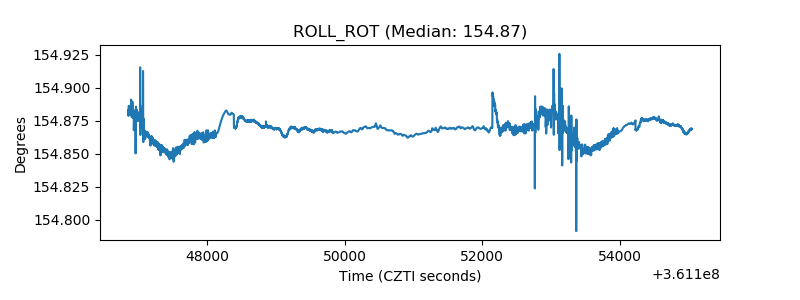 |
| _Roll_DEC | 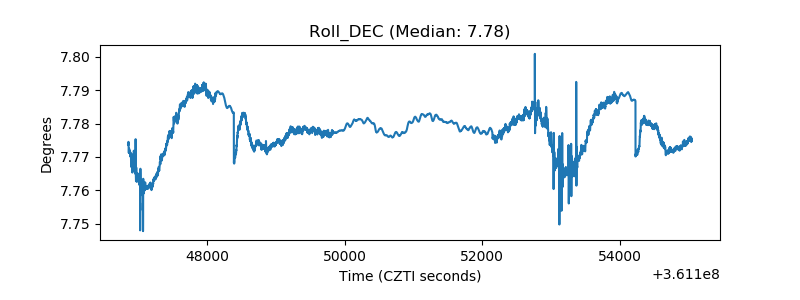 |
| _Roll_RA | 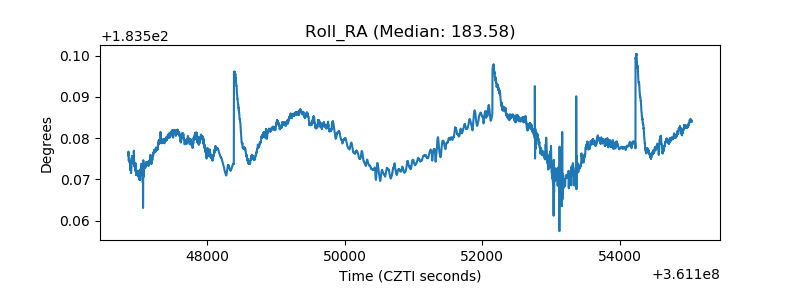 |
| Veto Counter | 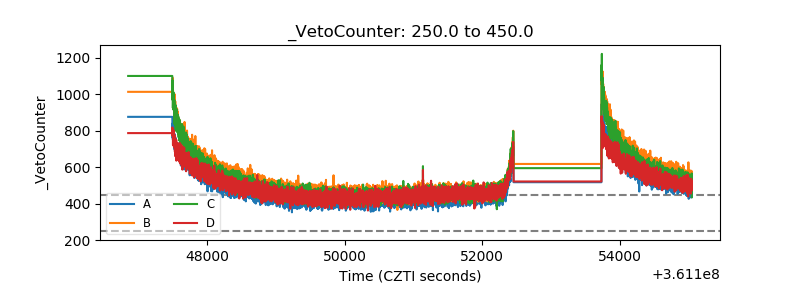 |