| Param | Original file | Final file |
|---|---|---|
| Filename | modeM0/AS1A10_071T40_9000004458_30846cztM0_level2.evt | modeM0/AS1A10_071T40_9000004458_30846cztM0_level2_quad_clean.evt |
| Size (bytes) | 764,256,960 | 70,914,240 |
| Size | 728.9 MB | 67.6 MB |
| Events in quadrant A | 3,366,212 | 476,228 |
| Events in quadrant B | 11,084,038 | 367,786 |
| Events in quadrant C | 3,681,341 | 436,896 |
| Events in quadrant D | 4,594,445 | 432,378 |
| Mode M0 | |||
|---|---|---|---|
| Quadrant | BADHDUFLAG | Total packets | Discarded packets |
| A | 0 | 13516 | 2 |
| B | 0 | 37119 | 2 |
| C | 0 | 14559 | 3 |
| D | 0 | 17703 | 2 |
| Mode SS | |||
|---|---|---|---|
| Quadrant | BADHDUFLAG | Total packets | Discarded packets |
| A | 0 | 126 | 0 |
| B | 0 | 126 | 0 |
| C | 0 | 126 | 0 |
| D | 0 | 126 | 0 |
| Mode M9 | |||
|---|---|---|---|
| Quadrant | BADHDUFLAG | Total packets | Discarded packets |
| A | 0 | 18 | 0 |
| B | 0 | 19 | 0 |
| C | 0 | 19 | 0 |
| D | 0 | 19 | 0 |
| Quadrant | Total seconds | Saturated seconds | Saturation percentage |
|---|---|---|---|
| A | 6205 | 25 | 0.402901% |
| B | 6205 | 3592 | 57.888799% |
| C | 6204 | 167 | 2.691812% |
| D | 6204 | 318 | 5.125725% |
Noise dominated data is calculated using 1-second bins in cleaned event files. If a bin has >2000 counts, and if more than 50% of those come from <1% of pixels, then it is considered to be noise-dominated and hence unusable.
| Quadrant | # 1 sec bins | Bins with >0 counts | Bins with >2000 counts | High rate bins dominated by noise | Noise dominated (total time) | Noise dominated (detector-on time) | Marked lightcurve |
|---|---|---|---|---|---|---|---|
| A | 7560 | 6206 | 0 | 0 | 0.00% | 0.00% | 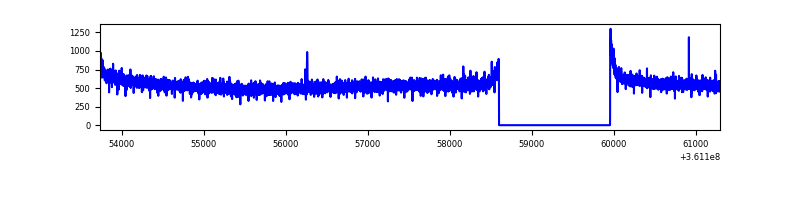 |
| B | 7559 | 6205 | 2777 | 2777 | 36.74% | 44.75% | 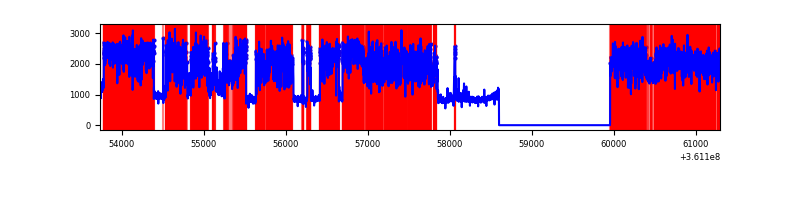 |
| C | 7559 | 6205 | 63 | 63 | 0.83% | 1.02% | 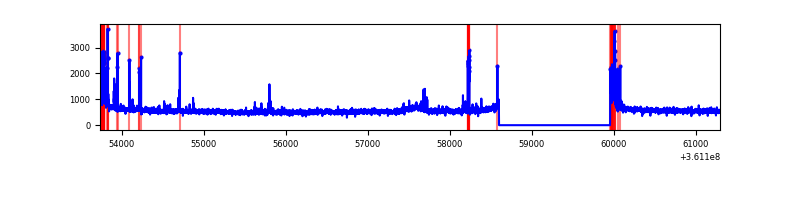 |
| D | 7559 | 6205 | 295 | 295 | 3.90% | 4.75% | 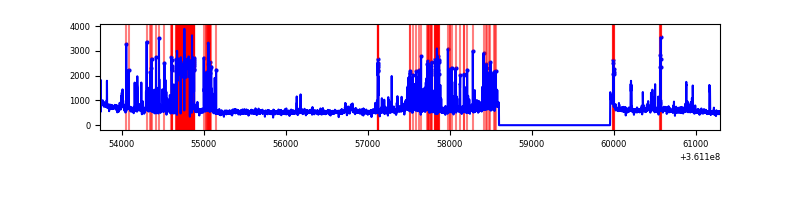 |
Top three noisy pixels from each quadrant. If the there are fewer than three noisy pixels in the level2.evt file, extra rows are filled as -1
| Pixel properties | Quadrant properties | ||||||
|---|---|---|---|---|---|---|---|
| Quadrant | DetID | PixID | Counts | Sigma | Mean | Median | Sigma |
| A | 13 | 254 | 11229 | 60.36 | 872 | 860 | 171.8 |
| A | 3 | 137 | 7888 | 40.91 | 872 | 860 | 171.8 |
| A | 0 | 226 | 7602 | 39.25 | 872 | 860 | 171.8 |
| B | 6 | 36 | 6632876 | 48921.49 | 726 | 711 | 135.6 |
| B | 6 | 159 | 1505246 | 11098.05 | 726 | 711 | 135.6 |
| B | 5 | 172 | 36600 | 264.73 | 726 | 711 | 135.6 |
| C | 0 | 10 | 300666 | 1597.99 | 811 | 820 | 187.6 |
| C | 14 | 238 | 134174 | 710.69 | 811 | 820 | 187.6 |
| C | 3 | 233 | 45245 | 236.76 | 811 | 820 | 187.6 |
| D | 13 | 174 | 613531 | 3313.6 | 789 | 773 | 184.9 |
| D | 8 | 195 | 607102 | 3278.83 | 789 | 773 | 184.9 |
| D | 1 | 52 | 220111 | 1186.11 | 789 | 773 | 184.9 |
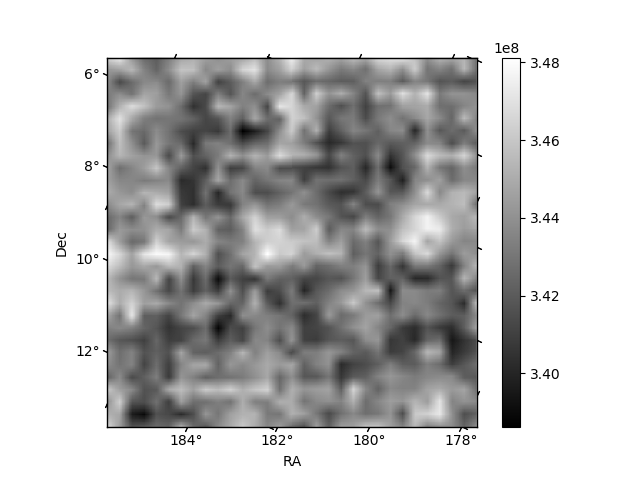
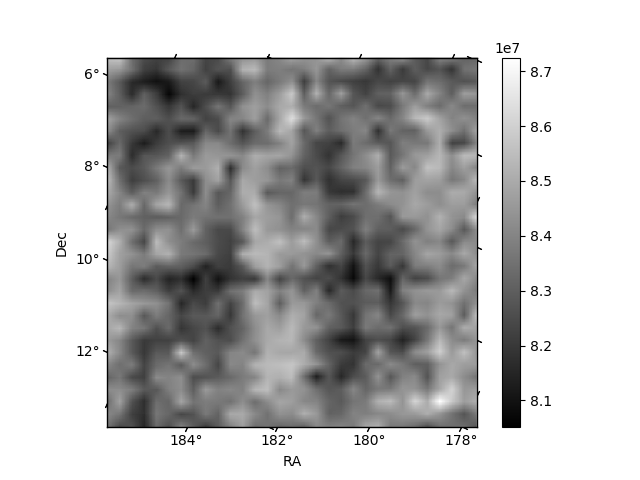
Histogram calculated using DETX and DETY for each event in the final _common_clean file
| Quadrant A |  |
 |
Quadrant B |
|---|---|---|---|
| Quadrant D |  |
 |
Quadrant C |
| Plot type | Count rate plots | Images |
|---|---|---|
| Comparison with Poisson distribution Blue bars denote a histogram of data divided into 1 sec bins. Red curve is a Poisson curve with rate = median count rate of data. |
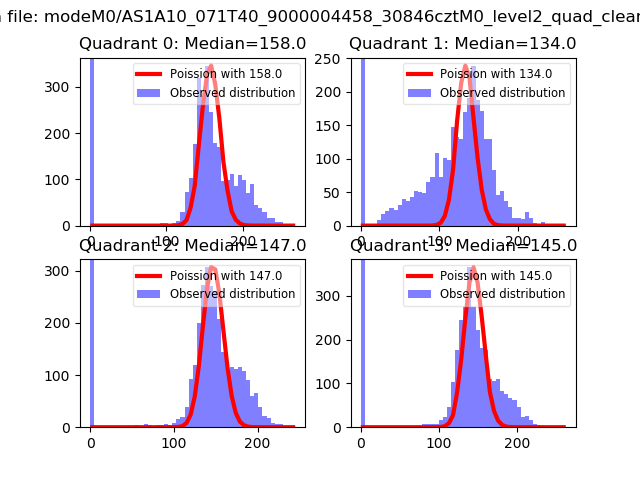 |
 |
| Quadrant-wise count rates Data is divided into 100 sec bins |
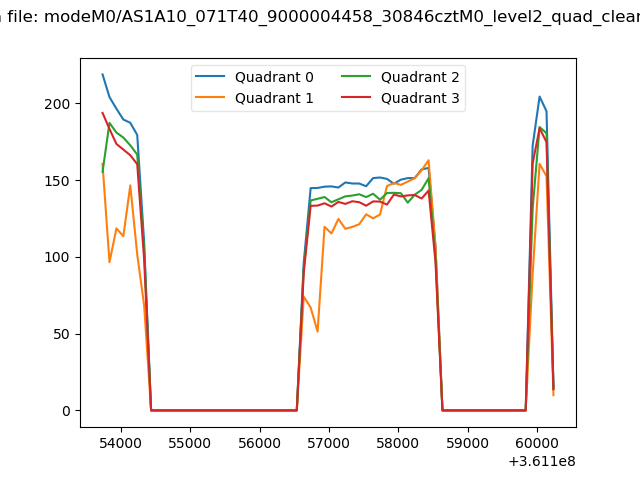 |
|
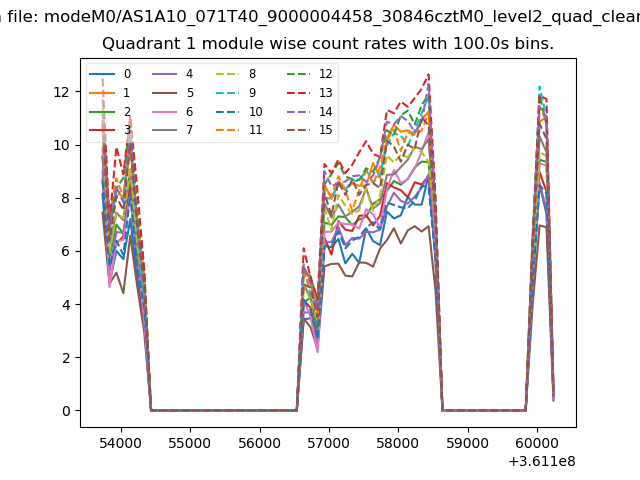
| Module-wise count rates for Quadrant A Data is divided into 100 sec bins |
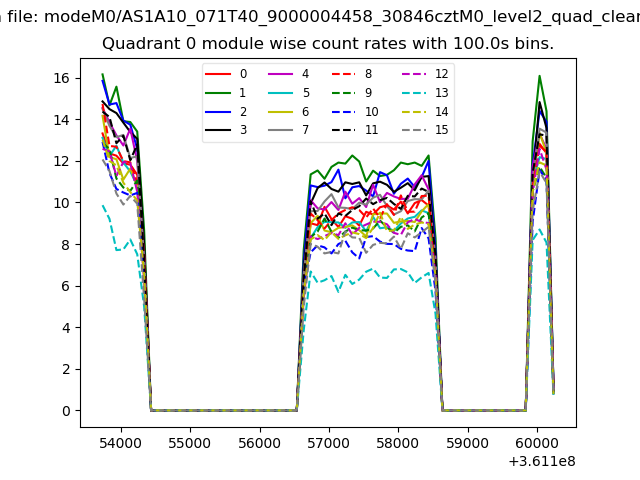 |
 |
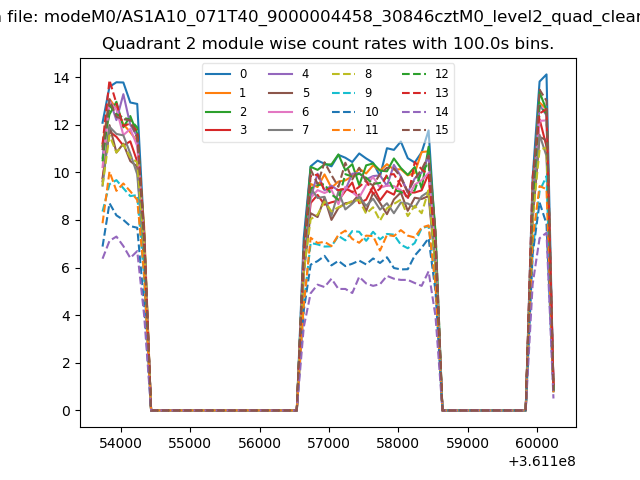
| Module-wise count rates for Quadrant B Data is divided into 100 sec bins |
 |
 |
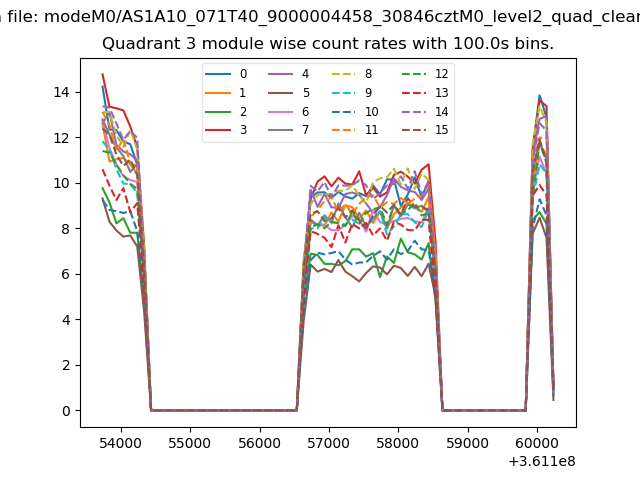
| Module-wise count rates for Quadrant C Data is divided into 100 sec bins |
 |
 |
| Module-wise count rates for Quadrant D Data is divided into 100 sec bins |
 |
 |
| Parameter | Plot |
|---|---|
| CZT HV Monitor | 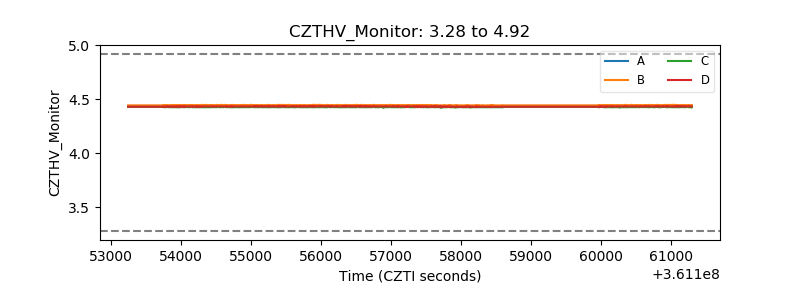 |
| D_VDD | 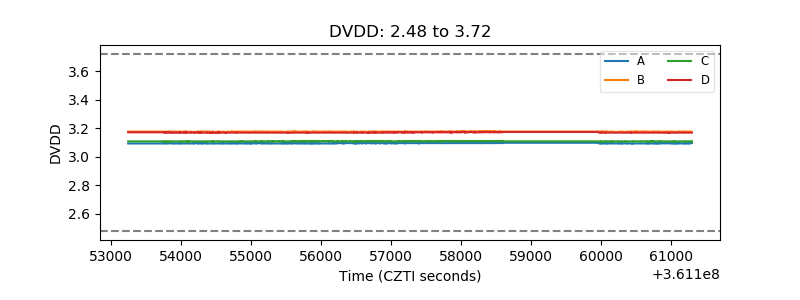 |
| Temperature 1 | 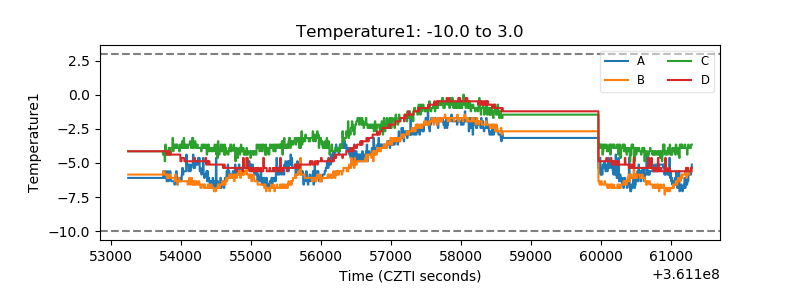 |
| Veto HV Monitor |  |
| Veto LLD | 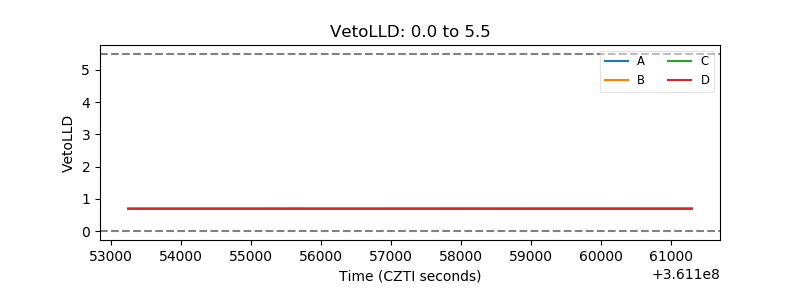 |
| Alpha Counter | 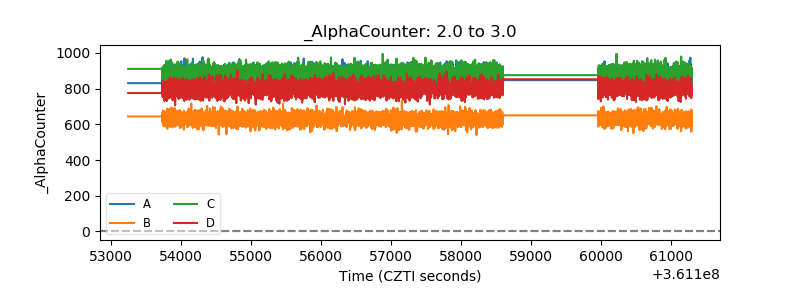 |
| _CPM_Rate | 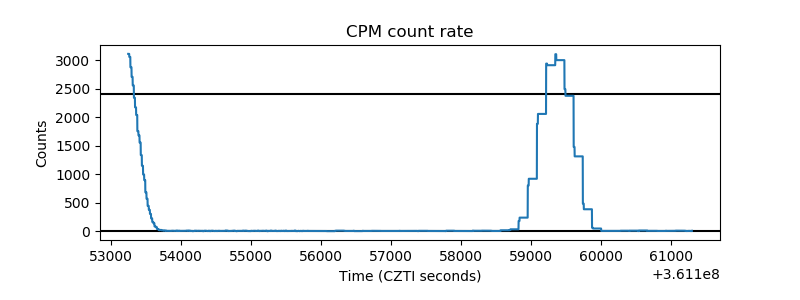 |
| CZT Counter |  |
| +2.5 Volts monitor |  |
| +5 Volts monitor |  |
| _ROLL_ROT | 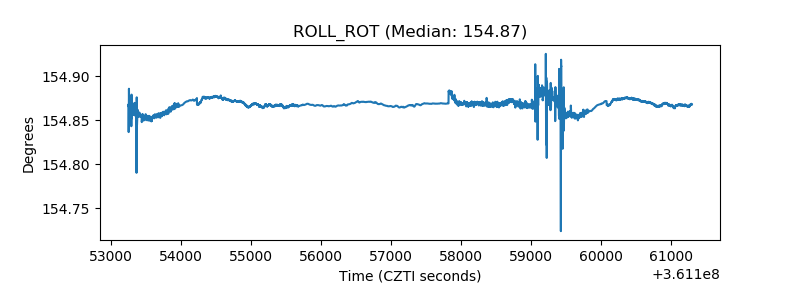 |
| _Roll_DEC | 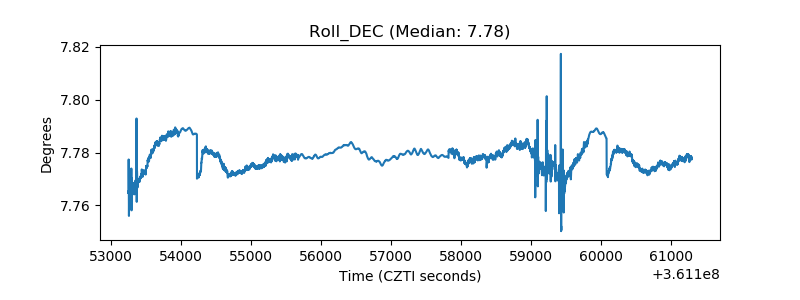 |
| _Roll_RA | 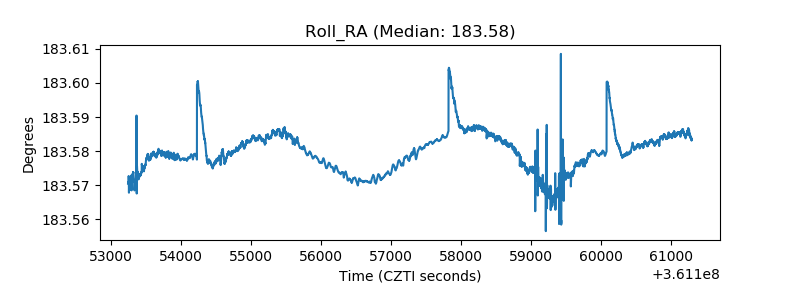 |
| Veto Counter | 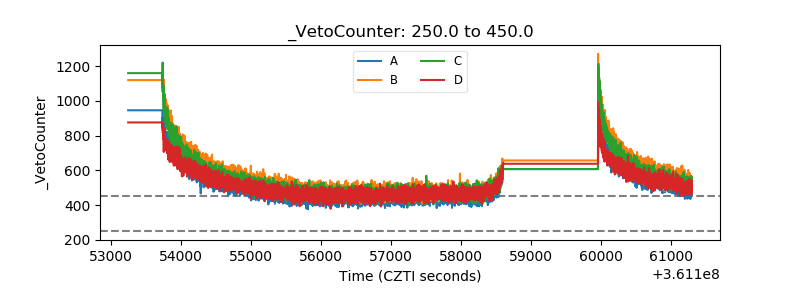 |