| Param | Original file | Final file |
|---|---|---|
| Filename | modeM0/AS1A10_071T40_9000004458_30847cztM0_level2.evt | modeM0/AS1A10_071T40_9000004458_30847cztM0_level2_quad_clean.evt |
| Size (bytes) | 810,783,360 | 63,927,360 |
| Size | 773.2 MB | 61.0 MB |
| Events in quadrant A | 3,639,964 | 415,309 |
| Events in quadrant B | 12,774,258 | 295,773 |
| Events in quadrant C | 3,715,474 | 388,067 |
| Events in quadrant D | 3,988,045 | 384,753 |
| Mode M0 | |||
|---|---|---|---|
| Quadrant | BADHDUFLAG | Total packets | Discarded packets |
| A | 0 | 14370 | 2 |
| B | 0 | 42378 | 8 |
| C | 0 | 14667 | 2 |
| D | 0 | 15948 | 2 |
| Mode SS | |||
|---|---|---|---|
| Quadrant | BADHDUFLAG | Total packets | Discarded packets |
| A | 0 | 130 | 0 |
| B | 0 | 130 | 0 |
| C | 0 | 130 | 0 |
| D | 0 | 130 | 0 |
| Mode M9 | |||
|---|---|---|---|
| Quadrant | BADHDUFLAG | Total packets | Discarded packets |
| A | 0 | 16 | 0 |
| B | 0 | 17 | 0 |
| C | 0 | 17 | 0 |
| D | 0 | 17 | 0 |
| Quadrant | Total seconds | Saturated seconds | Saturation percentage |
|---|---|---|---|
| A | 6463 | 97 | 1.500851% |
| B | 6462 | 4761 | 73.676880% |
| C | 6462 | 180 | 2.785515% |
| D | 6462 | 79 | 1.222532% |
Noise dominated data is calculated using 1-second bins in cleaned event files. If a bin has >2000 counts, and if more than 50% of those come from <1% of pixels, then it is considered to be noise-dominated and hence unusable.
| Quadrant | # 1 sec bins | Bins with >0 counts | Bins with >2000 counts | High rate bins dominated by noise | Noise dominated (total time) | Noise dominated (detector-on time) | Marked lightcurve |
|---|---|---|---|---|---|---|---|
| A | 7768 | 6465 | 26 | 26 | 0.33% | 0.40% | 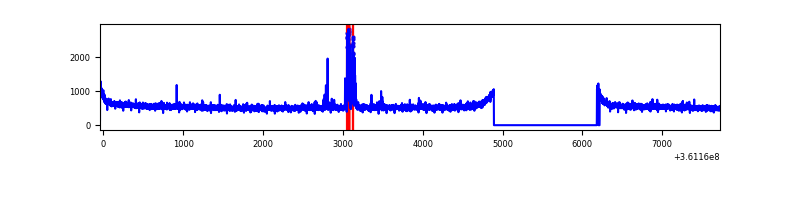 |
| B | 7767 | 6462 | 3190 | 3190 | 41.07% | 49.37% | 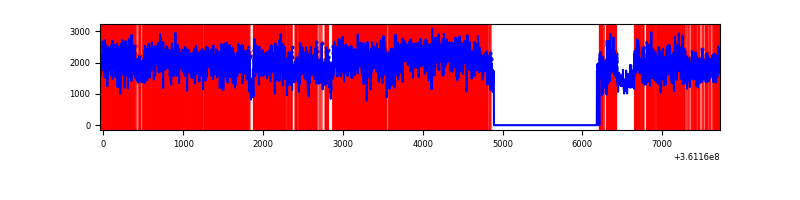 |
| C | 7767 | 6463 | 29 | 29 | 0.37% | 0.45% | 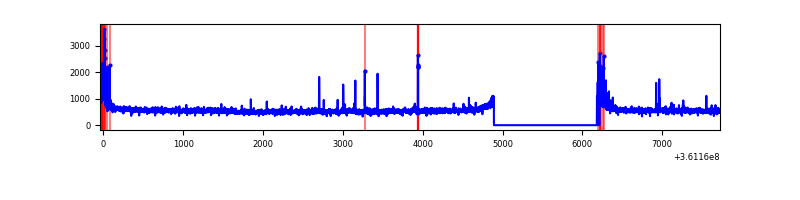 |
| D | 7767 | 6464 | 35 | 35 | 0.45% | 0.54% | 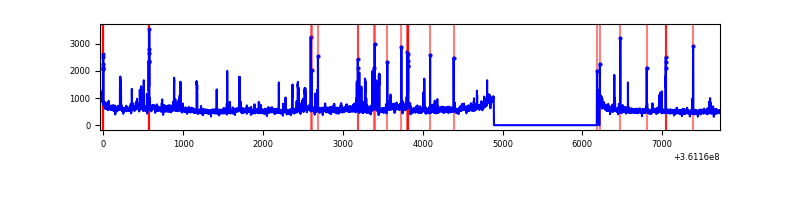 |
Top three noisy pixels from each quadrant. If the there are fewer than three noisy pixels in the level2.evt file, extra rows are filled as -1
| Pixel properties | Quadrant properties | ||||||
|---|---|---|---|---|---|---|---|
| Quadrant | DetID | PixID | Counts | Sigma | Mean | Median | Sigma |
| A | 0 | 31 | 134154 | 740.27 | 909 | 895 | 180.0 |
| A | 13 | 254 | 11943 | 61.37 | 909 | 895 | 180.0 |
| A | 3 | 137 | 8412 | 41.76 | 909 | 895 | 180.0 |
| B | 6 | 36 | 8234664 | 58480.97 | 747 | 731 | 140.8 |
| B | 6 | 159 | 1541740 | 10944.92 | 747 | 731 | 140.8 |
| B | 4 | 80 | 21843 | 149.95 | 747 | 731 | 140.8 |
| C | 0 | 10 | 158328 | 805.92 | 845 | 852 | 195.4 |
| C | 14 | 238 | 139536 | 709.75 | 845 | 852 | 195.4 |
| C | 3 | 233 | 92963 | 471.4 | 845 | 852 | 195.4 |
| D | 8 | 195 | 542614 | 2713.11 | 850 | 833 | 199.7 |
| D | 12 | 79 | 47065 | 231.52 | 850 | 833 | 199.7 |
| D | 2 | 250 | 40562 | 198.95 | 850 | 833 | 199.7 |
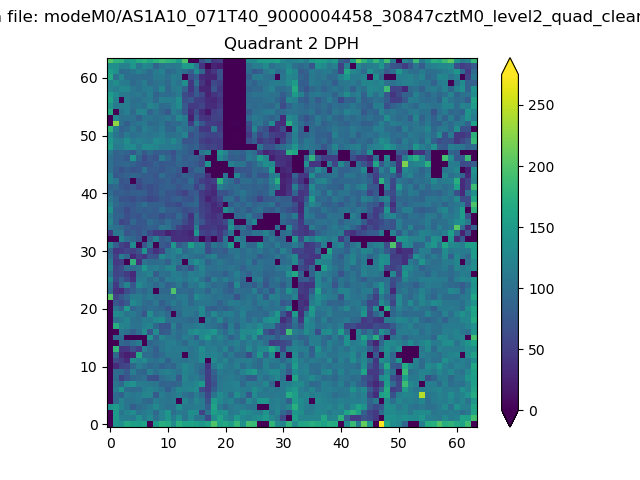
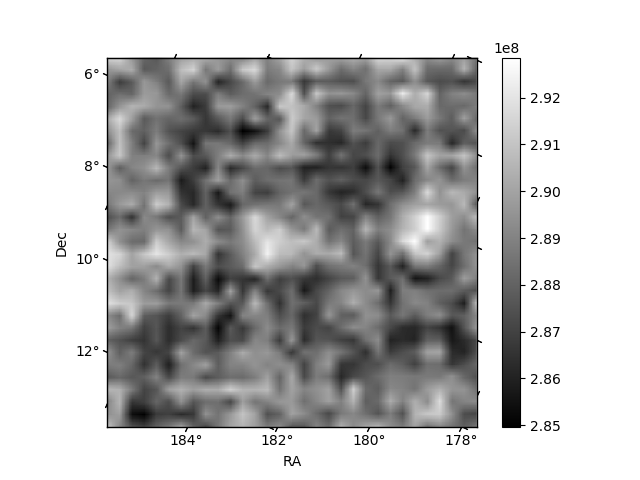
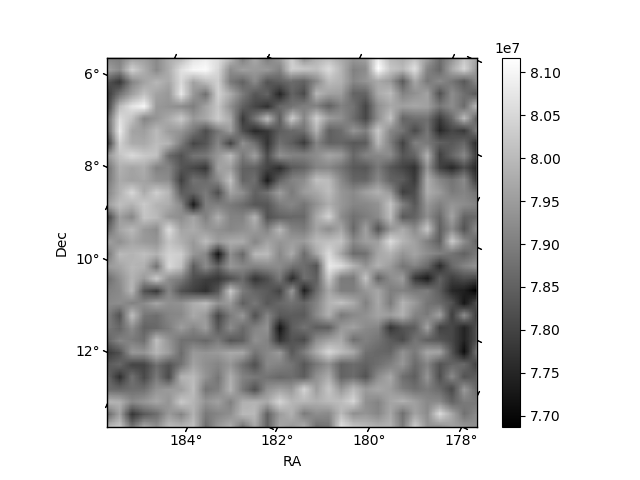
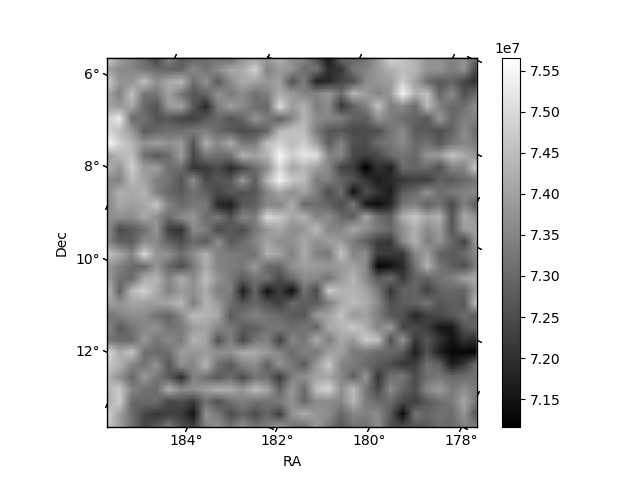
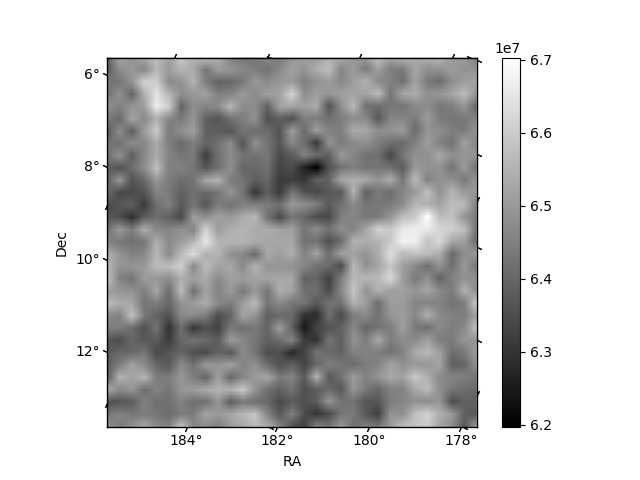
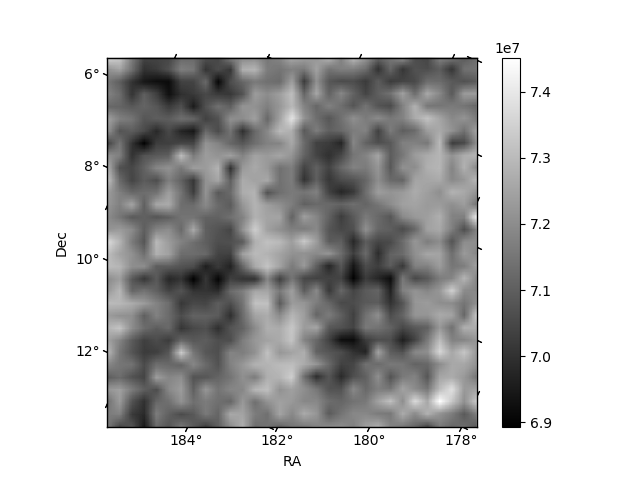
Histogram calculated using DETX and DETY for each event in the final _common_clean file
| Quadrant A | 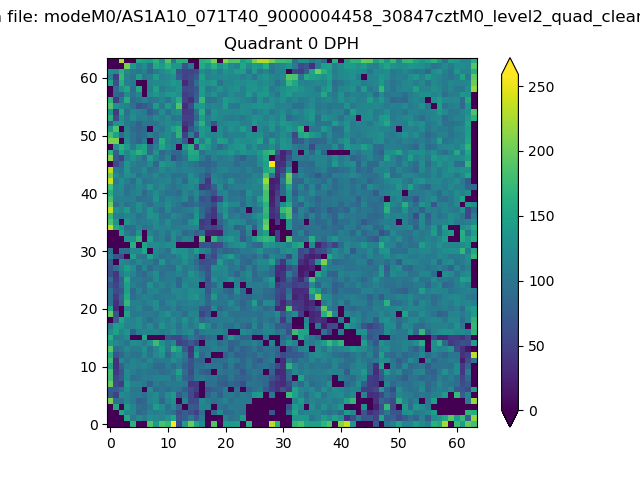 |
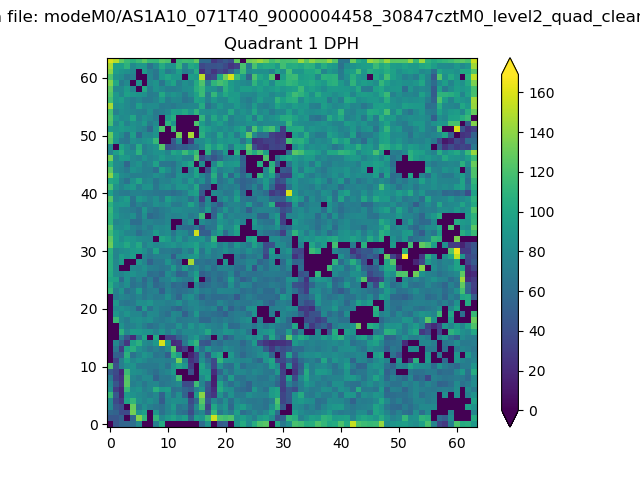 |
Quadrant B |
|---|---|---|---|
| Quadrant D | 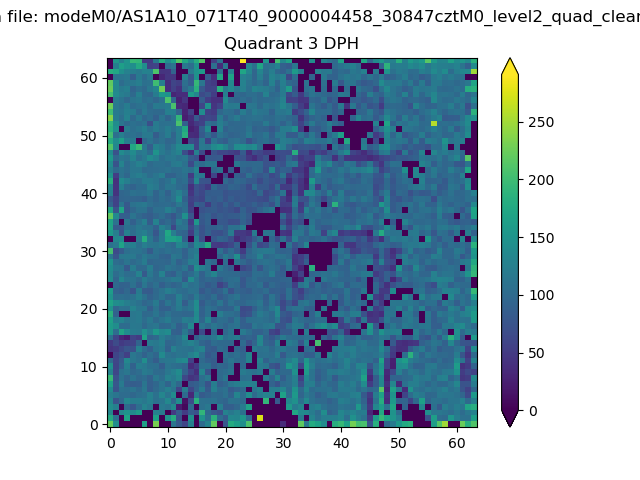 |
 |
Quadrant C |
| Plot type | Count rate plots | Images |
|---|---|---|
| Comparison with Poisson distribution Blue bars denote a histogram of data divided into 1 sec bins. Red curve is a Poisson curve with rate = median count rate of data. |
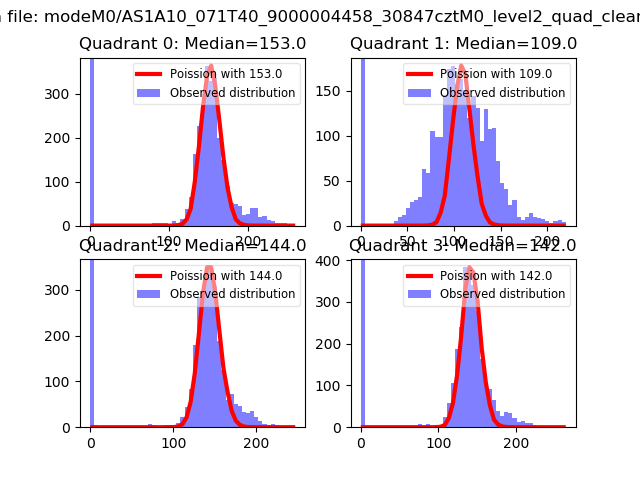 |
 |
| Quadrant-wise count rates Data is divided into 100 sec bins |
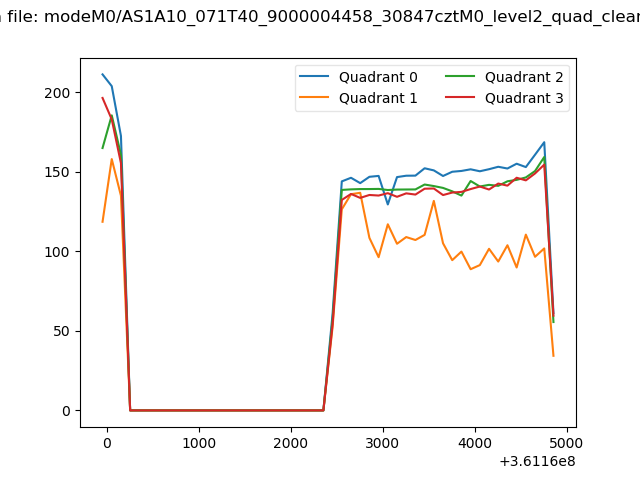 |
|
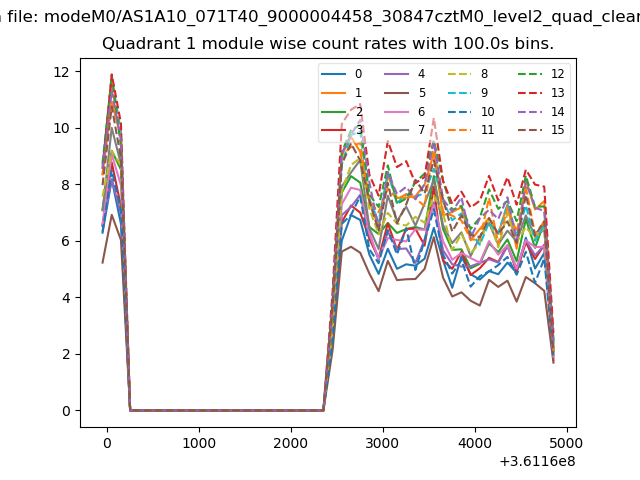
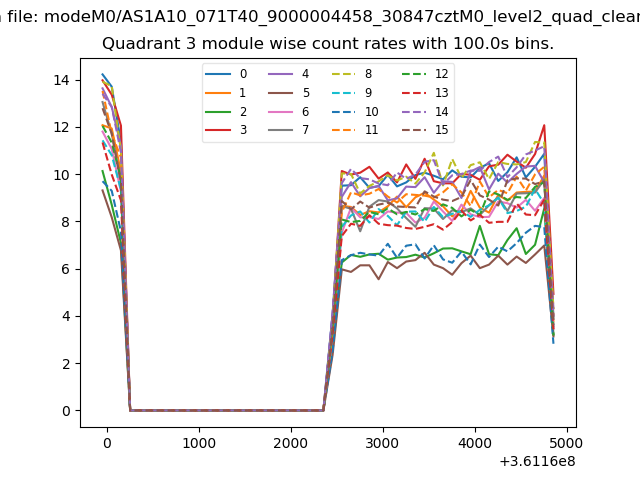
| Module-wise count rates for Quadrant A Data is divided into 100 sec bins |
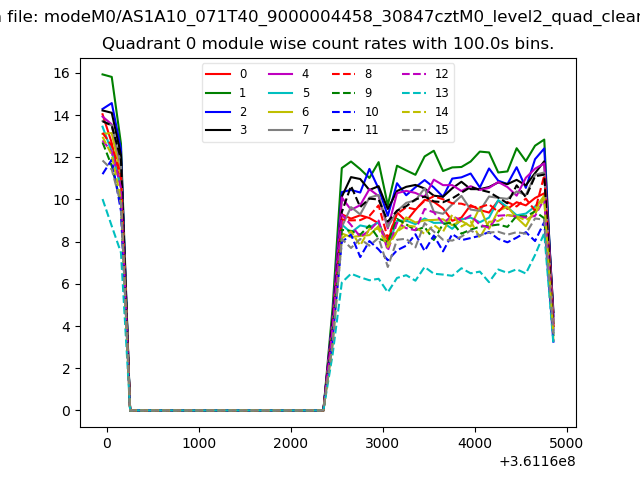 |
 |
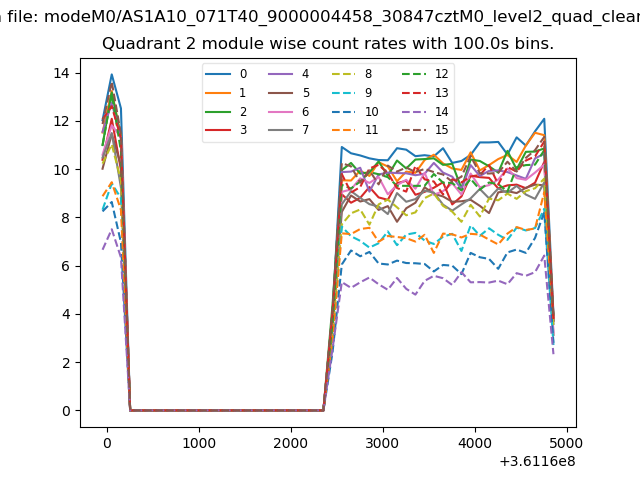
| Module-wise count rates for Quadrant B Data is divided into 100 sec bins |
 |
 |
| Module-wise count rates for Quadrant C Data is divided into 100 sec bins |
 |
 |
| Module-wise count rates for Quadrant D Data is divided into 100 sec bins |
 |
 |
| Parameter | Plot |
|---|---|
| CZT HV Monitor | 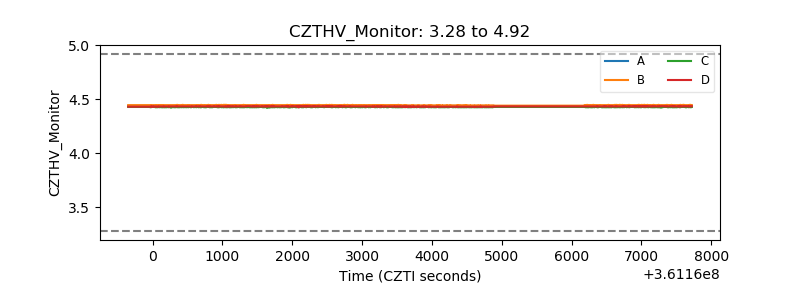 |
| D_VDD | 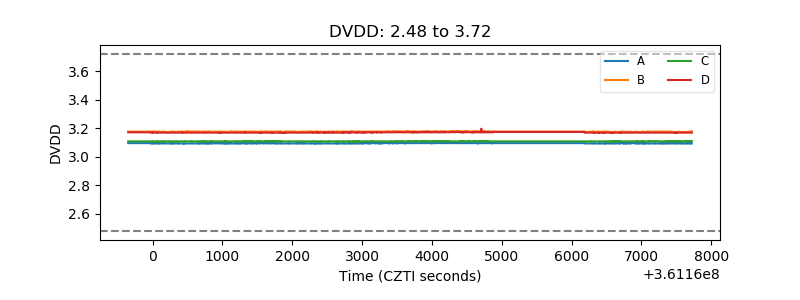 |
| Temperature 1 | 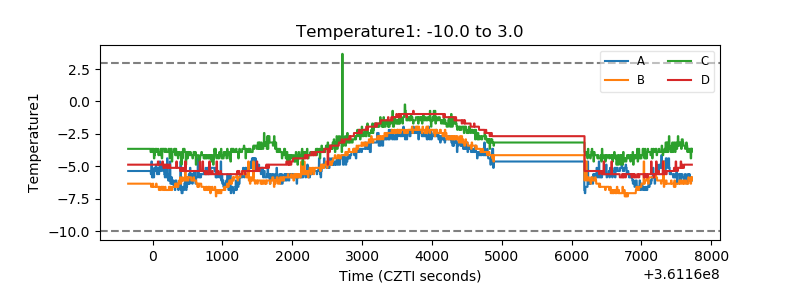 |
| Veto HV Monitor | 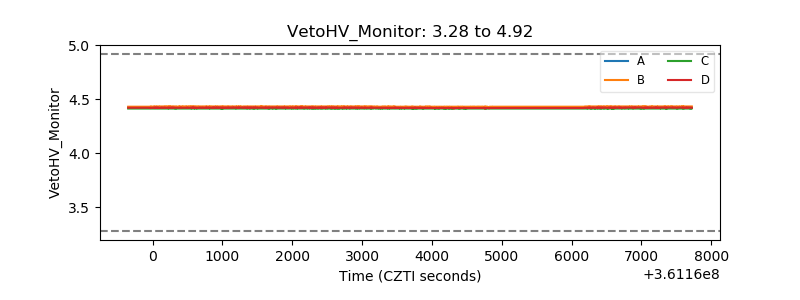 |
| Veto LLD | 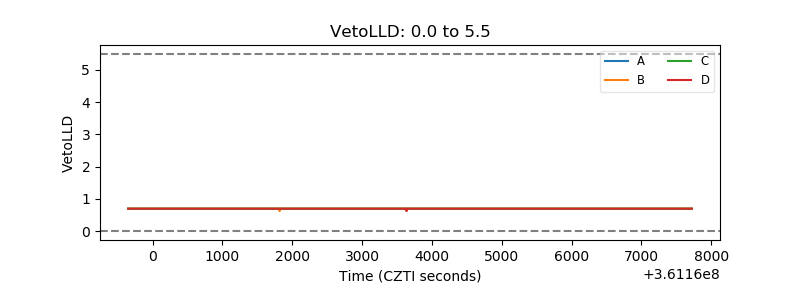 |
| Alpha Counter | 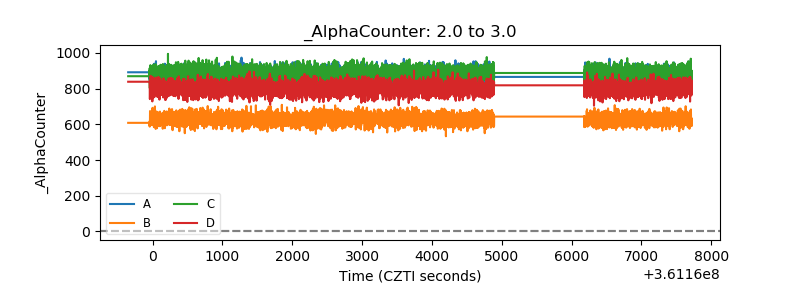 |
| _CPM_Rate | 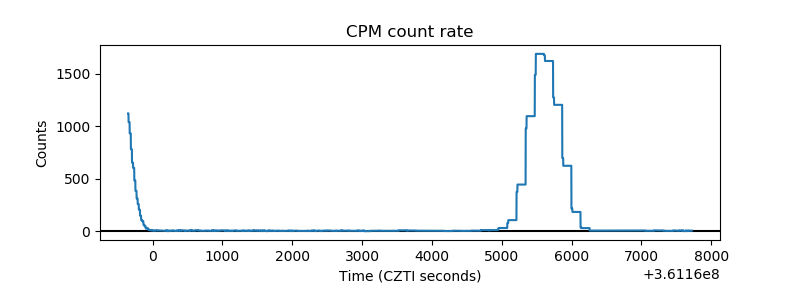 |
| CZT Counter | 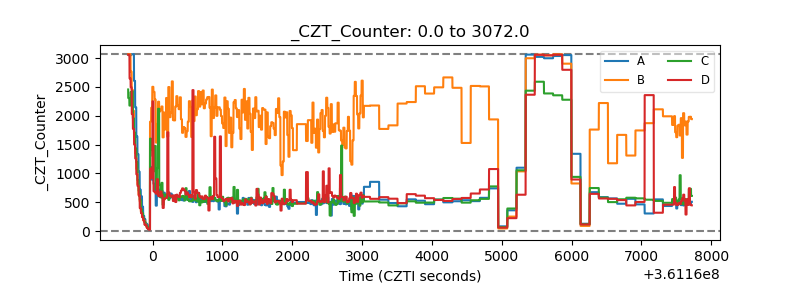 |
| +2.5 Volts monitor |  |
| +5 Volts monitor | 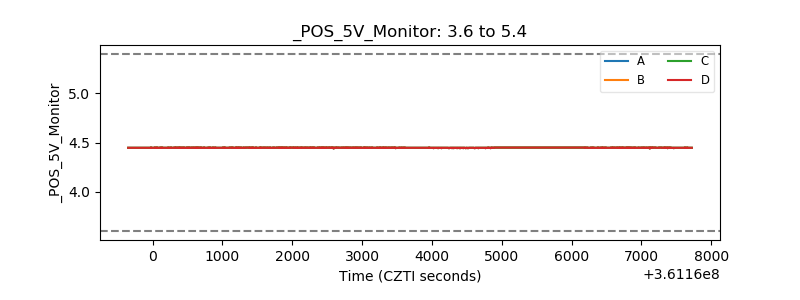 |
| _ROLL_ROT | 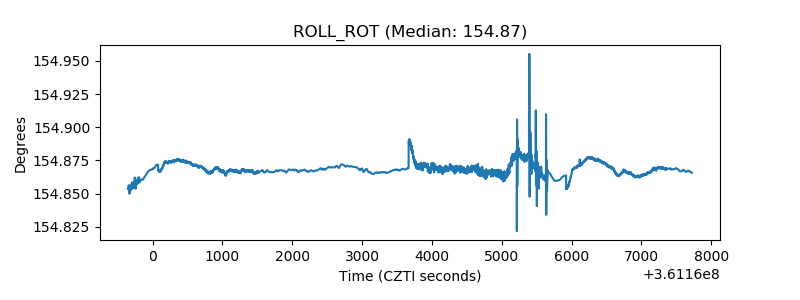 |
| _Roll_DEC | 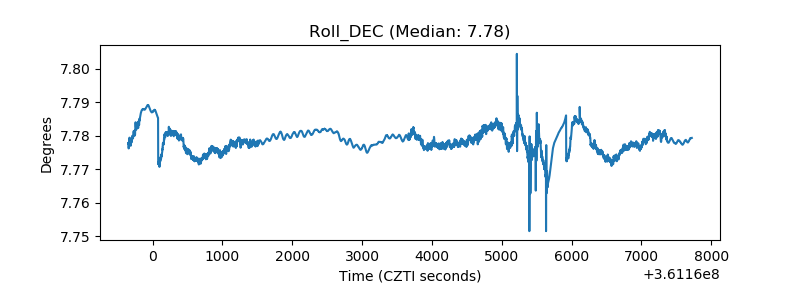 |
| _Roll_RA | 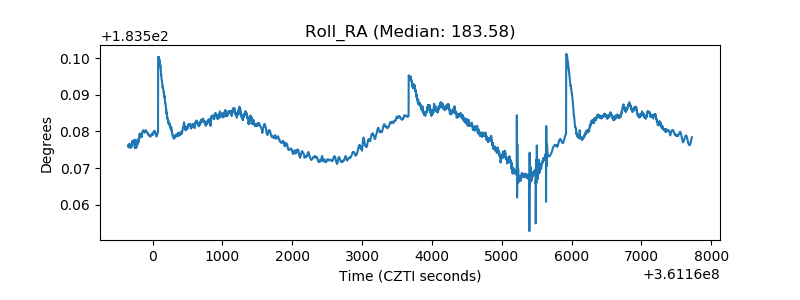 |
| Veto Counter | 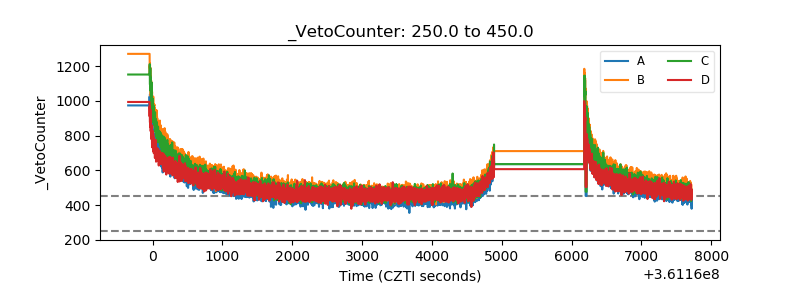 |