| Param | Original file | Final file |
|---|---|---|
| Filename | modeM0/AS1A10_071T40_9000004458_30849cztM0_level2.evt | modeM0/AS1A10_071T40_9000004458_30849cztM0_level2_quad_clean.evt |
| Size (bytes) | 707,495,040 | 79,663,680 |
| Size | 674.7 MB | 76.0 MB |
| Events in quadrant A | 3,352,930 | 512,379 |
| Events in quadrant B | 9,980,575 | 470,181 |
| Events in quadrant C | 3,515,772 | 483,136 |
| Events in quadrant D | 4,124,119 | 478,221 |
| Mode M0 | |||
|---|---|---|---|
| Quadrant | BADHDUFLAG | Total packets | Discarded packets |
| A | 0 | 13853 | 1 |
| B | 0 | 34388 | 5 |
| C | 0 | 14316 | 1 |
| D | 0 | 16676 | 1 |
| Mode SS | |||
|---|---|---|---|
| Quadrant | BADHDUFLAG | Total packets | Discarded packets |
| A | 0 | 136 | 0 |
| B | 0 | 136 | 0 |
| C | 0 | 136 | 0 |
| D | 0 | 136 | 0 |
| Mode M9 | |||
|---|---|---|---|
| Quadrant | BADHDUFLAG | Total packets | Discarded packets |
| A | 0 | 8 | 0 |
| B | 0 | 8 | 0 |
| C | 0 | 8 | 0 |
| D | 0 | 8 | 0 |
| Quadrant | Total seconds | Saturated seconds | Saturation percentage |
|---|---|---|---|
| A | 6715 | 113 | 1.682800% |
| B | 6714 | 1546 | 23.026512% |
| C | 6715 | 178 | 2.650782% |
| D | 6715 | 112 | 1.667908% |
Noise dominated data is calculated using 1-second bins in cleaned event files. If a bin has >2000 counts, and if more than 50% of those come from <1% of pixels, then it is considered to be noise-dominated and hence unusable.
| Quadrant | # 1 sec bins | Bins with >0 counts | Bins with >2000 counts | High rate bins dominated by noise | Noise dominated (total time) | Noise dominated (detector-on time) | Marked lightcurve |
|---|---|---|---|---|---|---|---|
| A | 7490 | 6715 | 0 | 0 | 0.00% | 0.00% | 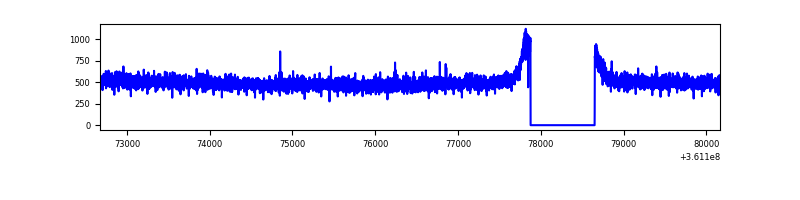 |
| B | 7489 | 6714 | 704 | 704 | 9.40% | 10.49% | 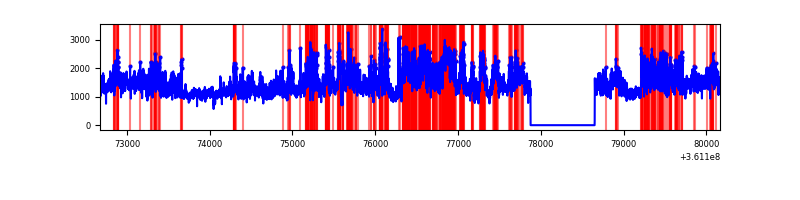 |
| C | 7490 | 6715 | 10 | 10 | 0.13% | 0.15% | 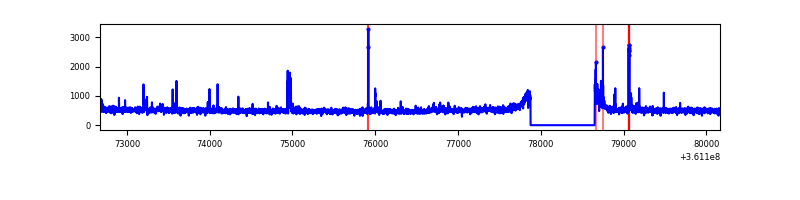 |
| D | 7490 | 6715 | 25 | 25 | 0.33% | 0.37% | 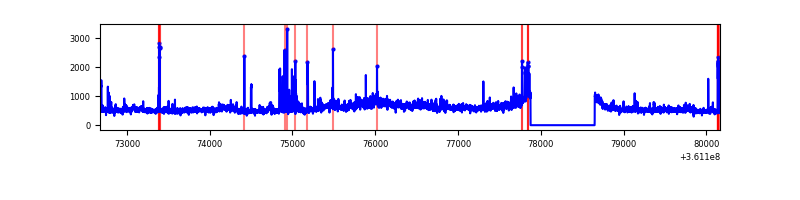 |
Top three noisy pixels from each quadrant. If the there are fewer than three noisy pixels in the level2.evt file, extra rows are filled as -1
| Pixel properties | Quadrant properties | ||||||
|---|---|---|---|---|---|---|---|
| Quadrant | DetID | PixID | Counts | Sigma | Mean | Median | Sigma |
| A | 13 | 254 | 12235 | 65.24 | 868 | 852 | 174.5 |
| A | 3 | 137 | 8679 | 44.86 | 868 | 852 | 174.5 |
| A | 0 | 226 | 7348 | 37.23 | 868 | 852 | 174.5 |
| B | 6 | 36 | 4852023 | 30670.15 | 816 | 795 | 158.2 |
| B | 6 | 159 | 1791193 | 11319.15 | 816 | 795 | 158.2 |
| B | 4 | 80 | 51290 | 319.24 | 816 | 795 | 158.2 |
| C | 14 | 238 | 132278 | 678.28 | 820 | 826 | 193.8 |
| C | 0 | 10 | 113129 | 579.47 | 820 | 826 | 193.8 |
| C | 2 | 16 | 35752 | 180.21 | 820 | 826 | 193.8 |
| D | 8 | 195 | 868228 | 4402.35 | 827 | 807 | 197.0 |
| D | 2 | 250 | 71608 | 359.33 | 827 | 807 | 197.0 |
| D | 2 | 234 | 27054 | 133.21 | 827 | 807 | 197.0 |
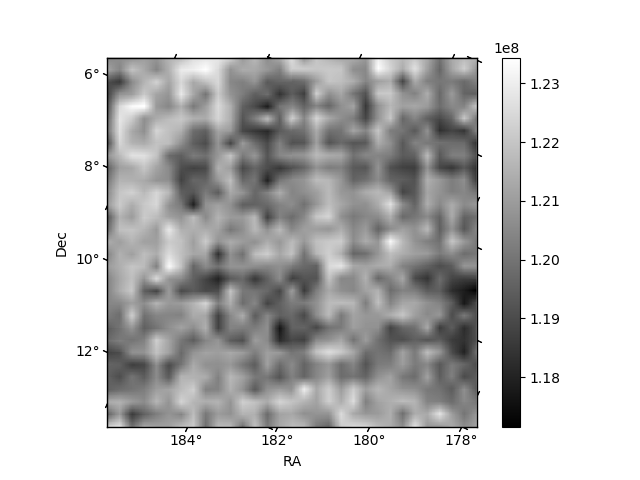
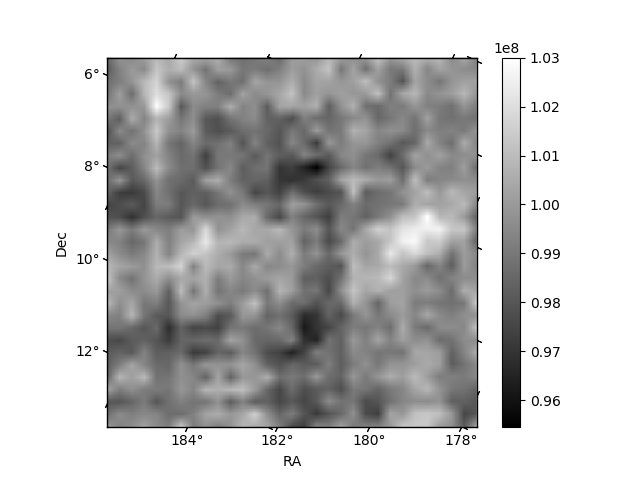
Histogram calculated using DETX and DETY for each event in the final _common_clean file
| Quadrant A | 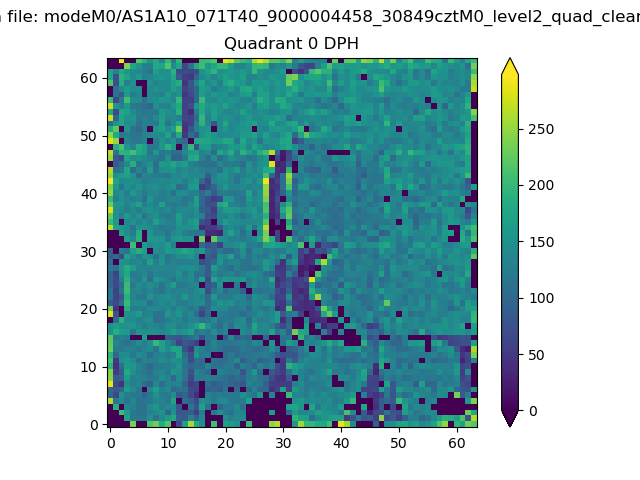 |
 |
Quadrant B |
|---|---|---|---|
| Quadrant D |  |
 |
Quadrant C |
| Plot type | Count rate plots | Images |
|---|---|---|
| Comparison with Poisson distribution Blue bars denote a histogram of data divided into 1 sec bins. Red curve is a Poisson curve with rate = median count rate of data. |
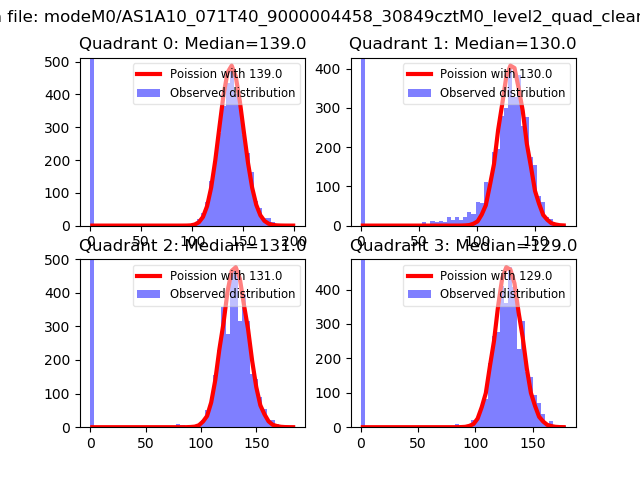 |
 |
| Quadrant-wise count rates Data is divided into 100 sec bins |
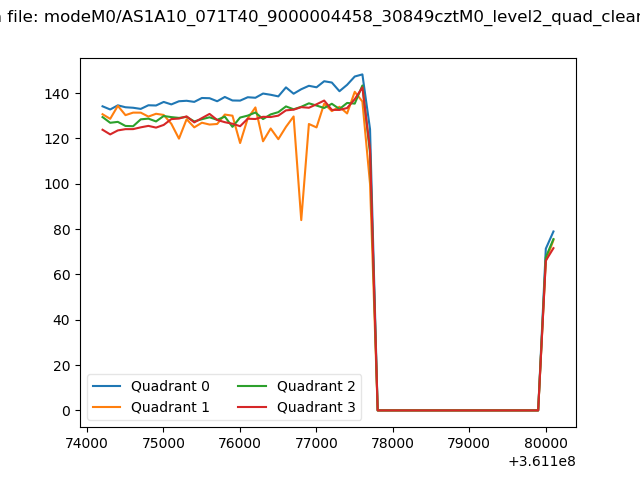 |
|
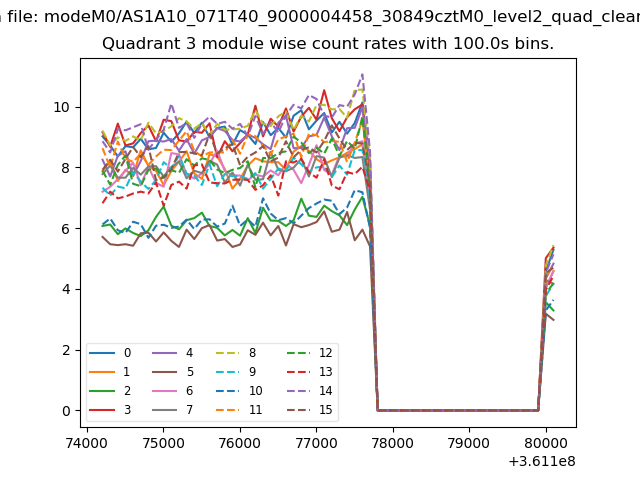
| Module-wise count rates for Quadrant A Data is divided into 100 sec bins |
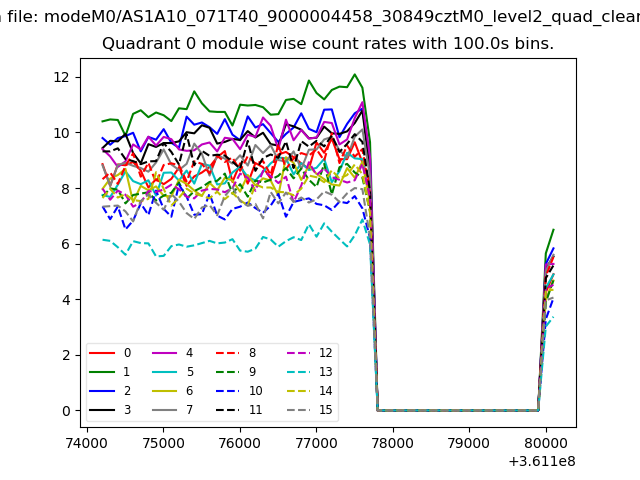 |
 |
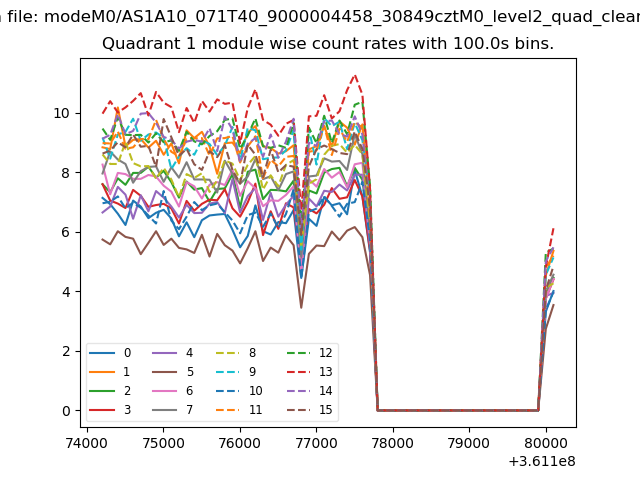
| Module-wise count rates for Quadrant B Data is divided into 100 sec bins |
 |
 |
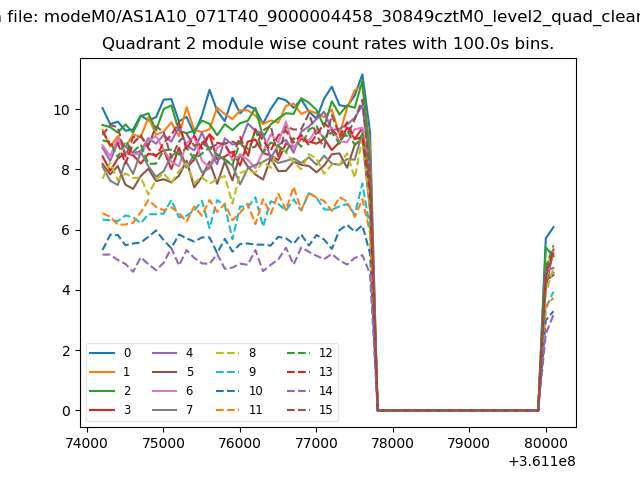
| Module-wise count rates for Quadrant C Data is divided into 100 sec bins |
 |
 |
| Module-wise count rates for Quadrant D Data is divided into 100 sec bins |
 |
 |
| Parameter | Plot |
|---|---|
| CZT HV Monitor | 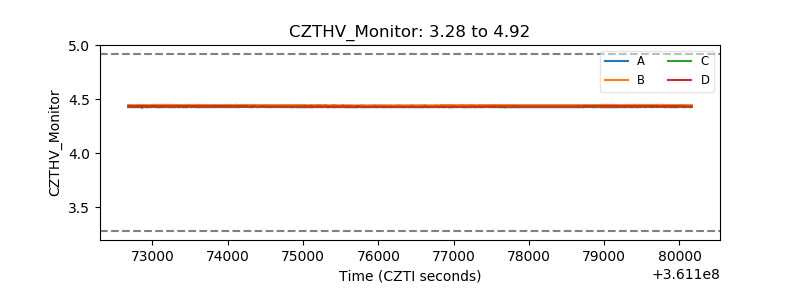 |
| D_VDD | 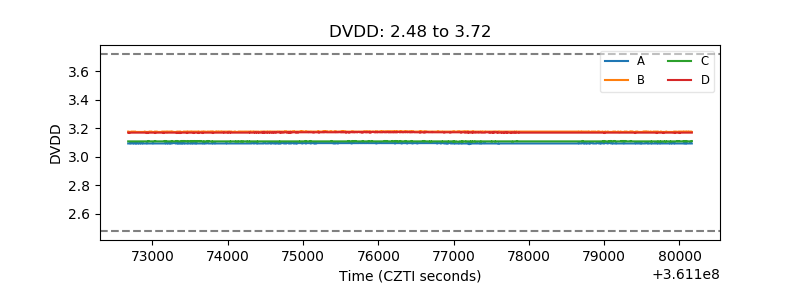 |
| Temperature 1 | 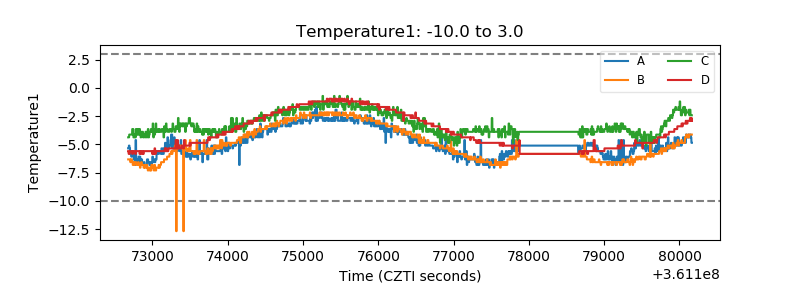 |
| Veto HV Monitor |  |
| Veto LLD | 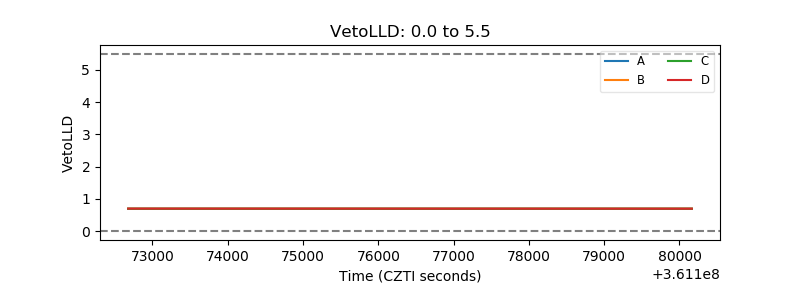 |
| Alpha Counter | 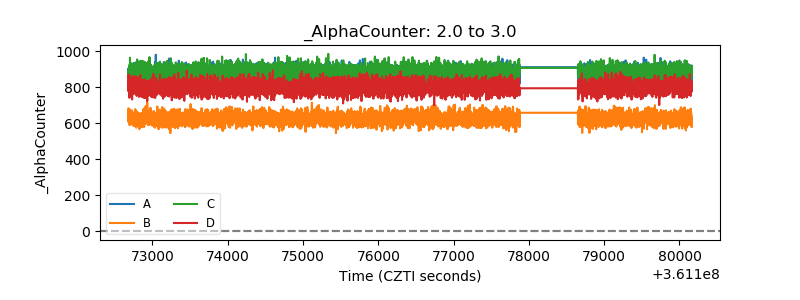 |
| _CPM_Rate | 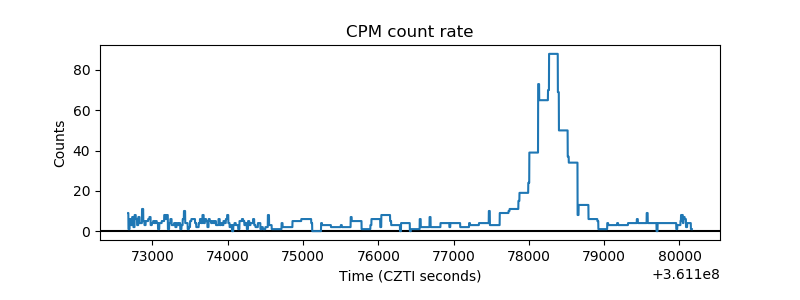 |
| CZT Counter | 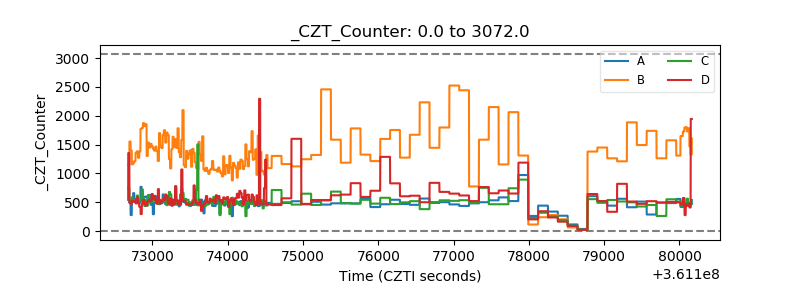 |
| +2.5 Volts monitor |  |
| +5 Volts monitor |  |
| _ROLL_ROT | 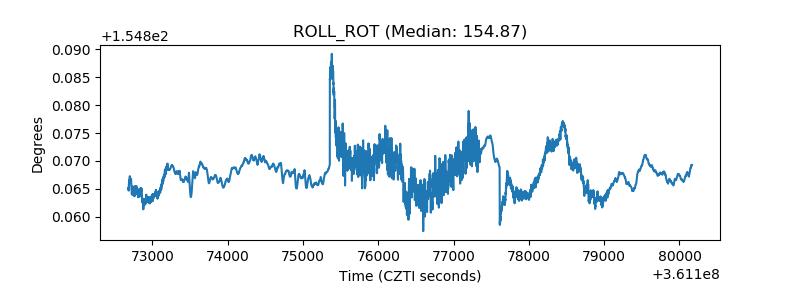 |
| _Roll_DEC | 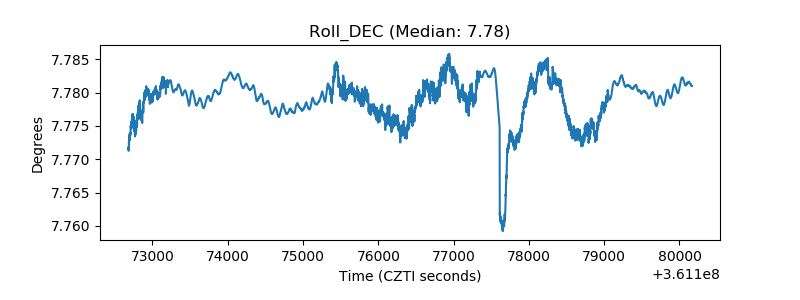 |
| _Roll_RA | 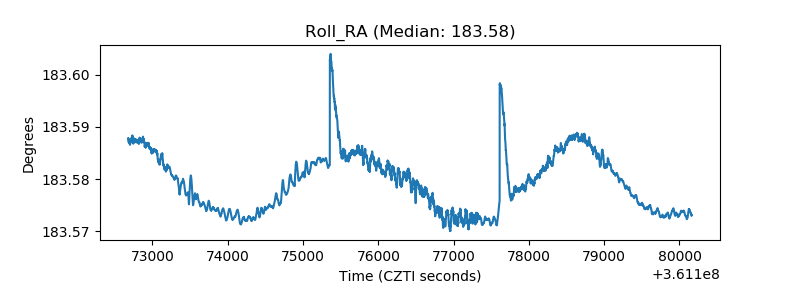 |
| Veto Counter | 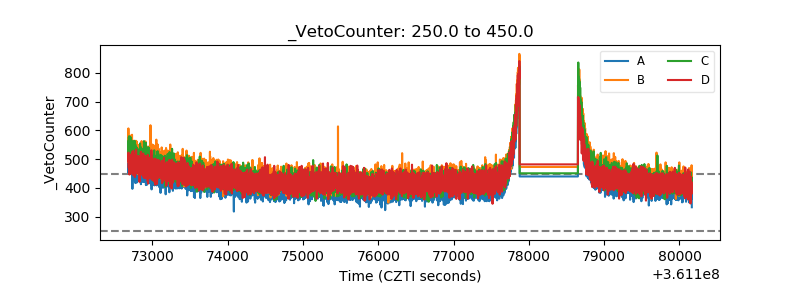 |