| Param | Original file | Final file |
|---|---|---|
| Filename | modeM0/AS1A10_071T40_9000004458_30850cztM0_level2.evt | modeM0/AS1A10_071T40_9000004458_30850cztM0_level2_quad_clean.evt |
| Size (bytes) | 780,428,160 | 85,783,680 |
| Size | 744.3 MB | 81.8 MB |
| Events in quadrant A | 3,724,205 | 542,171 |
| Events in quadrant B | 10,907,202 | 504,752 |
| Events in quadrant C | 3,856,660 | 516,045 |
| Events in quadrant D | 4,638,082 | 509,637 |
| Mode M0 | |||
|---|---|---|---|
| Quadrant | BADHDUFLAG | Total packets | Discarded packets |
| A | 0 | 15683 | 2 |
| B | 0 | 37627 | 2 |
| C | 0 | 16036 | 2 |
| D | 0 | 18529 | 2 |
| Mode SS | |||
|---|---|---|---|
| Quadrant | BADHDUFLAG | Total packets | Discarded packets |
| A | 0 | 154 | 0 |
| B | 0 | 154 | 0 |
| C | 0 | 154 | 0 |
| D | 0 | 154 | 0 |
| Mode M9 | |||
|---|---|---|---|
| Quadrant | BADHDUFLAG | Total packets | Discarded packets |
| A | 0 | 7 | 0 |
| B | 0 | 8 | 0 |
| C | 0 | 8 | 0 |
| D | 0 | 8 | 0 |
| Quadrant | Total seconds | Saturated seconds | Saturation percentage |
|---|---|---|---|
| A | 7543 | 285 | 3.778338% |
| B | 7543 | 1771 | 23.478722% |
| C | 7543 | 364 | 4.825666% |
| D | 7543 | 273 | 3.619250% |
Noise dominated data is calculated using 1-second bins in cleaned event files. If a bin has >2000 counts, and if more than 50% of those come from <1% of pixels, then it is considered to be noise-dominated and hence unusable.
| Quadrant | # 1 sec bins | Bins with >0 counts | Bins with >2000 counts | High rate bins dominated by noise | Noise dominated (total time) | Noise dominated (detector-on time) | Marked lightcurve |
|---|---|---|---|---|---|---|---|
| A | 7798 | 7543 | 0 | 0 | 0.00% | 0.00% | 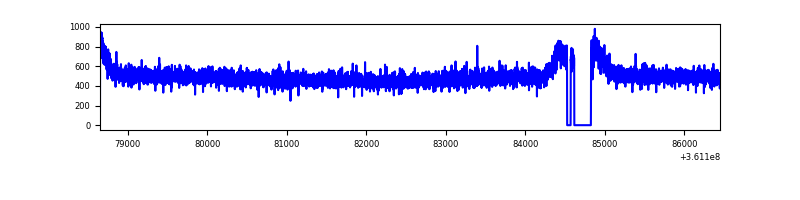 |
| B | 7798 | 7543 | 620 | 620 | 7.95% | 8.22% | 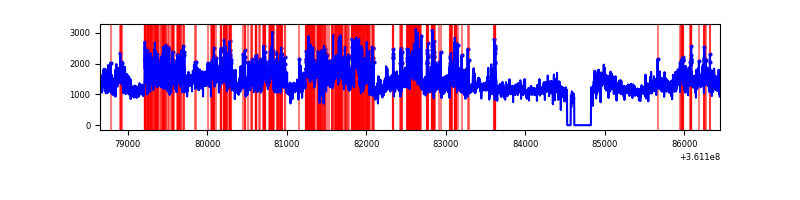 |
| C | 7798 | 7543 | 8 | 8 | 0.10% | 0.11% | 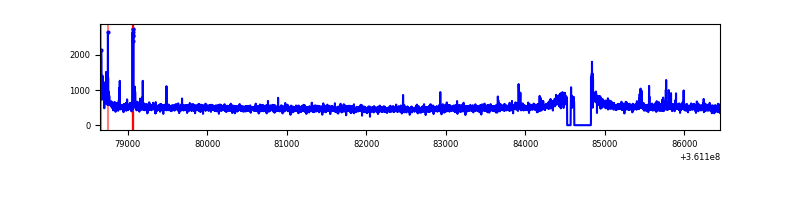 |
| D | 7798 | 7543 | 51 | 51 | 0.65% | 0.68% | 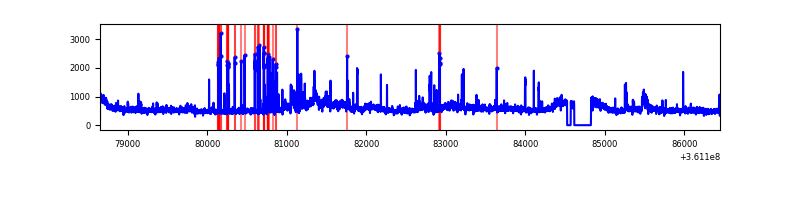 |
Top three noisy pixels from each quadrant. If the there are fewer than three noisy pixels in the level2.evt file, extra rows are filled as -1
| Pixel properties | Quadrant properties | ||||||
|---|---|---|---|---|---|---|---|
| Quadrant | DetID | PixID | Counts | Sigma | Mean | Median | Sigma |
| A | 13 | 254 | 13423 | 63.64 | 964 | 941 | 196.1 |
| A | 3 | 137 | 9964 | 46.0 | 964 | 941 | 196.1 |
| A | 0 | 226 | 8024 | 36.11 | 964 | 941 | 196.1 |
| B | 6 | 36 | 5120960 | 29131.31 | 907 | 882 | 175.8 |
| B | 6 | 159 | 2084442 | 11854.67 | 907 | 882 | 175.8 |
| B | 5 | 255 | 51812 | 289.77 | 907 | 882 | 175.8 |
| C | 14 | 238 | 146991 | 681.6 | 914 | 919 | 214.3 |
| C | 0 | 10 | 98312 | 454.46 | 914 | 919 | 214.3 |
| C | 2 | 16 | 19652 | 87.41 | 914 | 919 | 214.3 |
| D | 8 | 195 | 831511 | 3771.28 | 928 | 907 | 220.2 |
| D | 1 | 52 | 175118 | 790.99 | 928 | 907 | 220.2 |
| D | 2 | 250 | 62935 | 281.63 | 928 | 907 | 220.2 |
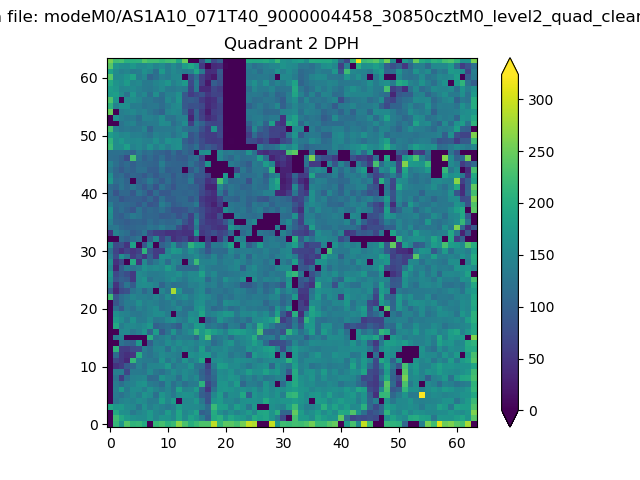
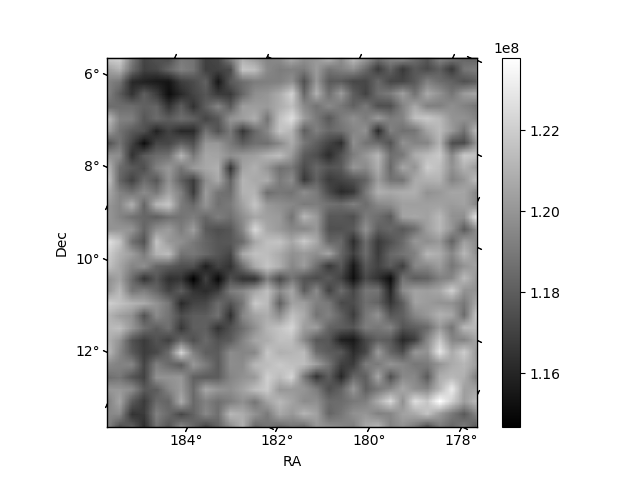
Histogram calculated using DETX and DETY for each event in the final _common_clean file
| Quadrant A |  |
 |
Quadrant B |
|---|---|---|---|
| Quadrant D | 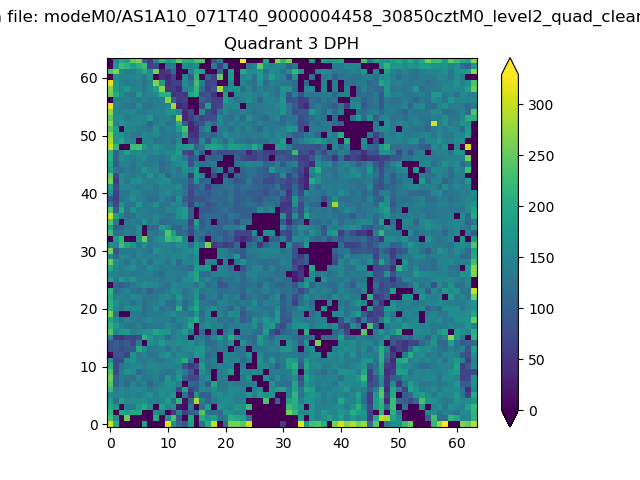 |
 |
Quadrant C |
| Plot type | Count rate plots | Images |
|---|---|---|
| Comparison with Poisson distribution Blue bars denote a histogram of data divided into 1 sec bins. Red curve is a Poisson curve with rate = median count rate of data. |
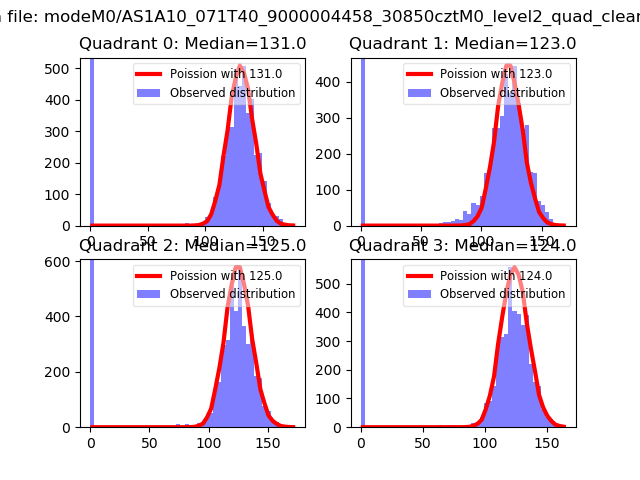 |
 |
| Quadrant-wise count rates Data is divided into 100 sec bins |
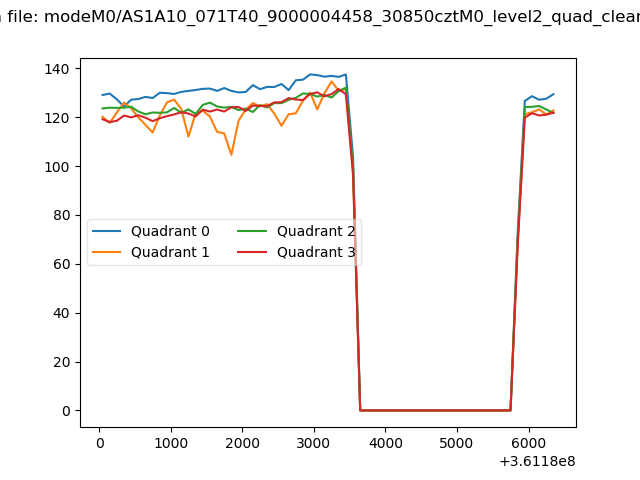 |
|
| Module-wise count rates for Quadrant A Data is divided into 100 sec bins |
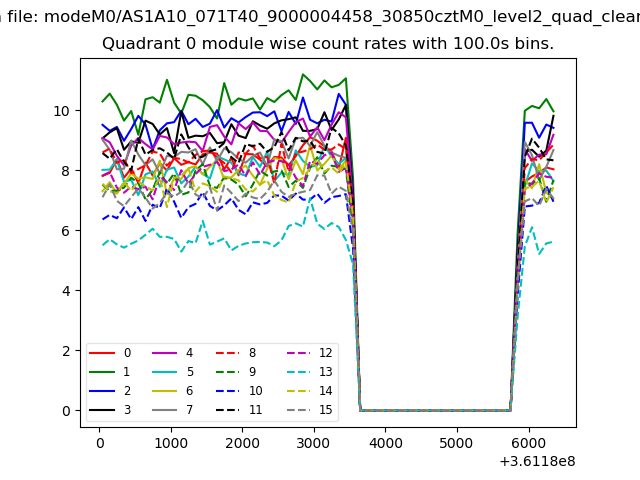 |
 |
| Module-wise count rates for Quadrant B Data is divided into 100 sec bins |
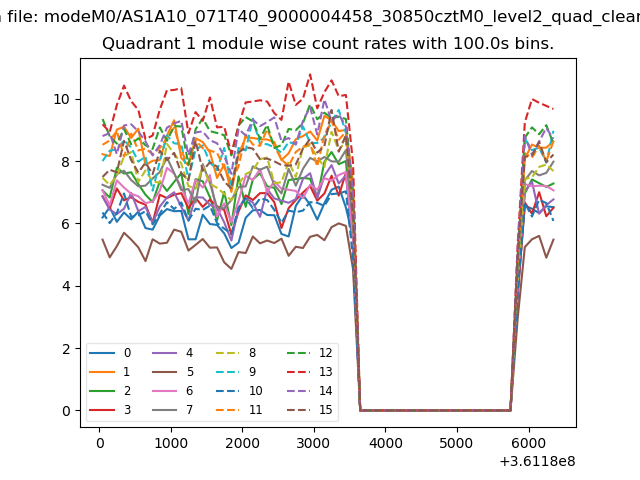 |
 |
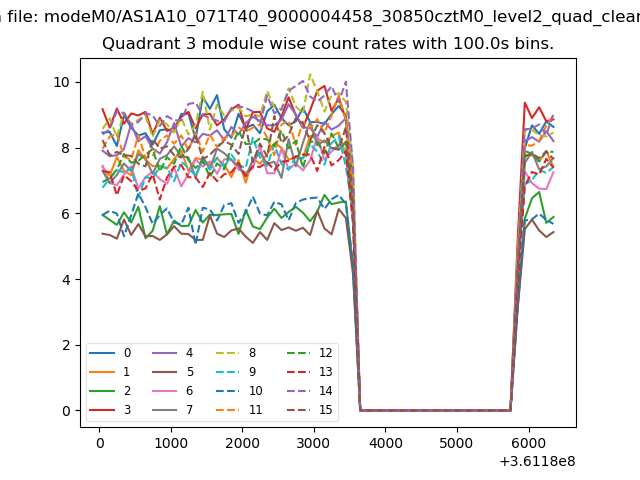
| Module-wise count rates for Quadrant C Data is divided into 100 sec bins |
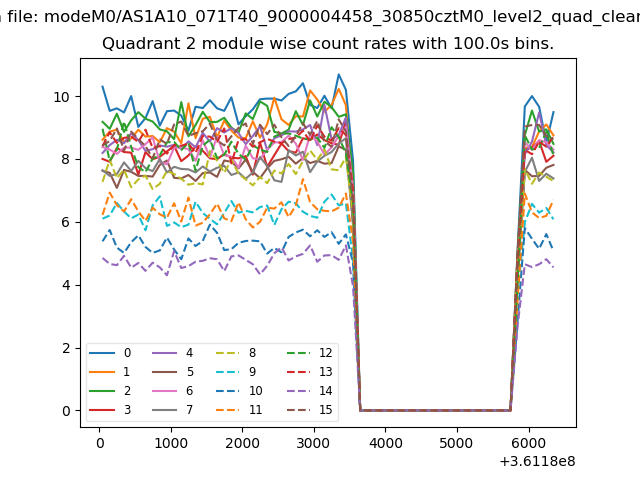 |
 |
| Module-wise count rates for Quadrant D Data is divided into 100 sec bins |
 |
 |
| Parameter | Plot |
|---|---|
| CZT HV Monitor | 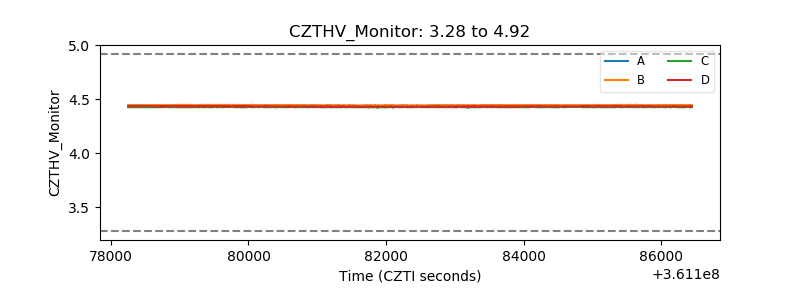 |
| D_VDD | 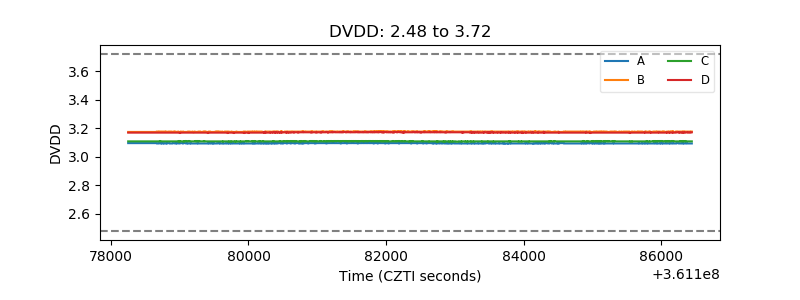 |
| Temperature 1 | 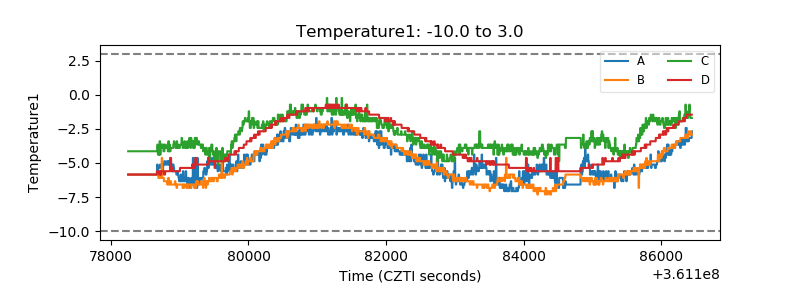 |
| Veto HV Monitor | 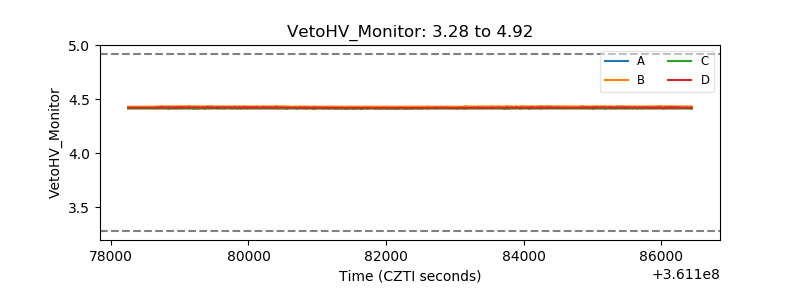 |
| Veto LLD | 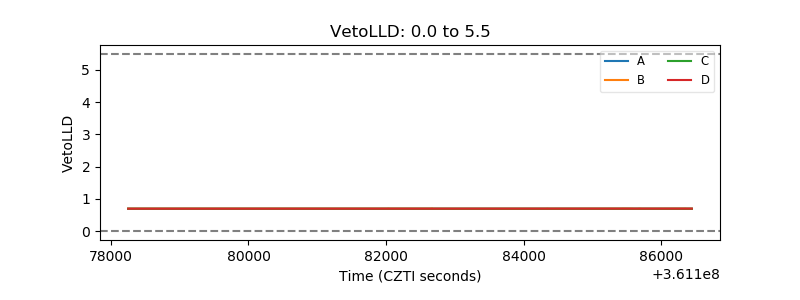 |
| Alpha Counter | 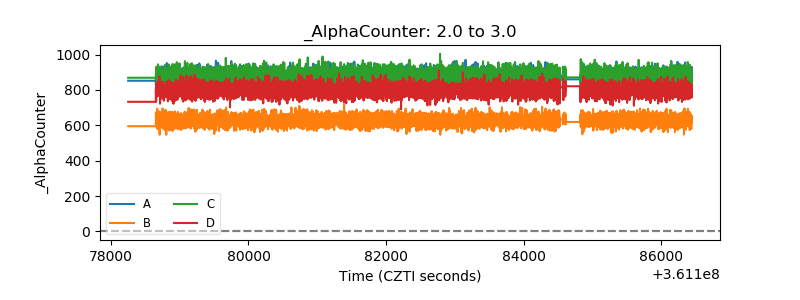 |
| _CPM_Rate | 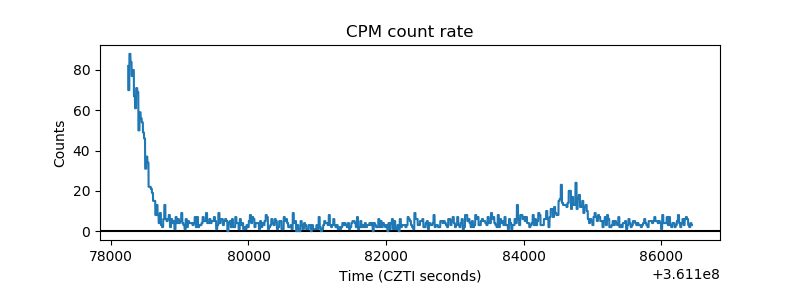 |
| CZT Counter |  |
| +2.5 Volts monitor |  |
| +5 Volts monitor |  |
| _ROLL_ROT | 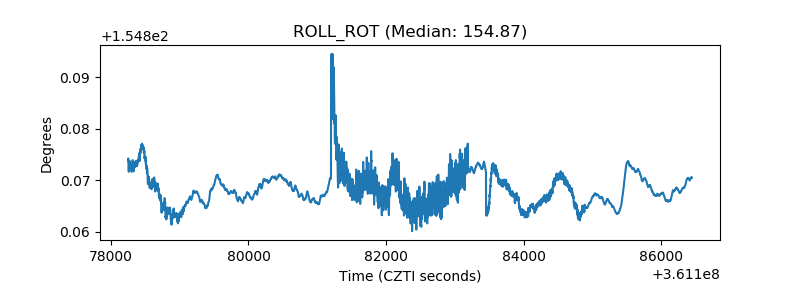 |
| _Roll_DEC | 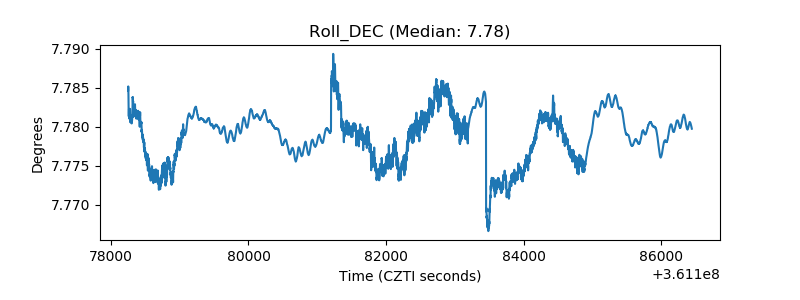 |
| _Roll_RA | 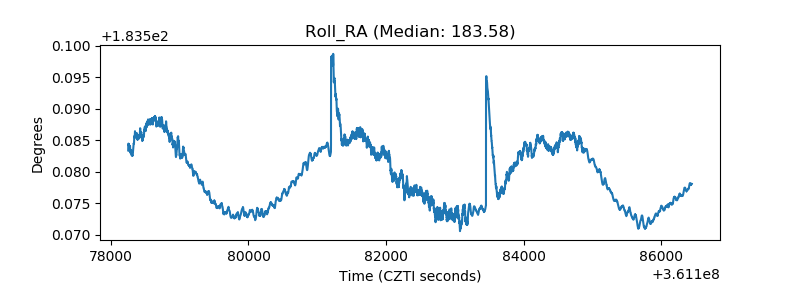 |
| Veto Counter | 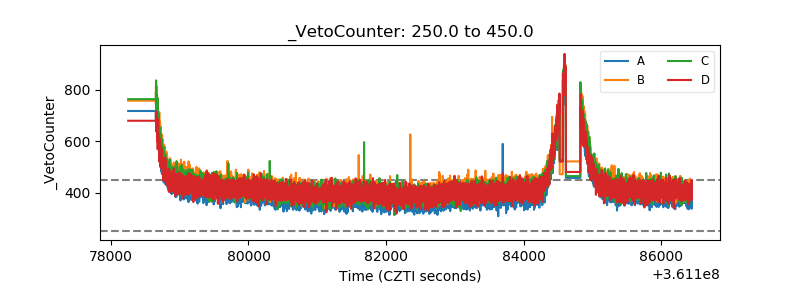 |