| Param | Original file | Final file |
|---|---|---|
| Filename | modeM0/AS1A10_071T40_9000004458_30851cztM0_level2.evt | modeM0/AS1A10_071T40_9000004458_30851cztM0_level2_quad_clean.evt |
| Size (bytes) | 769,080,960 | 94,783,680 |
| Size | 733.5 MB | 90.4 MB |
| Events in quadrant A | 3,894,045 | 605,203 |
| Events in quadrant B | 10,308,920 | 574,426 |
| Events in quadrant C | 4,181,052 | 573,631 |
| Events in quadrant D | 4,375,549 | 569,353 |
| Mode M0 | |||
|---|---|---|---|
| Quadrant | BADHDUFLAG | Total packets | Discarded packets |
| A | 0 | 16442 | 0 |
| B | 0 | 36181 | 0 |
| C | 0 | 17256 | 0 |
| D | 0 | 17646 | 0 |
| Mode SS | |||
|---|---|---|---|
| Quadrant | BADHDUFLAG | Total packets | Discarded packets |
| A | 0 | 158 | 0 |
| B | 0 | 158 | 0 |
| C | 0 | 158 | 0 |
| D | 0 | 158 | 0 |
| Quadrant | Total seconds | Saturated seconds | Saturation percentage |
|---|---|---|---|
| A | 7874 | 328 | 4.165608% |
| B | 7875 | 1373 | 17.434921% |
| C | 7875 | 404 | 5.130159% |
| D | 7875 | 311 | 3.949206% |
Noise dominated data is calculated using 1-second bins in cleaned event files. If a bin has >2000 counts, and if more than 50% of those come from <1% of pixels, then it is considered to be noise-dominated and hence unusable.
| Quadrant | # 1 sec bins | Bins with >0 counts | Bins with >2000 counts | High rate bins dominated by noise | Noise dominated (total time) | Noise dominated (detector-on time) | Marked lightcurve |
|---|---|---|---|---|---|---|---|
| A | 7874 | 7874 | 3 | 3 | 0.04% | 0.04% |  |
| B | 7875 | 7875 | 344 | 344 | 4.37% | 4.37% |  |
| C | 7875 | 7875 | 18 | 18 | 0.23% | 0.23% | 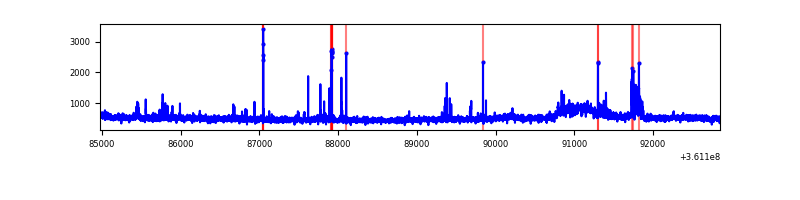 |
| D | 7875 | 7875 | 39 | 39 | 0.50% | 0.50% |  |
Top three noisy pixels from each quadrant. If the there are fewer than three noisy pixels in the level2.evt file, extra rows are filled as -1
| Pixel properties | Quadrant properties | ||||||
|---|---|---|---|---|---|---|---|
| Quadrant | DetID | PixID | Counts | Sigma | Mean | Median | Sigma |
| A | 15 | 192 | 15457 | 70.36 | 1005 | 981 | 205.7 |
| A | 13 | 254 | 14592 | 66.16 | 1005 | 981 | 205.7 |
| A | 3 | 137 | 10459 | 46.07 | 1005 | 981 | 205.7 |
| B | 6 | 36 | 4227171 | 22765.82 | 955 | 928 | 185.6 |
| B | 6 | 159 | 2184709 | 11763.54 | 955 | 928 | 185.6 |
| B | 5 | 255 | 66141 | 351.29 | 955 | 928 | 185.6 |
| C | 14 | 238 | 151852 | 661.44 | 958 | 963 | 228.1 |
| C | 2 | 16 | 142958 | 622.45 | 958 | 963 | 228.1 |
| C | 0 | 10 | 107750 | 468.12 | 958 | 963 | 228.1 |
| D | 8 | 195 | 423829 | 1828.51 | 973 | 946 | 231.3 |
| D | 12 | 218 | 94965 | 406.53 | 973 | 946 | 231.3 |
| D | 2 | 250 | 93502 | 400.2 | 973 | 946 | 231.3 |
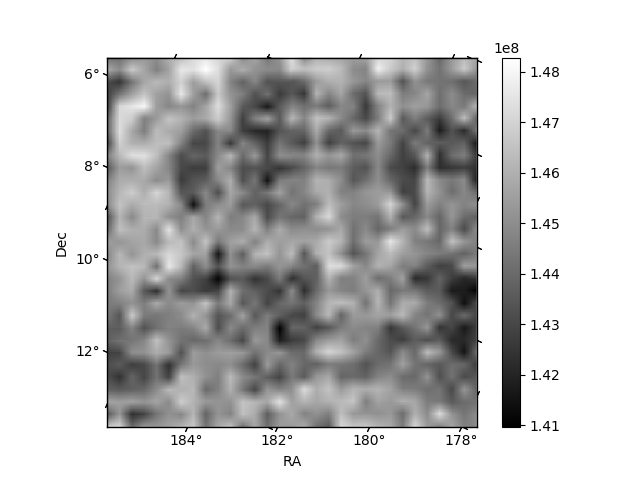
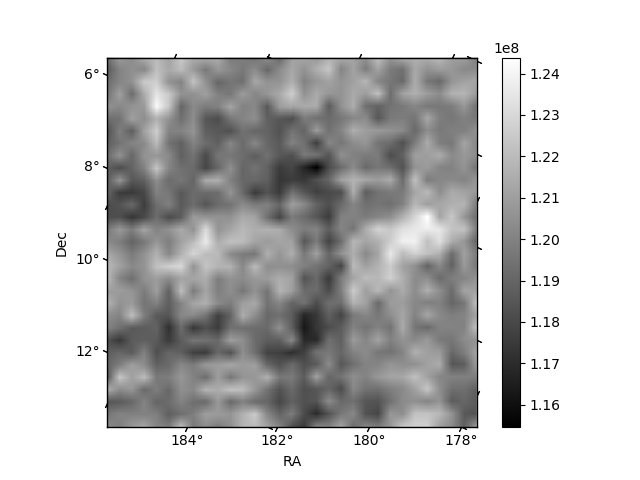
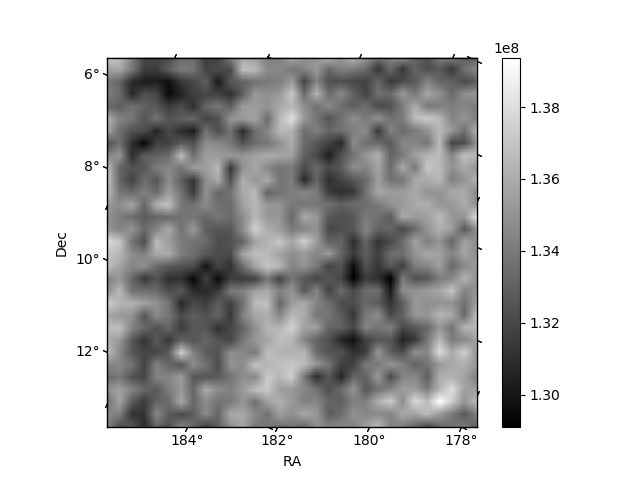
Histogram calculated using DETX and DETY for each event in the final _common_clean file
| Quadrant A | 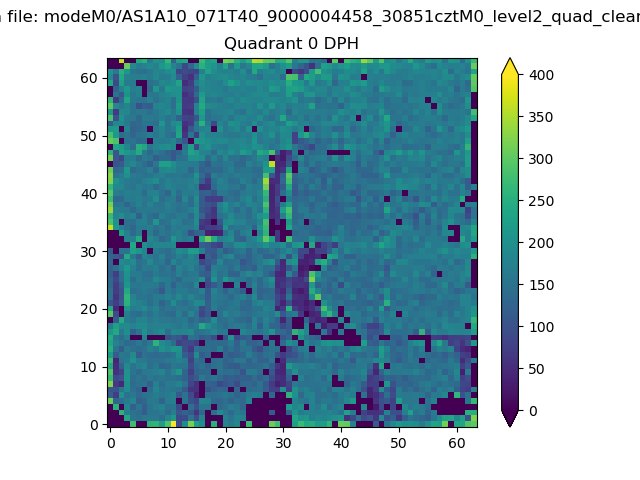 |
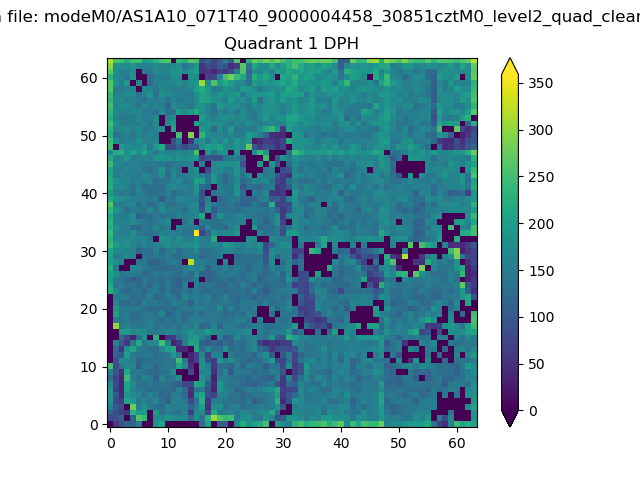 |
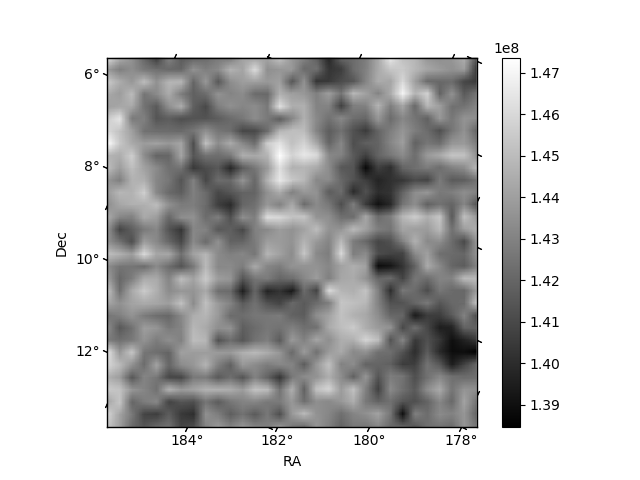
Quadrant B |
|---|---|---|---|
| Quadrant D | 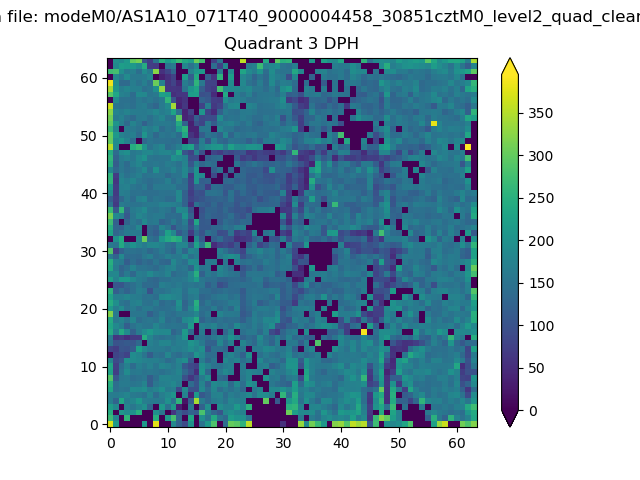 |
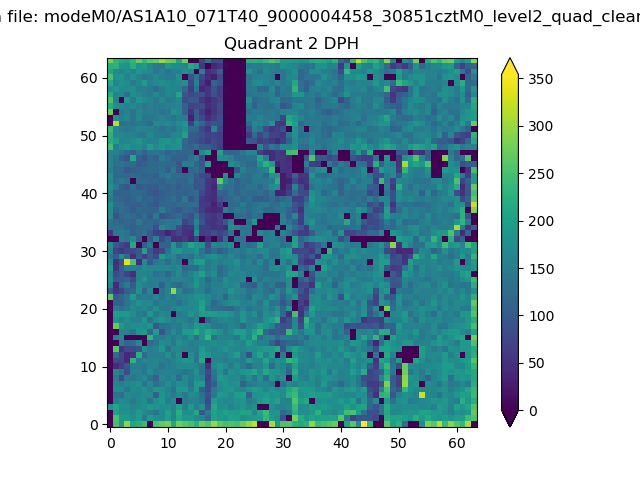 |
Quadrant C |
| Plot type | Count rate plots | Images |
|---|---|---|
| Comparison with Poisson distribution Blue bars denote a histogram of data divided into 1 sec bins. Red curve is a Poisson curve with rate = median count rate of data. |
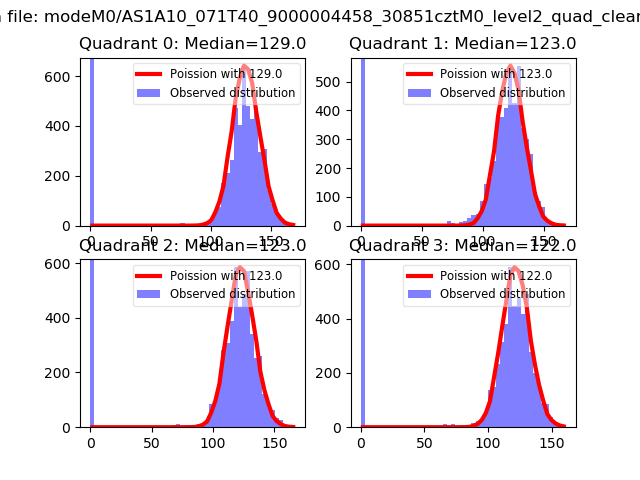 |
 |
| Quadrant-wise count rates Data is divided into 100 sec bins |
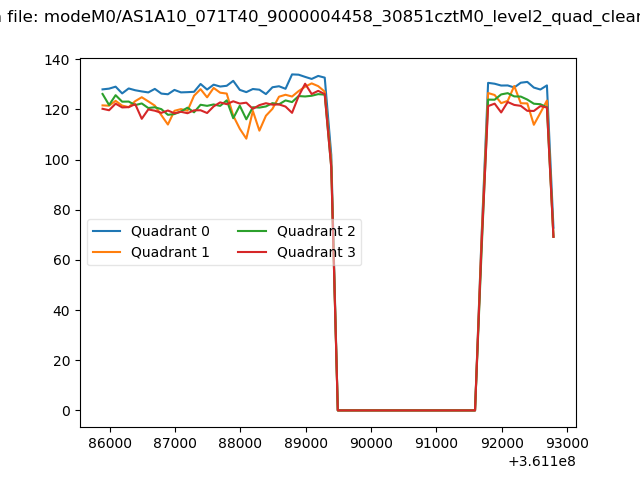 |
|
| Module-wise count rates for Quadrant A Data is divided into 100 sec bins |
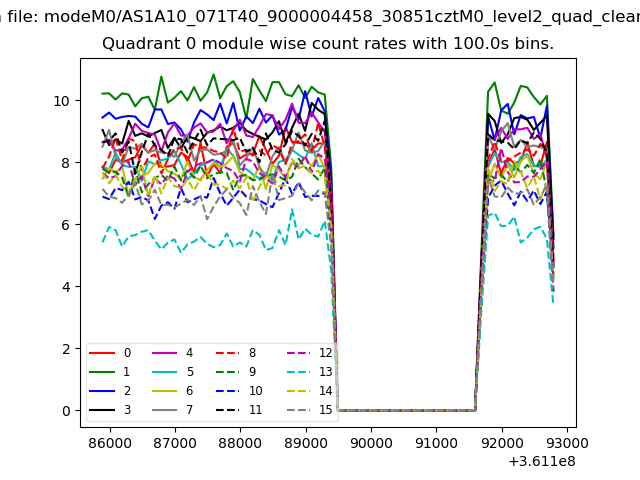 |
 |
| Module-wise count rates for Quadrant B Data is divided into 100 sec bins |
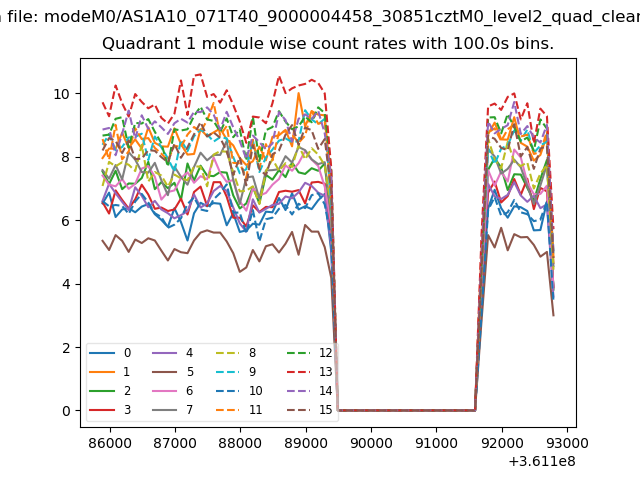 |
 |
| Module-wise count rates for Quadrant C Data is divided into 100 sec bins |
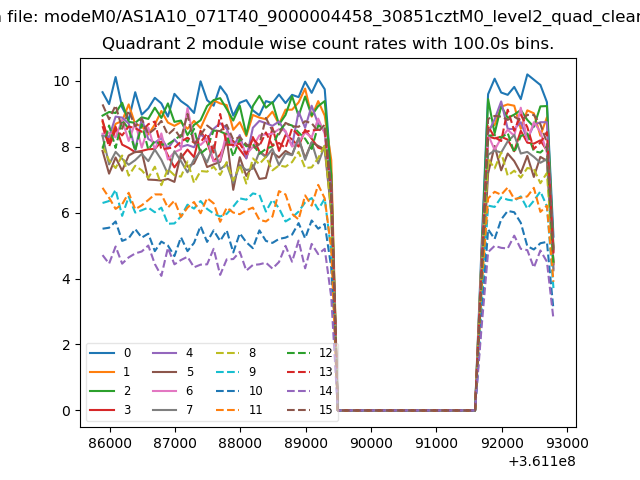 |
 |
| Module-wise count rates for Quadrant D Data is divided into 100 sec bins |
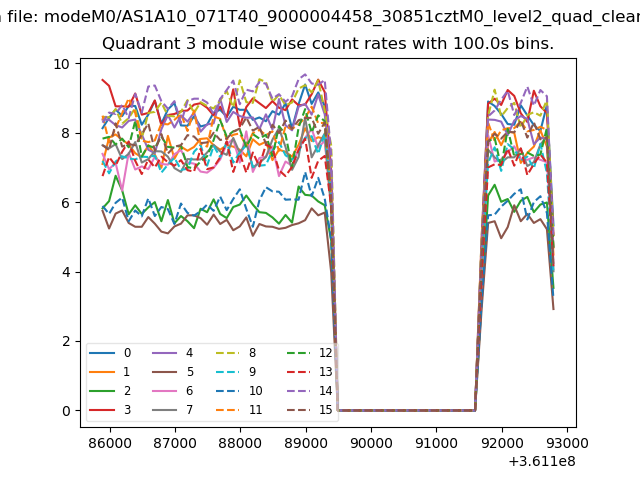 |
 |
| Parameter | Plot |
|---|---|
| CZT HV Monitor | 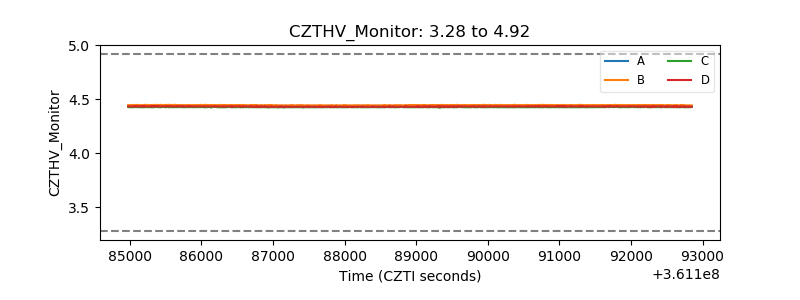 |
| D_VDD | 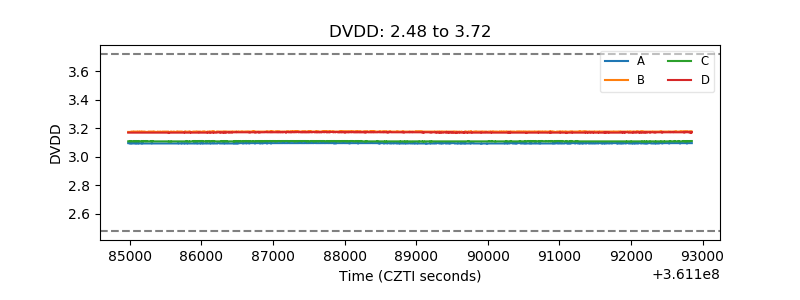 |
| Temperature 1 | 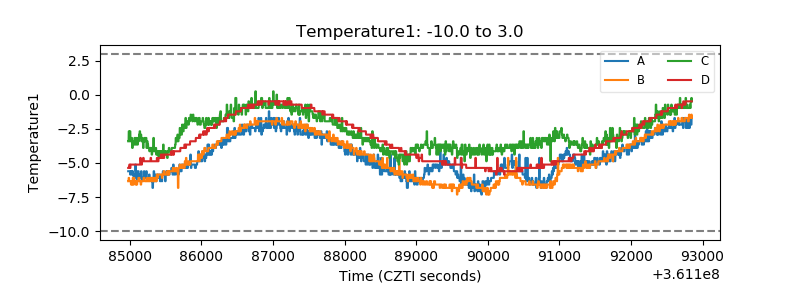 |
| Veto HV Monitor | 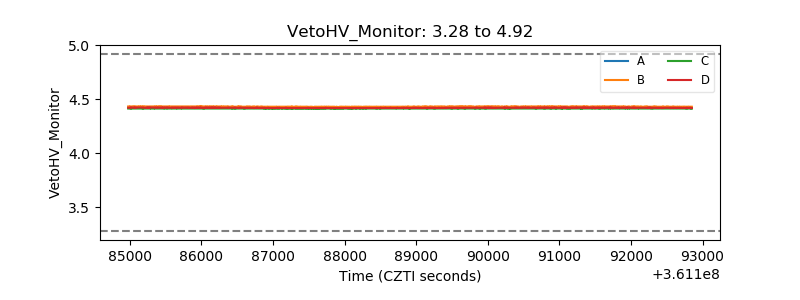 |
| Veto LLD | 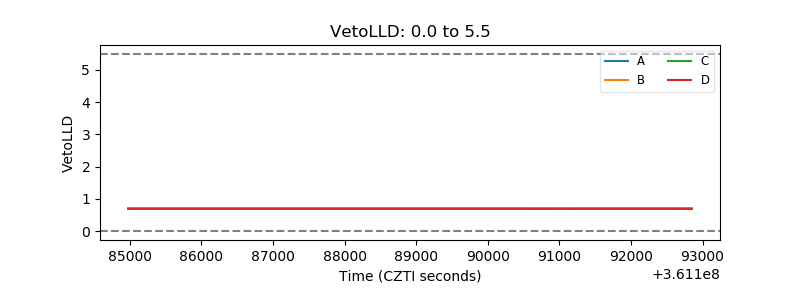 |
| Alpha Counter | 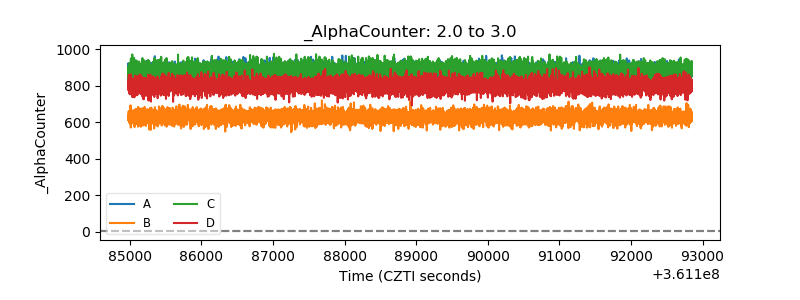 |
| _CPM_Rate | 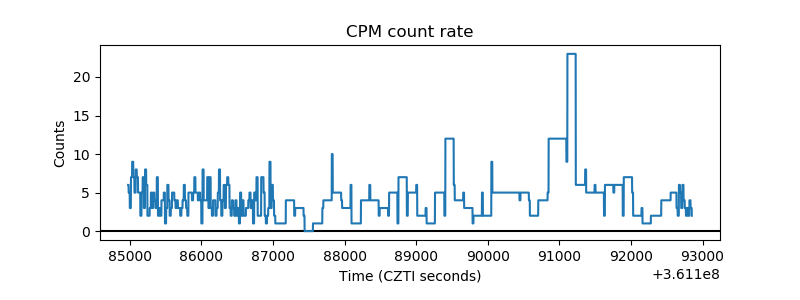 |
| CZT Counter | 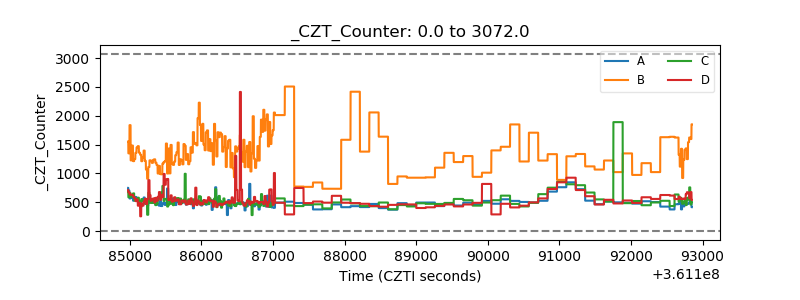 |
| +2.5 Volts monitor | 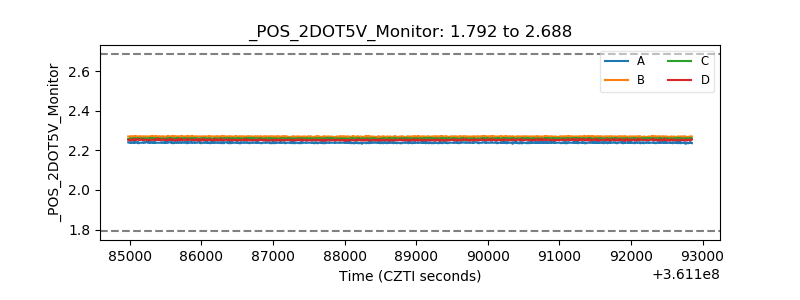 |
| +5 Volts monitor |  |
| _ROLL_ROT |  |
| _Roll_DEC | 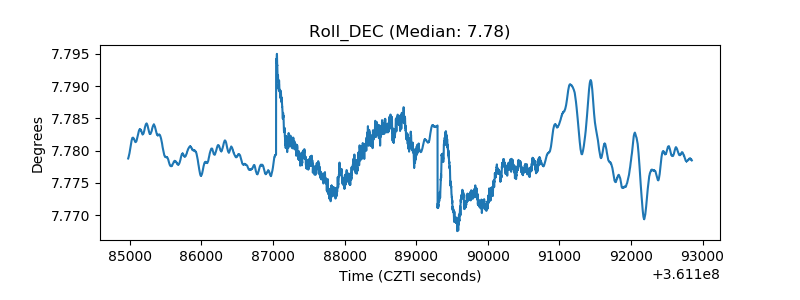 |
| _Roll_RA | 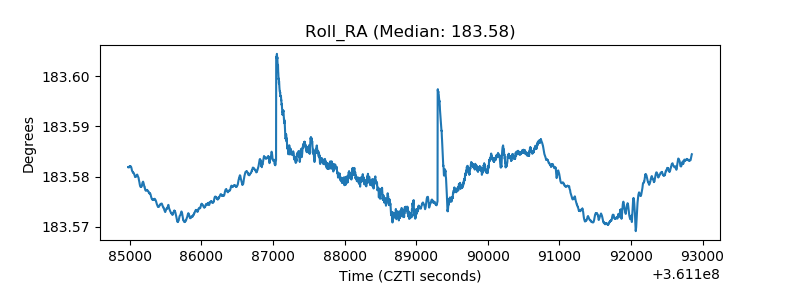 |
| Veto Counter | 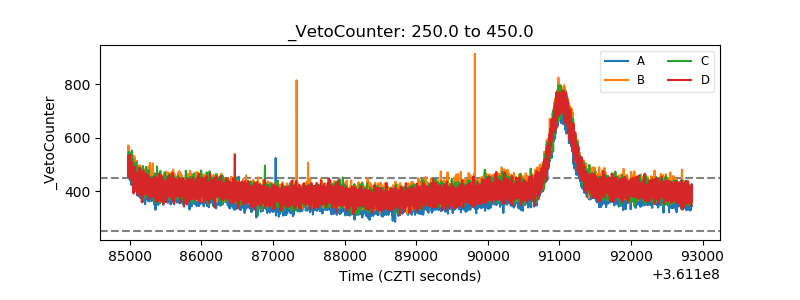 |