| Param | Original file | Final file |
|---|---|---|
| Filename | modeM0/AS1A10_071T40_9000004458_30852cztM0_level2.evt | modeM0/AS1A10_071T40_9000004458_30852cztM0_level2_quad_clean.evt |
| Size (bytes) | 241,488,000 | 48,709,440 |
| Size | 230.3 MB | 46.5 MB |
| Events in quadrant A | 1,185,070 | 334,598 |
| Events in quadrant B | 2,977,792 | 321,727 |
| Events in quadrant C | 1,263,556 | 317,705 |
| Events in quadrant D | 1,707,154 | 312,473 |
| Mode M0 | |||
|---|---|---|---|
| Quadrant | BADHDUFLAG | Total packets | Discarded packets |
| A | 0 | 5278 | 0 |
| B | 0 | 10772 | 0 |
| C | 0 | 5343 | 0 |
| D | 0 | 6940 | 0 |
| Mode SS | |||
|---|---|---|---|
| Quadrant | BADHDUFLAG | Total packets | Discarded packets |
| A | 0 | 52 | 0 |
| B | 0 | 52 | 0 |
| C | 0 | 52 | 0 |
| D | 0 | 52 | 0 |
| Quadrant | Total seconds | Saturated seconds | Saturation percentage |
|---|---|---|---|
| A | 2630 | 1 | 0.038023% |
| B | 2631 | 153 | 5.815279% |
| C | 2631 | 10 | 0.380084% |
| D | 2631 | 18 | 0.684151% |
Noise dominated data is calculated using 1-second bins in cleaned event files. If a bin has >2000 counts, and if more than 50% of those come from <1% of pixels, then it is considered to be noise-dominated and hence unusable.
| Quadrant | # 1 sec bins | Bins with >0 counts | Bins with >2000 counts | High rate bins dominated by noise | Noise dominated (total time) | Noise dominated (detector-on time) | Marked lightcurve |
|---|---|---|---|---|---|---|---|
| A | 2630 | 2630 | 0 | 0 | 0.00% | 0.00% | 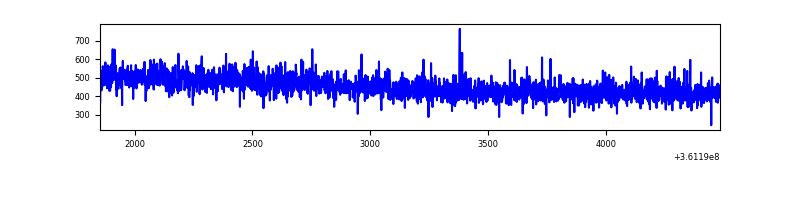 |
| B | 2631 | 2631 | 62 | 62 | 2.36% | 2.36% | 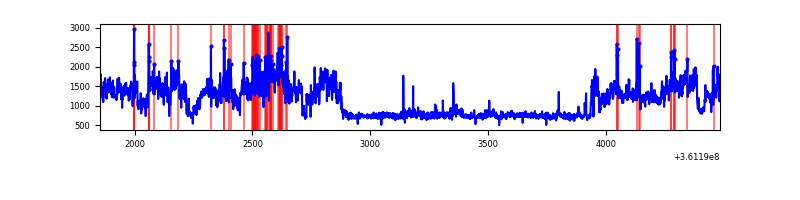 |
| C | 2631 | 2631 | 0 | 0 | 0.00% | 0.00% |  |
| D | 2631 | 2631 | 18 | 18 | 0.68% | 0.68% | 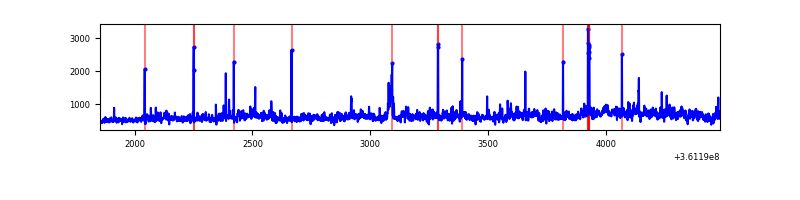 |
Top three noisy pixels from each quadrant. If the there are fewer than three noisy pixels in the level2.evt file, extra rows are filled as -1
| Pixel properties | Quadrant properties | ||||||
|---|---|---|---|---|---|---|---|
| Quadrant | DetID | PixID | Counts | Sigma | Mean | Median | Sigma |
| A | 13 | 254 | 4968 | 73.97 | 306 | 299 | 63.1 |
| A | 3 | 137 | 3039 | 43.41 | 306 | 299 | 63.1 |
| A | 0 | 226 | 2572 | 36.01 | 306 | 299 | 63.1 |
| B | 6 | 36 | 1002284 | 17048.26 | 297 | 289 | 58.8 |
| B | 6 | 159 | 709466 | 12066.16 | 297 | 289 | 58.8 |
| B | 5 | 255 | 37338 | 630.36 | 297 | 289 | 58.8 |
| C | 14 | 238 | 47749 | 675.63 | 291 | 293 | 70.2 |
| C | 3 | 233 | 30852 | 435.07 | 291 | 293 | 70.2 |
| C | 0 | 10 | 29112 | 410.29 | 291 | 293 | 70.2 |
| D | 8 | 195 | 497781 | 6911.16 | 296 | 289 | 72.0 |
| D | 1 | 52 | 24111 | 330.94 | 296 | 289 | 72.0 |
| D | 2 | 250 | 22246 | 305.03 | 296 | 289 | 72.0 |
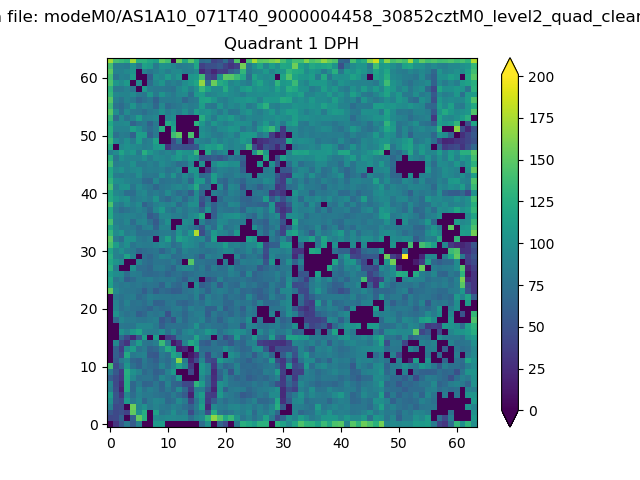
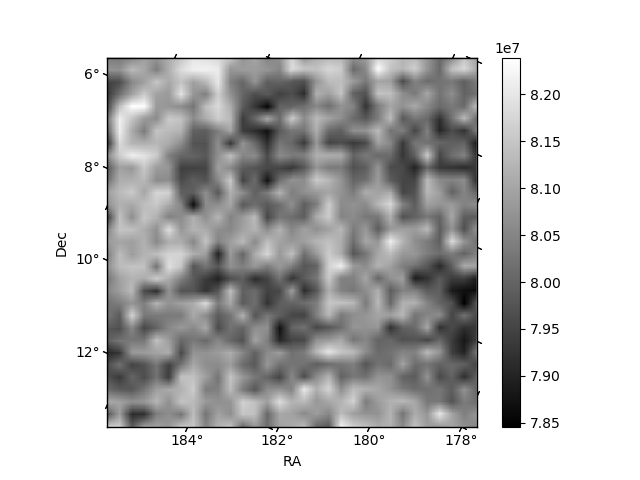
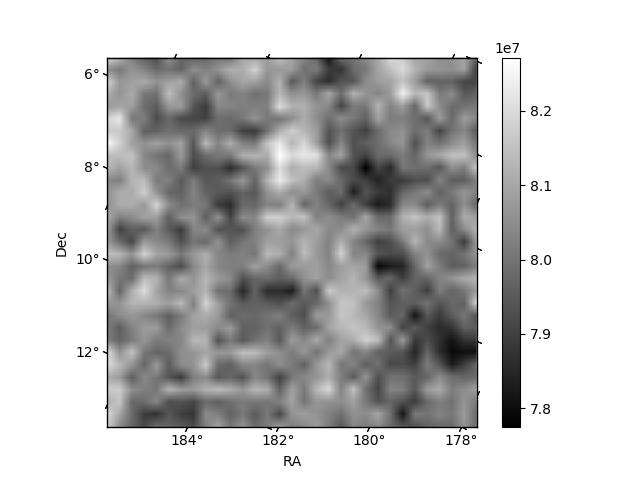
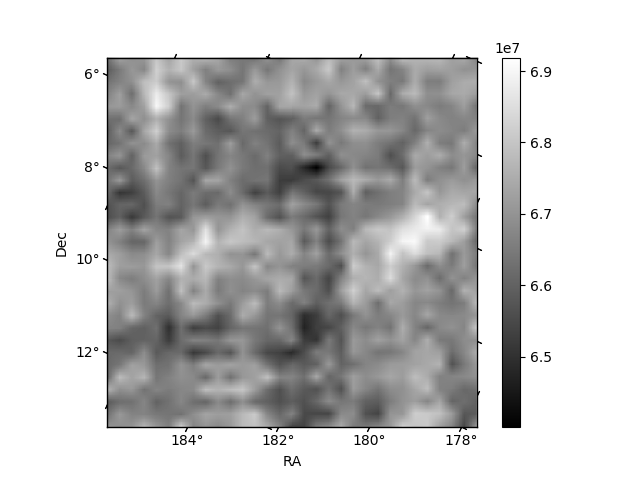
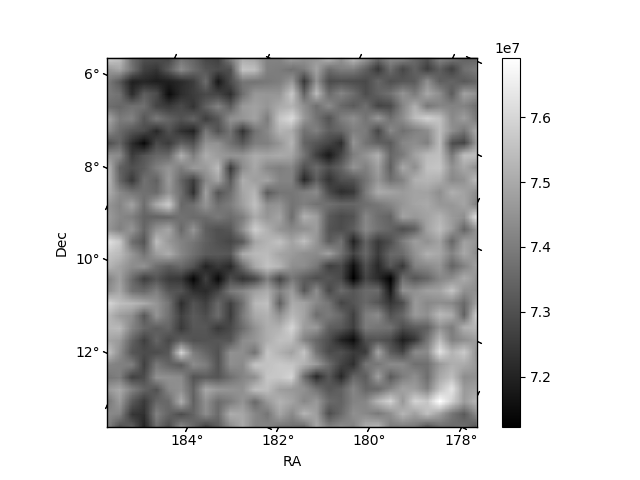
Histogram calculated using DETX and DETY for each event in the final _common_clean file
| Quadrant A | 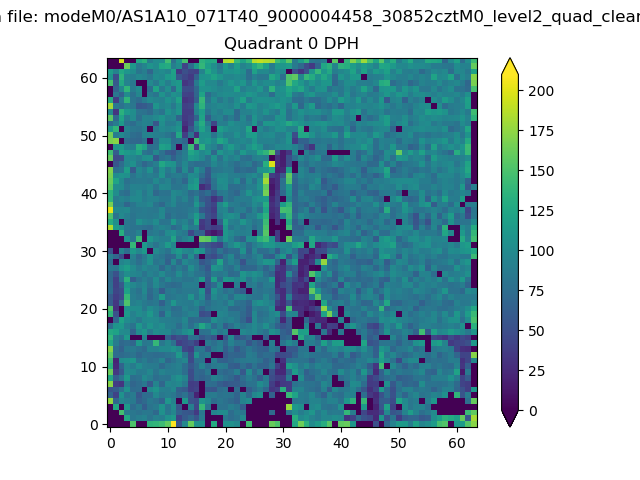 |
 |
Quadrant B |
|---|---|---|---|
| Quadrant D | 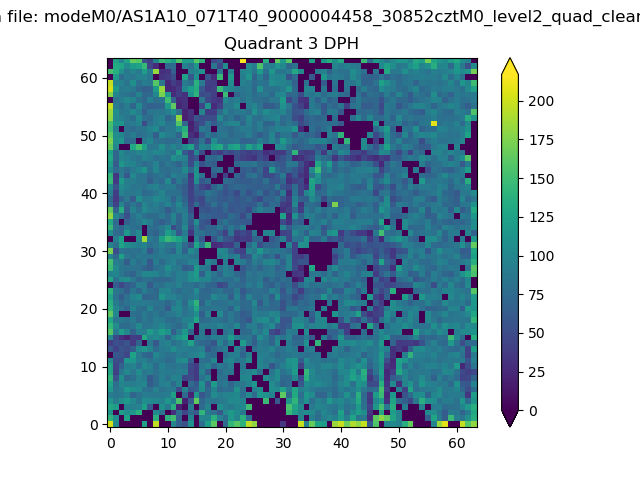 |
 |
Quadrant C |
| Plot type | Count rate plots | Images |
|---|---|---|
| Comparison with Poisson distribution Blue bars denote a histogram of data divided into 1 sec bins. Red curve is a Poisson curve with rate = median count rate of data. |
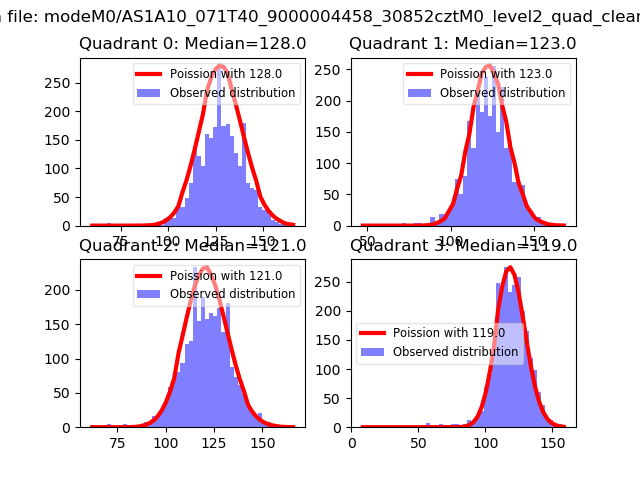 |
 |
| Quadrant-wise count rates Data is divided into 100 sec bins |
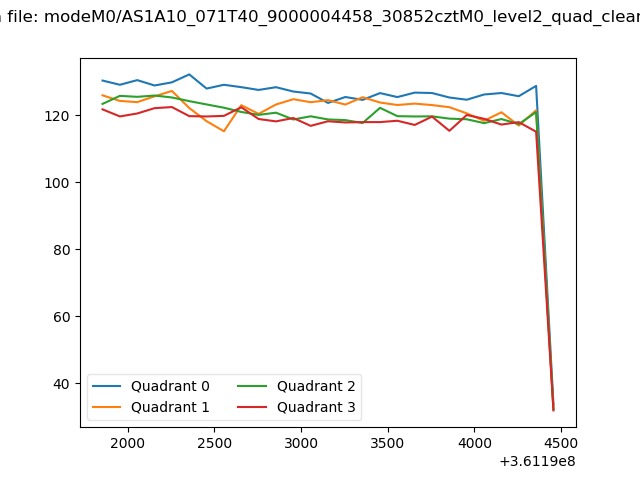 |
|
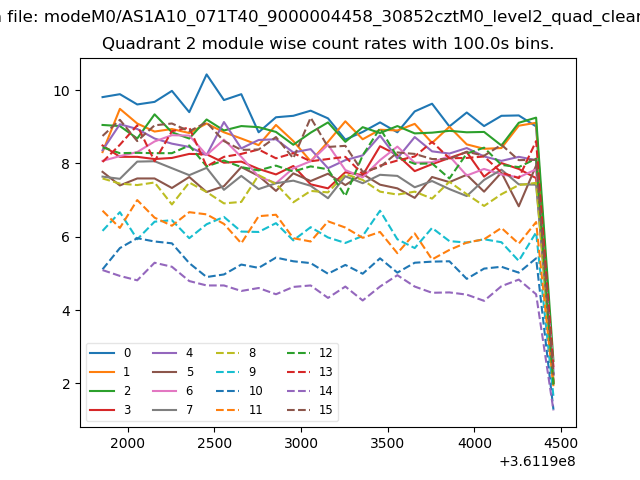
| Module-wise count rates for Quadrant A Data is divided into 100 sec bins |
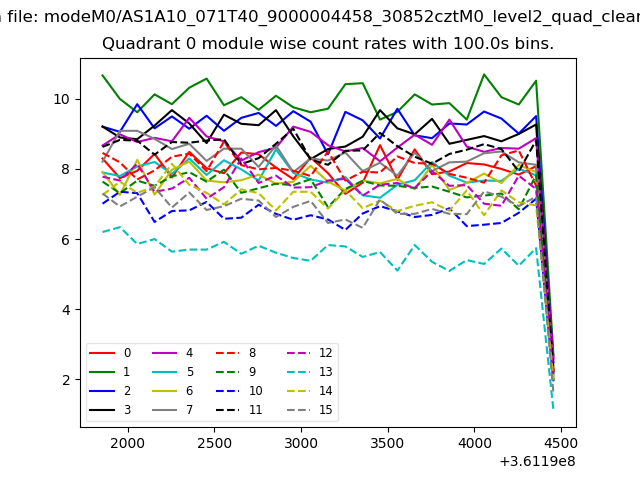 |
 |
| Module-wise count rates for Quadrant B Data is divided into 100 sec bins |
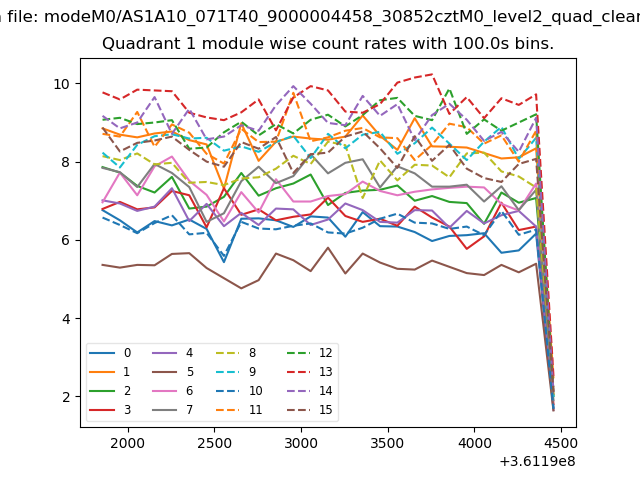 |
 |
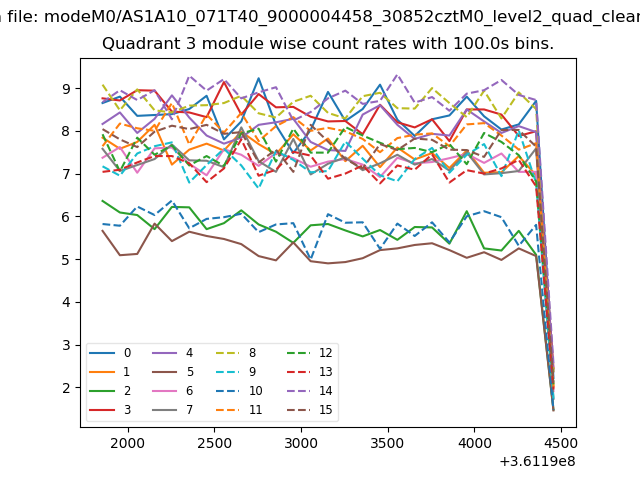
| Module-wise count rates for Quadrant C Data is divided into 100 sec bins |
 |
 |
| Module-wise count rates for Quadrant D Data is divided into 100 sec bins |
 |
 |
| Parameter | Plot |
|---|---|
| CZT HV Monitor | 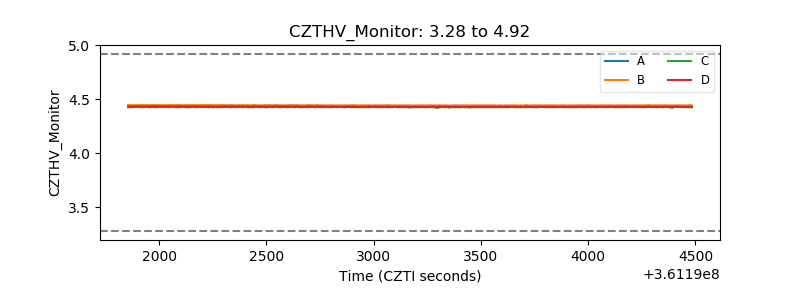 |
| D_VDD | 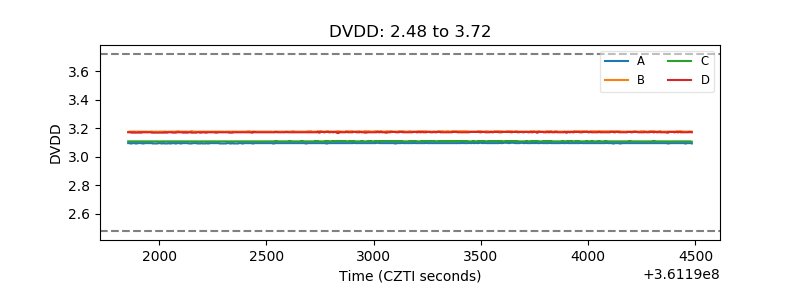 |
| Temperature 1 | 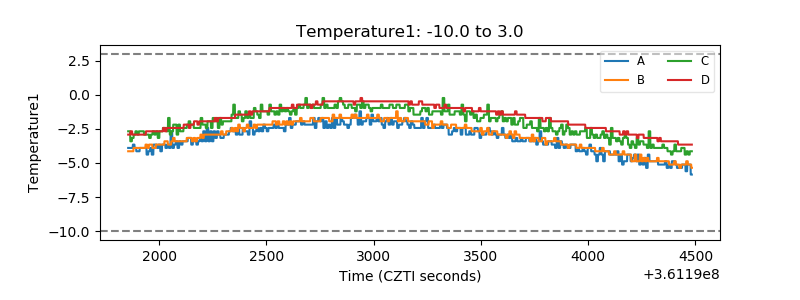 |
| Veto HV Monitor | 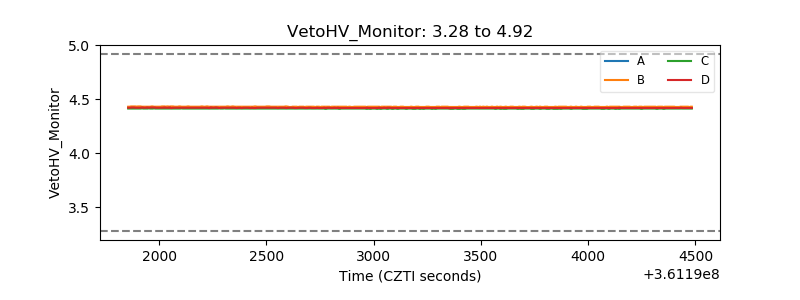 |
| Veto LLD | 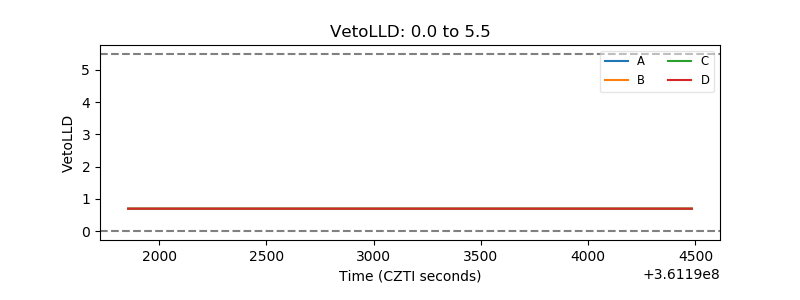 |
| Alpha Counter | 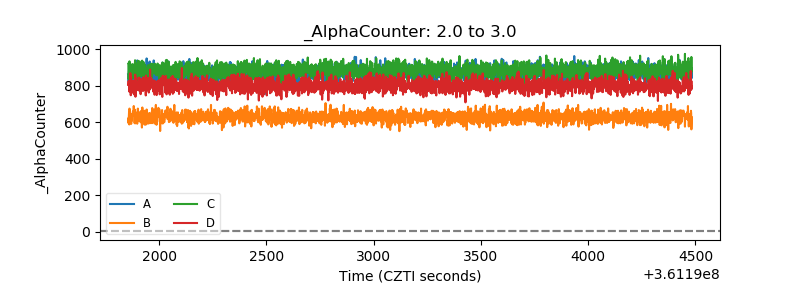 |
| _CPM_Rate | 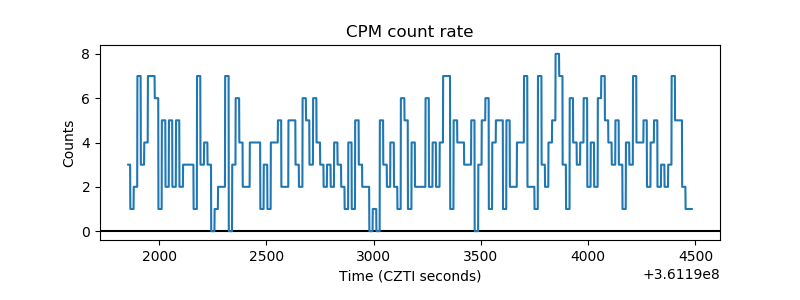 |
| CZT Counter | 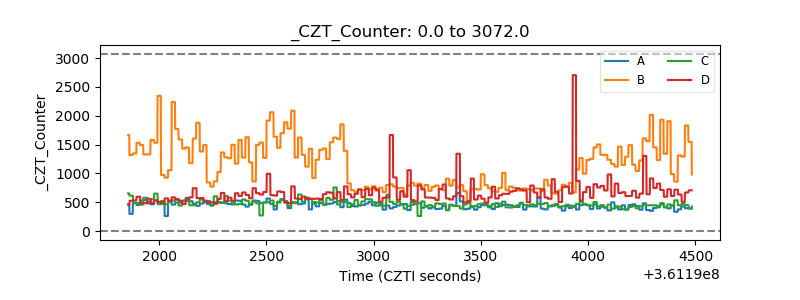 |
| +2.5 Volts monitor |  |
| +5 Volts monitor |  |
| _ROLL_ROT | 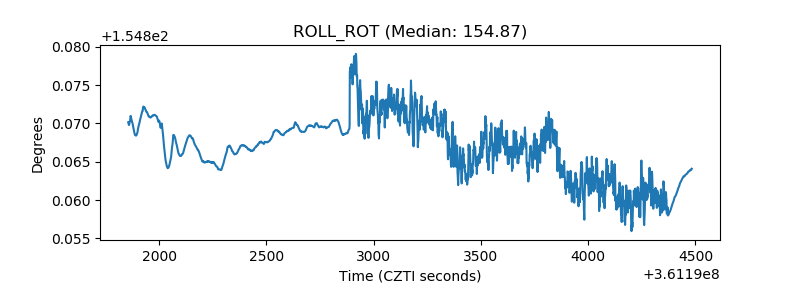 |
| _Roll_DEC | 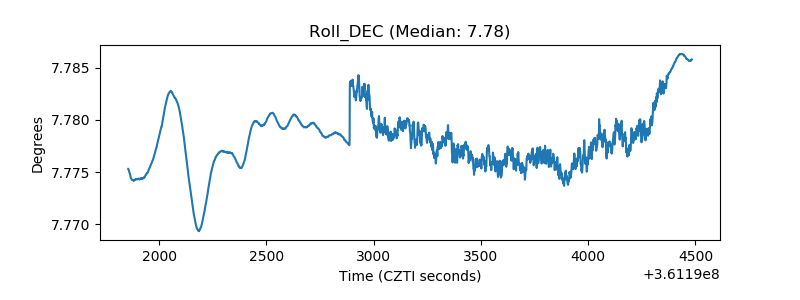 |
| _Roll_RA | 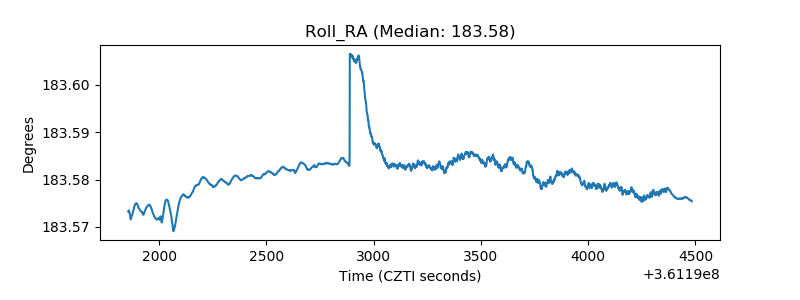 |
| Veto Counter | 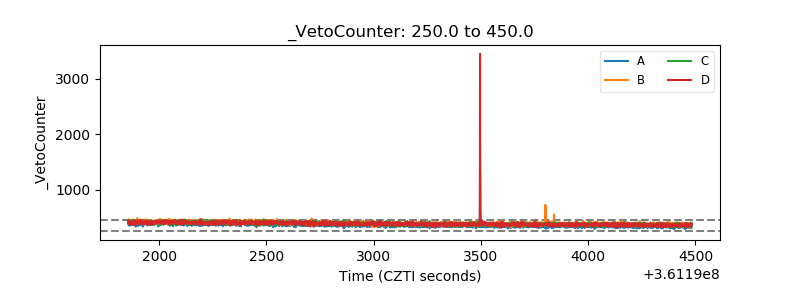 |