| Param | Original file | Final file |
|---|---|---|
| Filename | modeM0/AS1C06_006T01_9000004456cztM0_level2.fits | modeM0/AS1C06_006T01_9000004456cztM0_level2_quad_clean.evt |
| Size (bytes) | 69,756,480 | 70,496,640 |
| Size | 66.5 MB | 67.2 MB |
| Events in quadrant A | 430,672 | 432,335 |
| Events in quadrant B | 402,638 | 424,403 |
| Events in quadrant C | 406,366 | 395,100 |
| Events in quadrant D | 364,378 | 374,254 |
| Mode M0 | |||
|---|---|---|---|
| Quadrant | BADHDUFLAG | Total packets | Discarded packets |
| A | 0 | 15146 | 0 |
| B | 0 | 22401 | 0 |
| C | 0 | 16766 | 0 |
| D | 0 | 16452 | 0 |
| Mode SS | |||
|---|---|---|---|
| Quadrant | BADHDUFLAG | Total packets | Discarded packets |
| A | 0 | 146 | 0 |
| B | 0 | 146 | 0 |
| C | 0 | 146 | 0 |
| D | 0 | 146 | 0 |
| Quadrant | Total seconds | Saturated seconds | Saturation percentage |
|---|---|---|---|
| A | 7300 | 347 | 4.753425% |
| B | 7300 | 464 | 6.356164% |
| C | 7300 | 539 | 7.383562% |
| D | 7300 | 284 | 3.890411% |
Noise dominated data is calculated using 1-second bins in cleaned event files. If a bin has >2000 counts, and if more than 50% of those come from <1% of pixels, then it is considered to be noise-dominated and hence unusable.
| Quadrant | # 1 sec bins | Bins with >0 counts | Bins with >2000 counts | High rate bins dominated by noise | Noise dominated (total time) | Noise dominated (detector-on time) | Marked lightcurve |
|---|---|---|---|---|---|---|---|
| A | 7300 | 7300 | 0 | 0 | 0.00% | 0.00% |  |
| B | 7300 | 7300 | 0 | 0 | 0.00% | 0.00% |  |
| C | 7300 | 7297 | 0 | 0 | 0.00% | 0.00% |  |
| D | 7300 | 7298 | 0 | 0 | 0.00% | 0.00% |  |
Top three noisy pixels from each quadrant. If the there are fewer than three noisy pixels in the level2.evt file, extra rows are filled as -1
| Pixel properties | Quadrant properties | ||||||
|---|---|---|---|---|---|---|---|
| Quadrant | DetID | PixID | Counts | Sigma | Mean | Median | Sigma |
| A | 0 | 29 | 439 | 11.2 | 112 | 105 | 29.8 |
| A | 7 | 110 | 350 | 8.22 | 112 | 105 | 29.8 |
| A | 0 | 30 | 345 | 8.05 | 112 | 105 | 29.8 |
| B | 2 | 9 | 353 | 10.85 | 106 | 101 | 23.2 |
| B | 5 | 225 | 290 | 8.14 | 106 | 101 | 23.2 |
| B | 14 | 254 | 286 | 7.96 | 106 | 101 | 23.2 |
| C | 12 | 241 | 299 | 6.85 | 107 | 100 | 29.1 |
| C | 9 | 233 | 287 | 6.43 | 107 | 100 | 29.1 |
| C | 2 | 191 | 284 | 6.33 | 107 | 100 | 29.1 |
| D | 15 | 47 | 264 | 5.81 | 103 | 94 | 29.2 |
| D | 6 | 231 | 255 | 5.51 | 103 | 94 | 29.2 |
| D | 3 | 159 | 255 | 5.51 | 103 | 94 | 29.2 |
Histogram calculated using DETX and DETY for each event in the final _common_clean file
| Quadrant A | 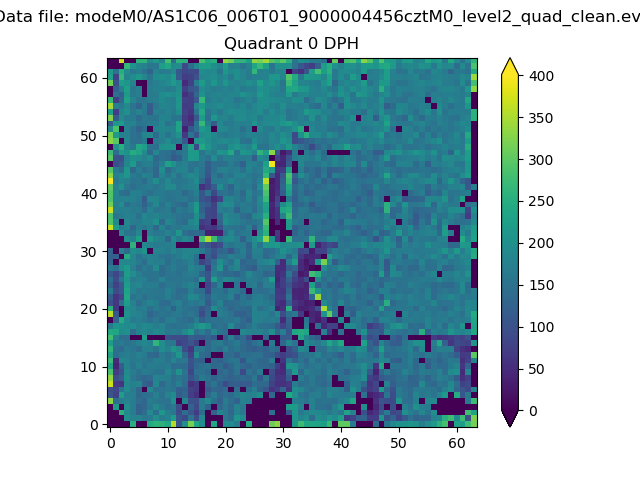 |
 |
Quadrant B |
|---|---|---|---|
| Quadrant D |  |
 |
Quadrant C |
| Plot type | Count rate plots | Images |
|---|---|---|
| Comparison with Poisson distribution Blue bars denote a histogram of data divided into 1 sec bins. Red curve is a Poisson curve with rate = median count rate of data. |
 |
 |
| Quadrant-wise count rates Data is divided into 100 sec bins |
 |
|
| Module-wise count rates for Quadrant A Data is divided into 100 sec bins |
 |
 |
| Module-wise count rates for Quadrant B Data is divided into 100 sec bins |
 |
 |
| Module-wise count rates for Quadrant C Data is divided into 100 sec bins |
 |
 |
| Module-wise count rates for Quadrant D Data is divided into 100 sec bins |
 |
 |
| Parameter | Plot |
|---|---|
| CZT HV Monitor |  |
| D_VDD |  |
| Temperature 1 |  |
| Veto HV Monitor |  |
| Veto LLD |  |
| Alpha Counter |  |
| _CPM_Rate |  |
| CZT Counter |  |
| +2.5 Volts monitor |  |
| +5 Volts monitor |  |
| _ROLL_ROT |  |
| _Roll_DEC |  |
| _Roll_RA |  |
| Veto Counter |  |