| Param | Original file | Final file |
|---|---|---|
| Filename | modeM0/AS1C06_006T01_9000004456_30836cztM0_level2.evt | modeM0/AS1C06_006T01_9000004456_30836cztM0_level2_quad_clean.evt |
| Size (bytes) | 321,275,520 | 39,922,560 |
| Size | 306.4 MB | 38.1 MB |
| Events in quadrant A | 1,968,826 | 240,280 |
| Events in quadrant B | 3,144,879 | 240,944 |
| Events in quadrant C | 2,279,619 | 224,411 |
| Events in quadrant D | 2,071,543 | 228,936 |
| Mode M0 | |||
|---|---|---|---|
| Quadrant | BADHDUFLAG | Total packets | Discarded packets |
| A | 0 | 8280 | 0 |
| B | 0 | 12019 | 0 |
| C | 0 | 9233 | 0 |
| D | 0 | 8546 | 0 |
| Mode SS | |||
|---|---|---|---|
| Quadrant | BADHDUFLAG | Total packets | Discarded packets |
| A | 0 | 78 | 0 |
| B | 0 | 78 | 0 |
| C | 0 | 78 | 0 |
| D | 0 | 78 | 0 |
| Quadrant | Total seconds | Saturated seconds | Saturation percentage |
|---|---|---|---|
| A | 3874 | 344 | 8.879711% |
| B | 3874 | 445 | 11.486835% |
| C | 3874 | 510 | 13.164688% |
| D | 3874 | 265 | 6.840475% |
Noise dominated data is calculated using 1-second bins in cleaned event files. If a bin has >2000 counts, and if more than 50% of those come from <1% of pixels, then it is considered to be noise-dominated and hence unusable.
| Quadrant | # 1 sec bins | Bins with >0 counts | Bins with >2000 counts | High rate bins dominated by noise | Noise dominated (total time) | Noise dominated (detector-on time) | Marked lightcurve |
|---|---|---|---|---|---|---|---|
| A | 3874 | 3874 | 0 | 0 | 0.00% | 0.00% |  |
| B | 3874 | 3874 | 6 | 6 | 0.15% | 0.15% |  |
| C | 3874 | 3874 | 0 | 0 | 0.00% | 0.00% |  |
| D | 3874 | 3874 | 6 | 6 | 0.15% | 0.15% |  |
Top three noisy pixels from each quadrant. If the there are fewer than three noisy pixels in the level2.evt file, extra rows are filled as -1
| Pixel properties | Quadrant properties | ||||||
|---|---|---|---|---|---|---|---|
| Quadrant | DetID | PixID | Counts | Sigma | Mean | Median | Sigma |
| A | 13 | 254 | 6876 | 60.68 | 509 | 497 | 105.1 |
| A | 3 | 137 | 5412 | 46.75 | 509 | 497 | 105.1 |
| A | 0 | 226 | 4200 | 35.22 | 509 | 497 | 105.1 |
| B | 6 | 159 | 1083314 | 10948.89 | 497 | 482 | 98.9 |
| B | 5 | 255 | 42888 | 428.78 | 497 | 482 | 98.9 |
| B | 0 | 230 | 30805 | 306.61 | 497 | 482 | 98.9 |
| C | 3 | 233 | 164037 | 1438.93 | 477 | 478 | 113.7 |
| C | 14 | 238 | 148881 | 1305.59 | 477 | 478 | 113.7 |
| C | 14 | 254 | 94936 | 831.01 | 477 | 478 | 113.7 |
| D | 8 | 195 | 90198 | 757.56 | 492 | 476 | 118.4 |
| D | 1 | 52 | 64830 | 543.37 | 492 | 476 | 118.4 |
| D | 2 | 250 | 18397 | 151.31 | 492 | 476 | 118.4 |
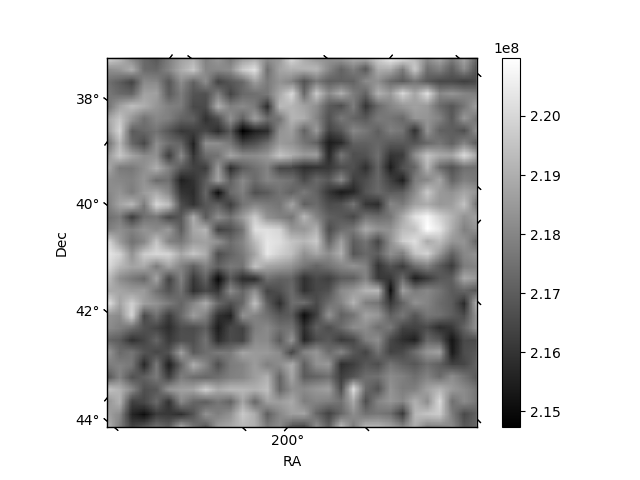
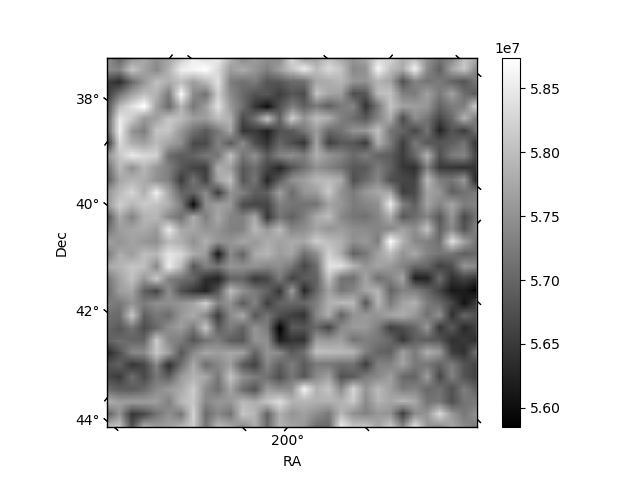
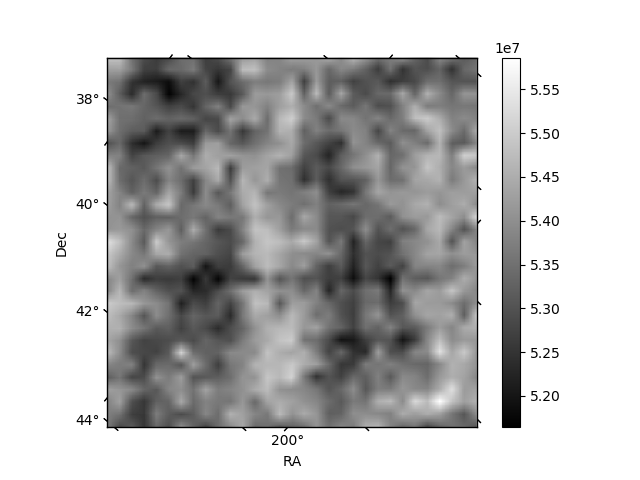
Histogram calculated using DETX and DETY for each event in the final _common_clean file
| Quadrant A | 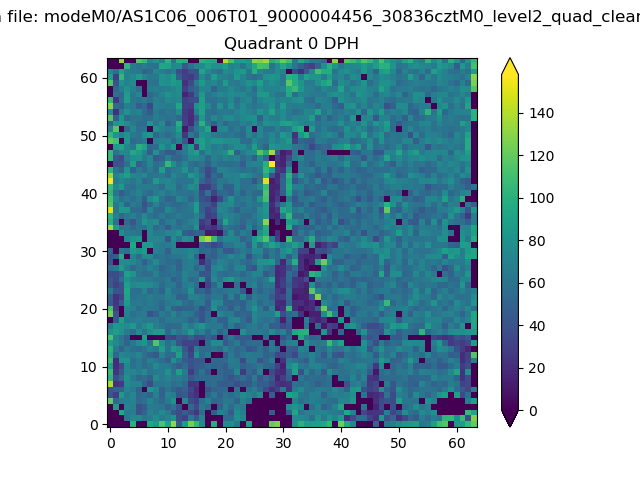 |
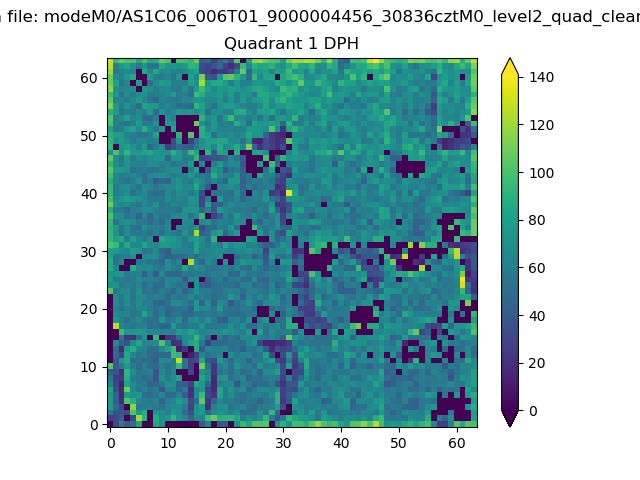 |
Quadrant B |
|---|---|---|---|
| Quadrant D | 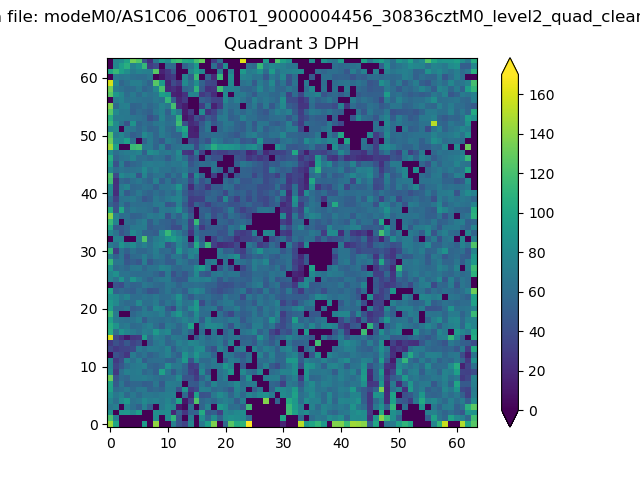 |
 |
Quadrant C |
| Plot type | Count rate plots | Images |
|---|---|---|
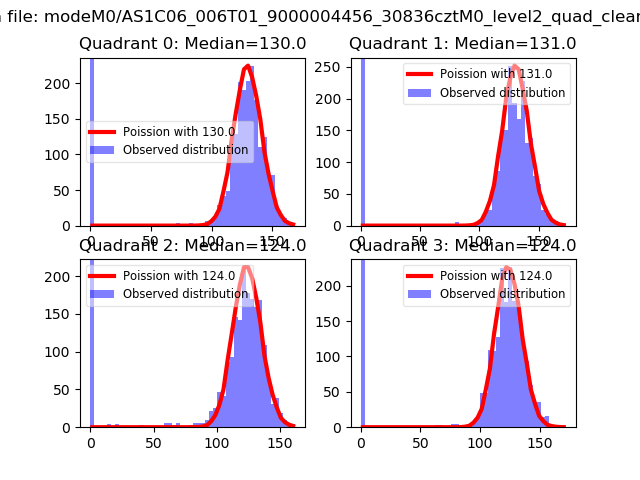
| Comparison with Poisson distribution Blue bars denote a histogram of data divided into 1 sec bins. Red curve is a Poisson curve with rate = median count rate of data. |
 |
 |
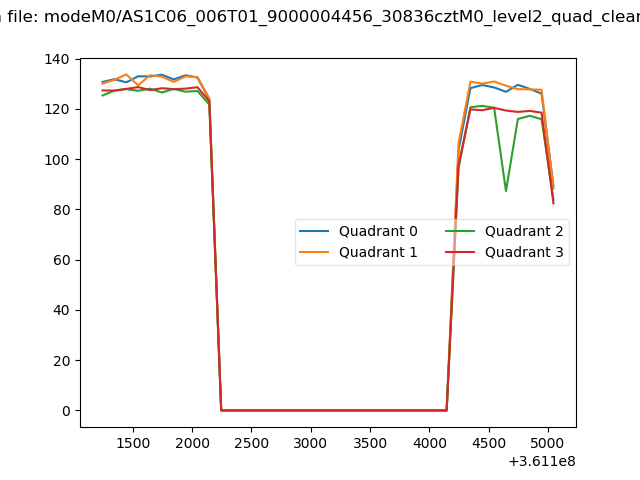
| Quadrant-wise count rates Data is divided into 100 sec bins |
 |
|
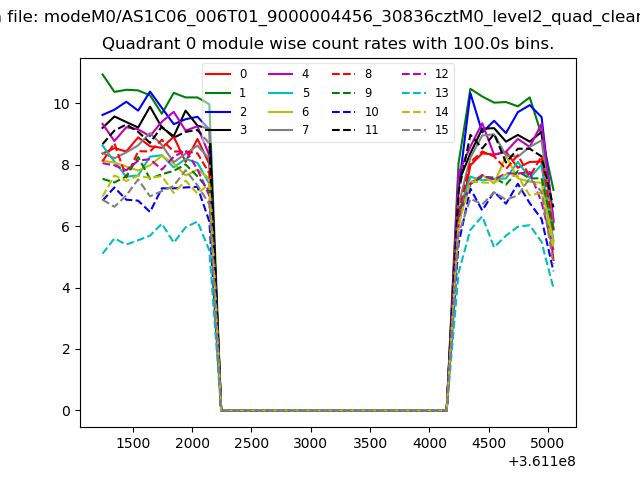
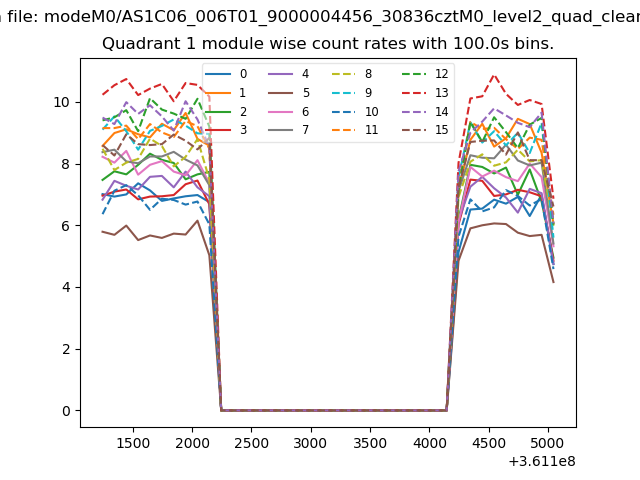
| Module-wise count rates for Quadrant A Data is divided into 100 sec bins |
 |
 |
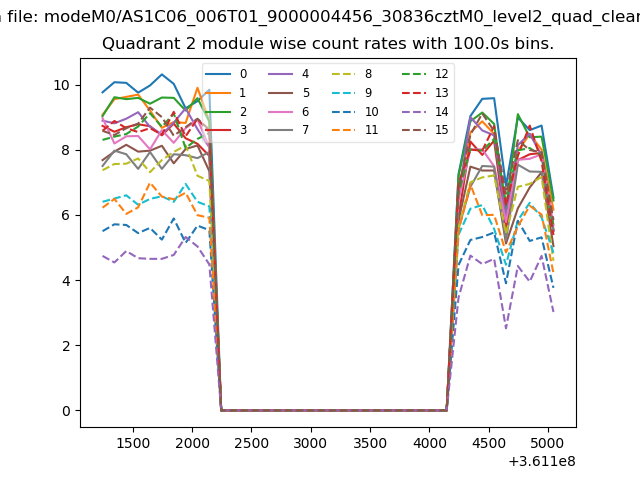
| Module-wise count rates for Quadrant B Data is divided into 100 sec bins |
 |
 |
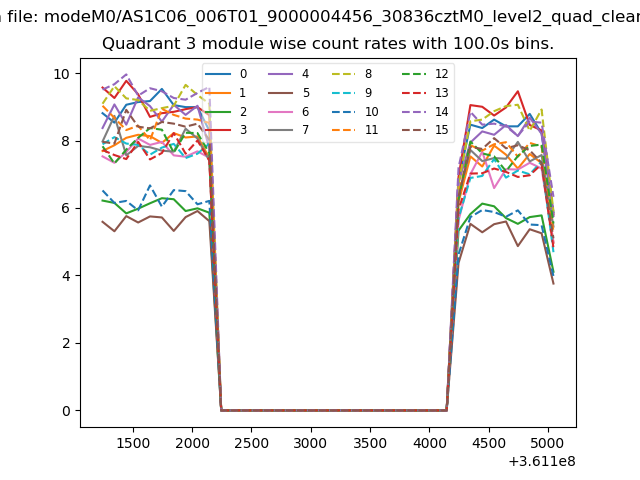
| Module-wise count rates for Quadrant C Data is divided into 100 sec bins |
 |
 |
| Module-wise count rates for Quadrant D Data is divided into 100 sec bins |
 |
 |
| Parameter | Plot |
|---|---|
| CZT HV Monitor | 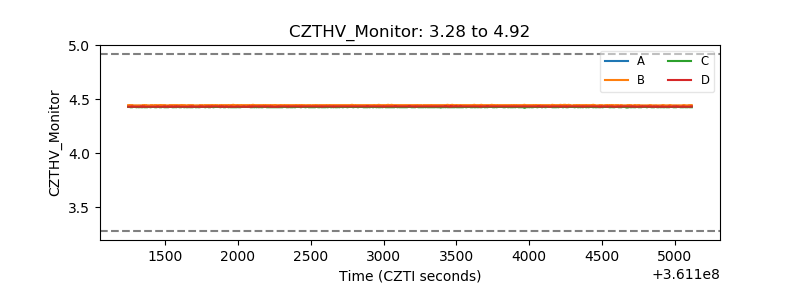 |
| D_VDD |  |
| Temperature 1 | 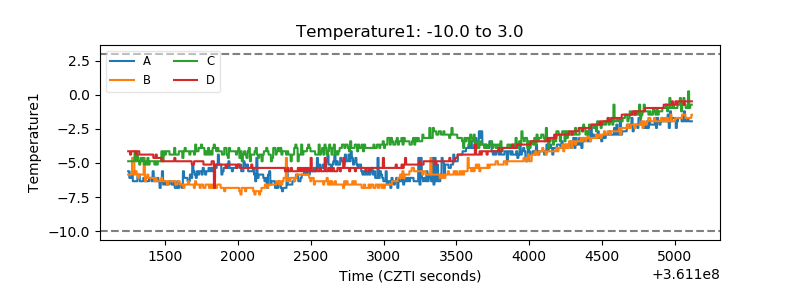 |
| Veto HV Monitor | 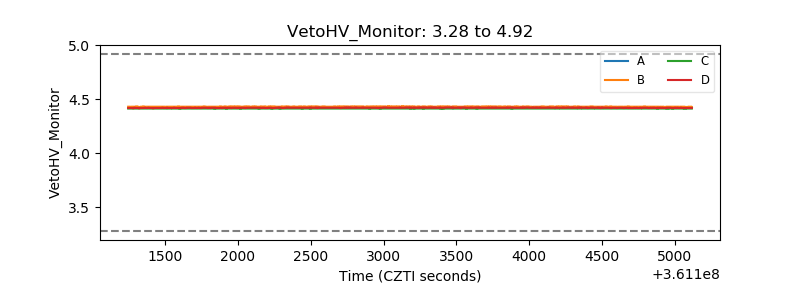 |
| Veto LLD | 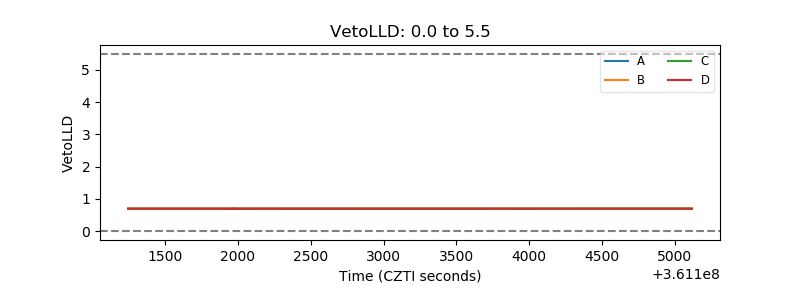 |
| Alpha Counter | 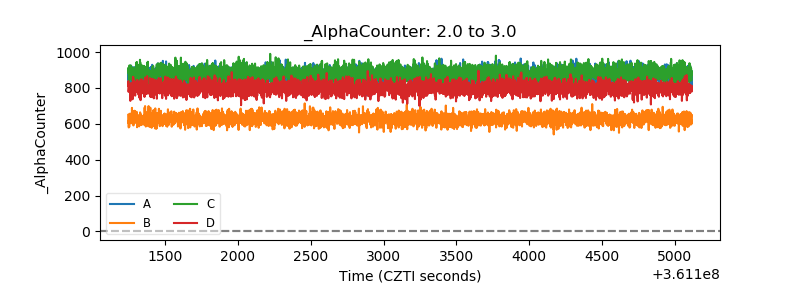 |
| _CPM_Rate | 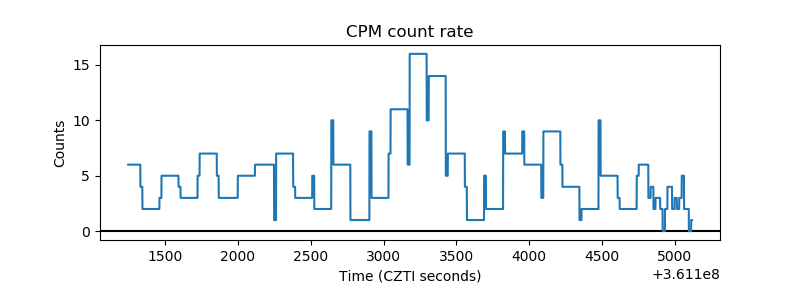 |
| CZT Counter |  |
| +2.5 Volts monitor |  |
| +5 Volts monitor |  |
| _ROLL_ROT | 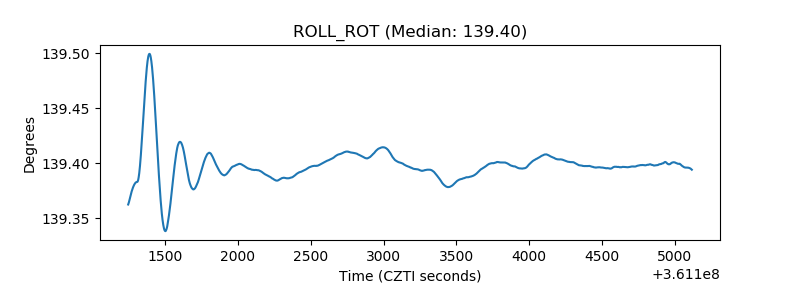 |
| _Roll_DEC | 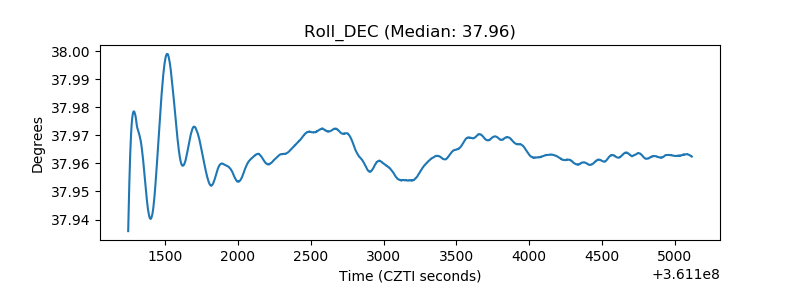 |
| _Roll_RA |  |
| Veto Counter | 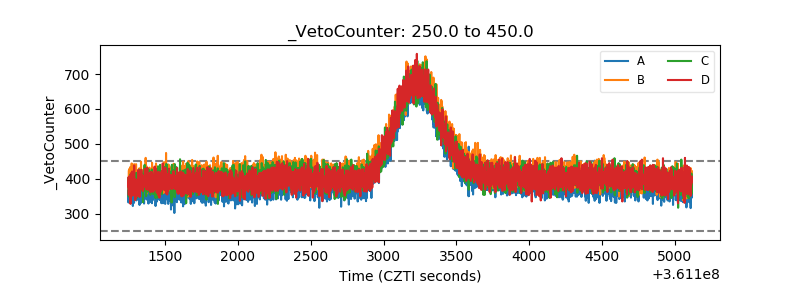 |