| Param | Original file | Final file |
|---|---|---|
| Filename | modeM0/AS1A10_071T46_9000004460cztM0_level2.fits | modeM0/AS1A10_071T46_9000004460cztM0_level2_quad_clean.evt |
| Size (bytes) | 749,272,320 | 577,005,120 |
| Size | 714.6 MB | 550.3 MB |
| Events in quadrant A | 4,803,152 | 3,375,418 |
| Events in quadrant B | 4,152,012 | 2,884,233 |
| Events in quadrant C | 4,532,534 | 3,137,334 |
| Events in quadrant D | 4,012,414 | 2,890,971 |
| Mode M0 | |||
|---|---|---|---|
| Quadrant | BADHDUFLAG | Total packets | Discarded packets |
| A | 0 | 160011 | 0 |
| B | 0 | 381454 | 0 |
| C | 0 | 169197 | 0 |
| D | 0 | 180079 | 0 |
| Mode SS | |||
|---|---|---|---|
| Quadrant | BADHDUFLAG | Total packets | Discarded packets |
| A | 0 | 1536 | 0 |
| B | 0 | 1536 | 0 |
| C | 0 | 1536 | 0 |
| D | 0 | 1536 | 0 |
| Mode M9 | |||
|---|---|---|---|
| Quadrant | BADHDUFLAG | Total packets | Discarded packets |
| A | 0 | 115 | 0 |
| B | 0 | 115 | 0 |
| C | 0 | 115 | 0 |
| D | 0 | 115 | 0 |
| Quadrant | Total seconds | Saturated seconds | Saturation percentage |
|---|---|---|---|
| A | 75599 | 1386 | 1.833358% |
| B | 75599 | 17526 | 23.182846% |
| C | 75599 | 2343 | 3.099247% |
| D | 75599 | 1430 | 1.891559% |
Noise dominated data is calculated using 1-second bins in cleaned event files. If a bin has >2000 counts, and if more than 50% of those come from <1% of pixels, then it is considered to be noise-dominated and hence unusable.
| Quadrant | # 1 sec bins | Bins with >0 counts | Bins with >2000 counts | High rate bins dominated by noise | Noise dominated (total time) | Noise dominated (detector-on time) | Marked lightcurve |
|---|---|---|---|---|---|---|---|
| A | 87019 | 75587 | 0 | 0 | 0.00% | 0.00% | 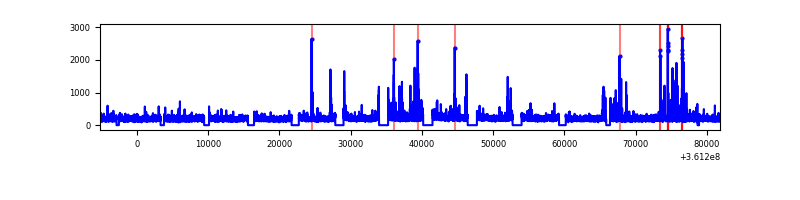 |
| B | 87019 | 75584 | 0 | 0 | 0.00% | 0.00% | 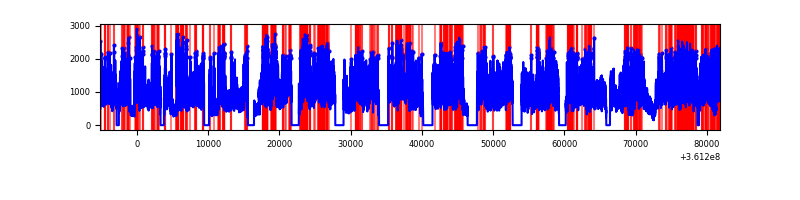 |
| C | 87019 | 75587 | 0 | 0 | 0.00% | 0.00% | 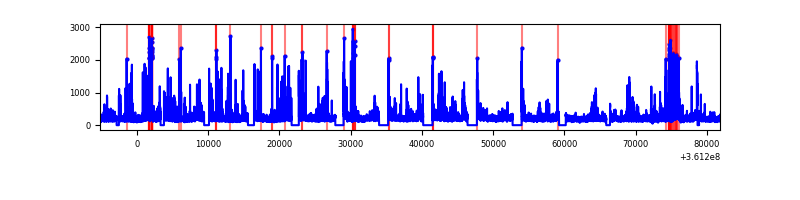 |
| D | 87019 | 75589 | 0 | 0 | 0.00% | 0.00% | 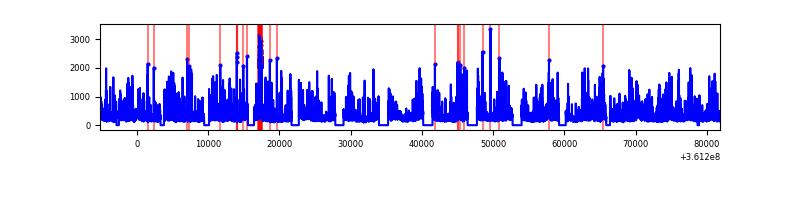 |
Top three noisy pixels from each quadrant. If the there are fewer than three noisy pixels in the level2.evt file, extra rows are filled as -1
| Pixel properties | Quadrant properties | ||||||
|---|---|---|---|---|---|---|---|
| Quadrant | DetID | PixID | Counts | Sigma | Mean | Median | Sigma |
| A | 0 | 29 | 3903 | 8.99 | 1248 | 1171 | 303.9 |
| A | 7 | 110 | 3780 | 8.58 | 1248 | 1171 | 303.9 |
| A | 9 | 19 | 3535 | 7.78 | 1248 | 1171 | 303.9 |
| B | 2 | 9 | 3327 | 10.6 | 1097 | 1047 | 215.0 |
| B | 5 | 232 | 2846 | 8.37 | 1097 | 1047 | 215.0 |
| B | 3 | 80 | 2798 | 8.14 | 1097 | 1047 | 215.0 |
| C | 12 | 241 | 3140 | 6.67 | 1199 | 1120 | 302.9 |
| C | 3 | 187 | 3051 | 6.38 | 1199 | 1120 | 302.9 |
| C | 9 | 209 | 3043 | 6.35 | 1199 | 1120 | 302.9 |
| D | 6 | 231 | 2912 | 6.05 | 1147 | 1042 | 309.0 |
| D | 3 | 14 | 2887 | 5.97 | 1147 | 1042 | 309.0 |
| D | 15 | 47 | 2832 | 5.79 | 1147 | 1042 | 309.0 |
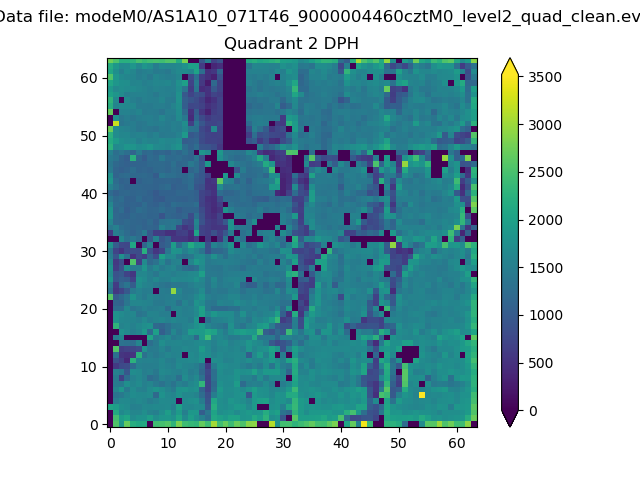
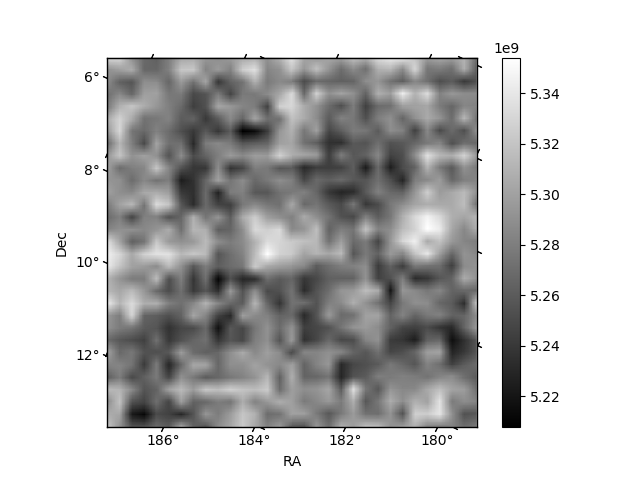
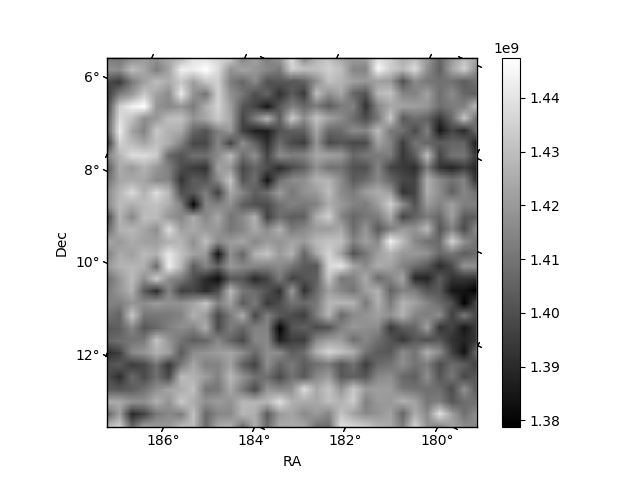
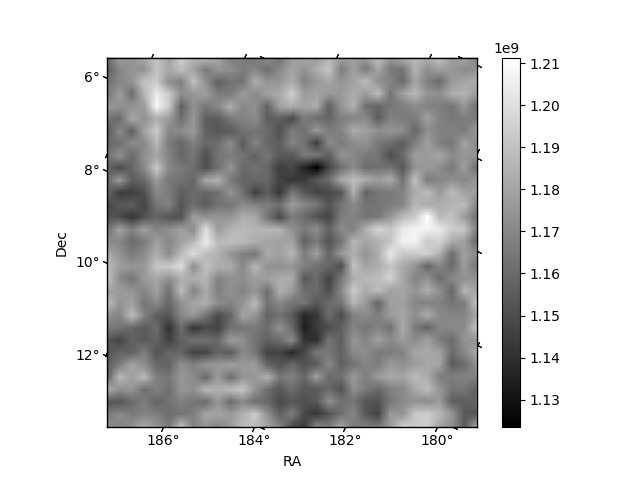
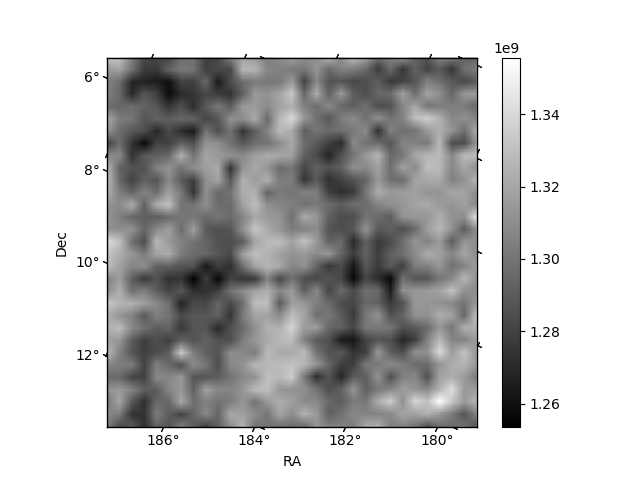
Histogram calculated using DETX and DETY for each event in the final _common_clean file
| Quadrant A | 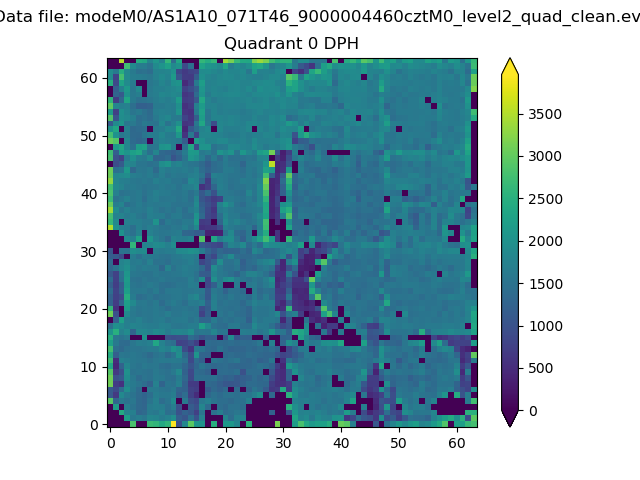 |
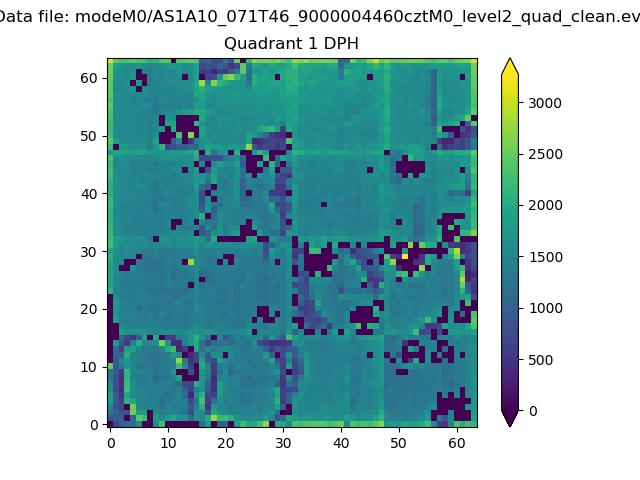 |
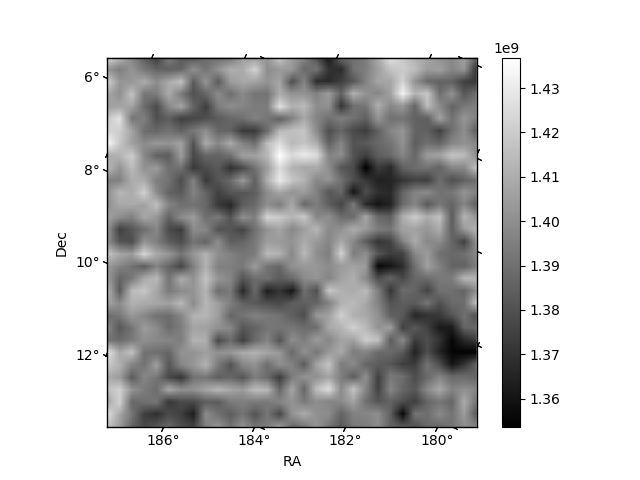
Quadrant B |
|---|---|---|---|
| Quadrant D | 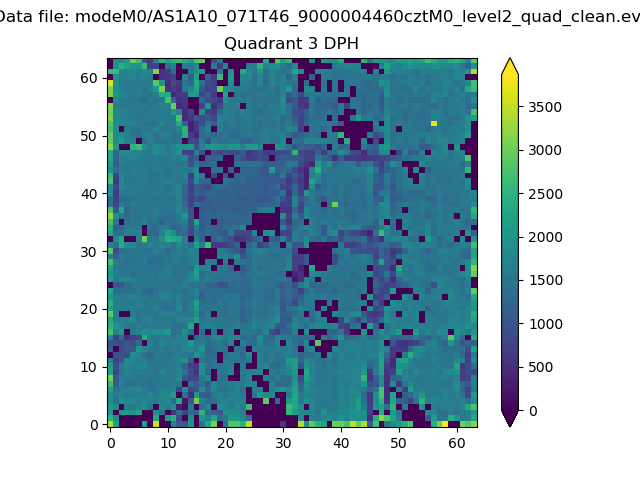 |
 |
Quadrant C |
| Plot type | Count rate plots | Images |
|---|---|---|
| Comparison with Poisson distribution Blue bars denote a histogram of data divided into 1 sec bins. Red curve is a Poisson curve with rate = median count rate of data. |
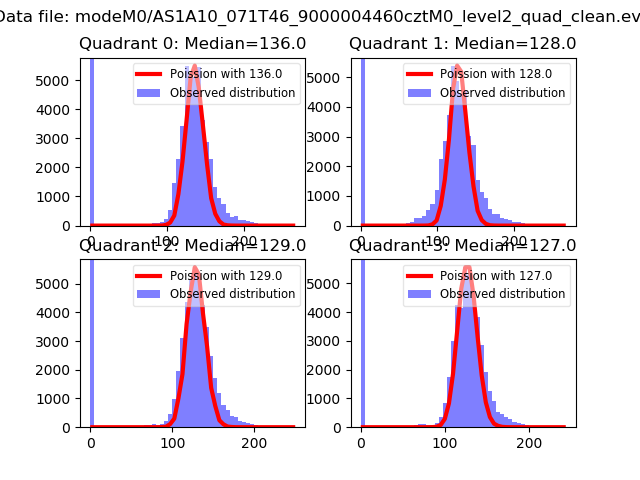 |
 |
| Quadrant-wise count rates Data is divided into 100 sec bins |
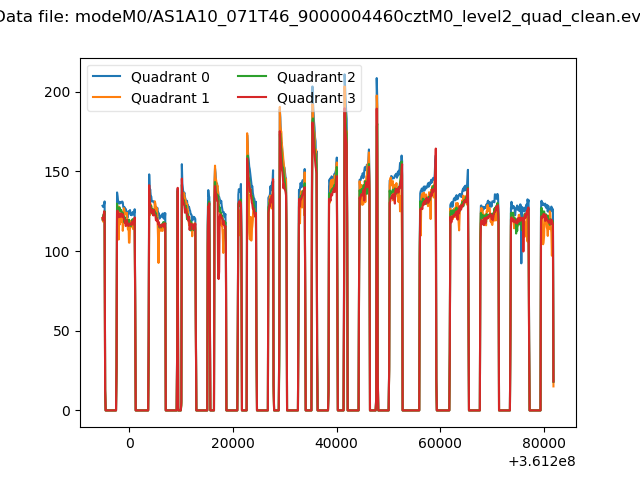 |
|
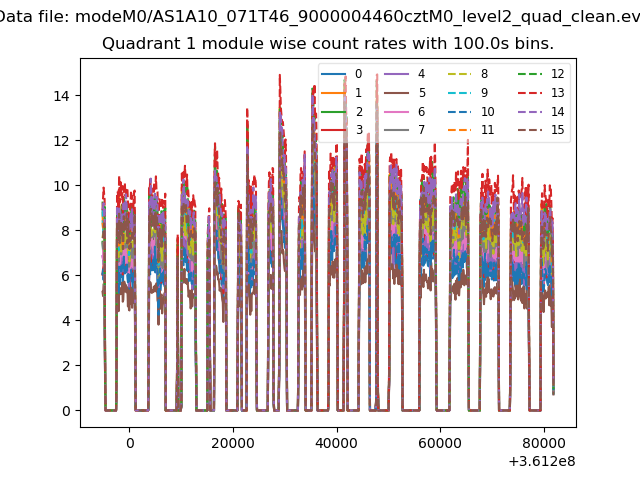
| Module-wise count rates for Quadrant A Data is divided into 100 sec bins |
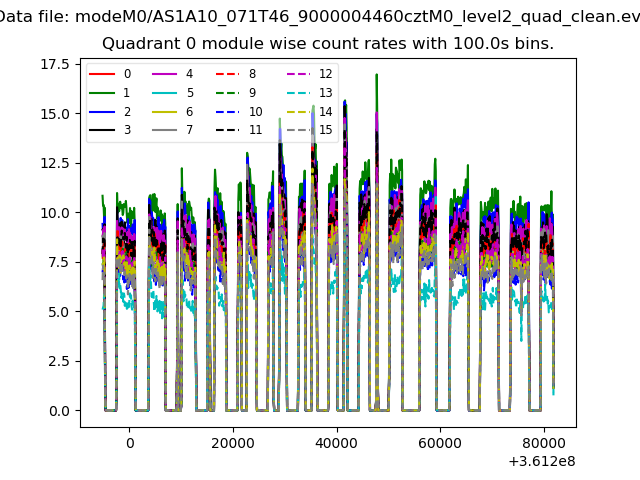 |
 |
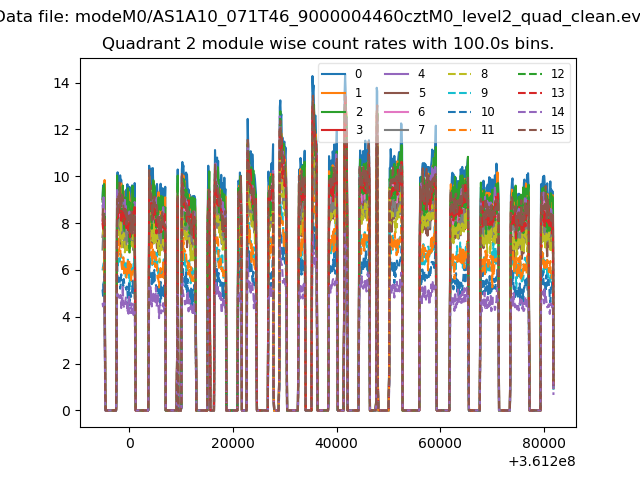
| Module-wise count rates for Quadrant B Data is divided into 100 sec bins |
 |
 |
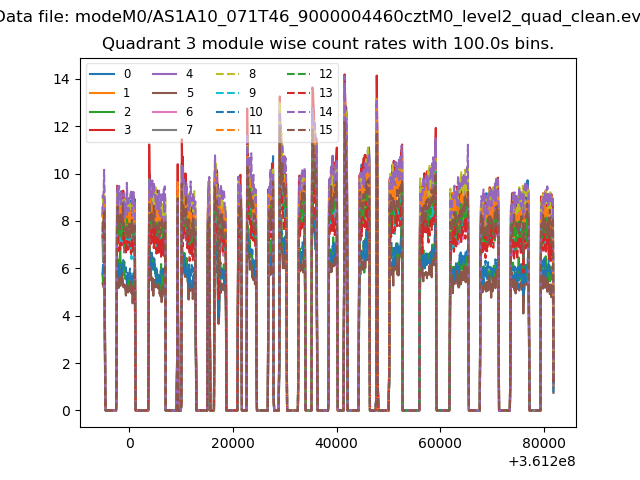
| Module-wise count rates for Quadrant C Data is divided into 100 sec bins |
 |
 |
| Module-wise count rates for Quadrant D Data is divided into 100 sec bins |
 |
 |
| Parameter | Plot |
|---|---|
| CZT HV Monitor | 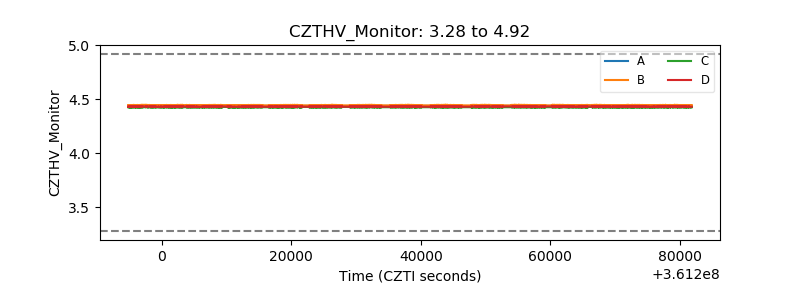 |
| D_VDD | 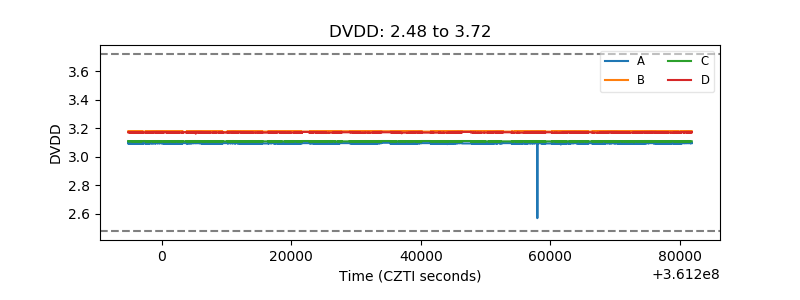 |
| Temperature 1 | 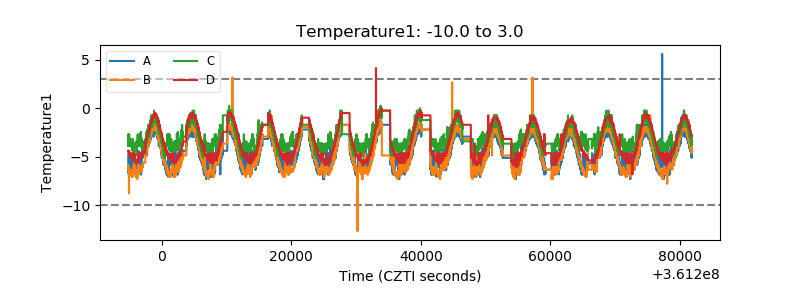 |
| Veto HV Monitor | 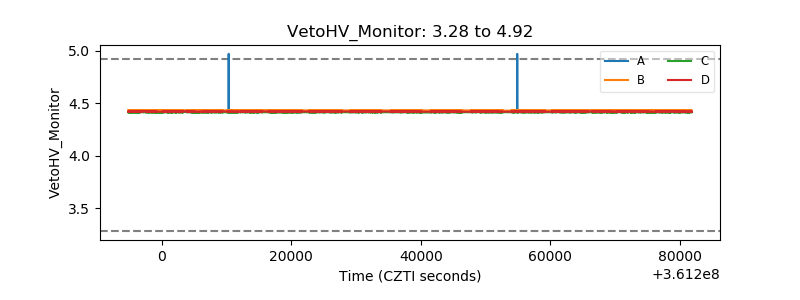 |
| Veto LLD | 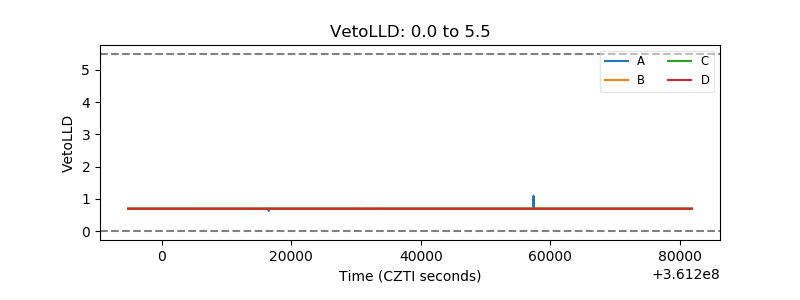 |
| Alpha Counter | 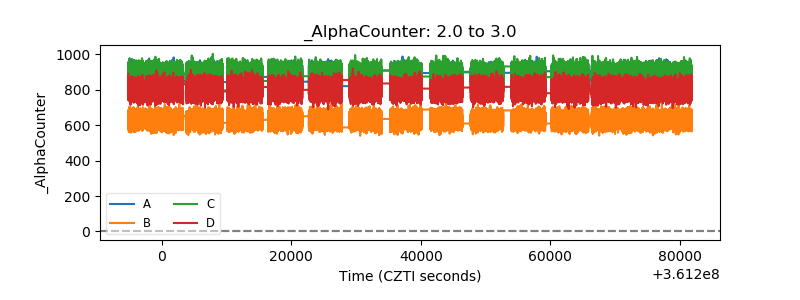 |
| _CPM_Rate | 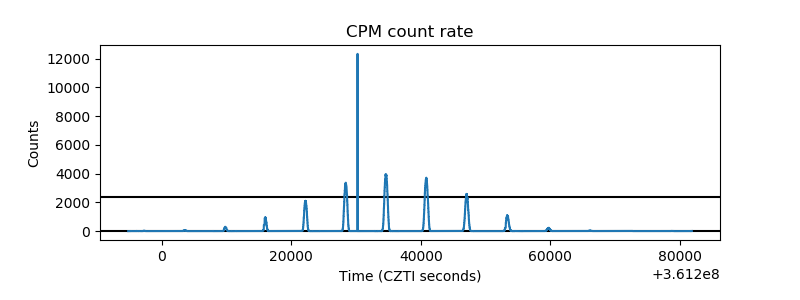 |
| CZT Counter | 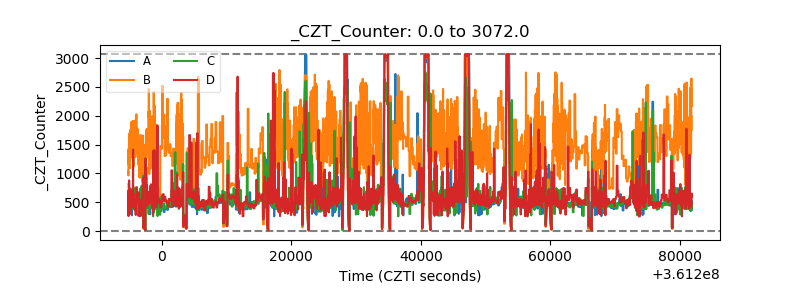 |
| +2.5 Volts monitor | 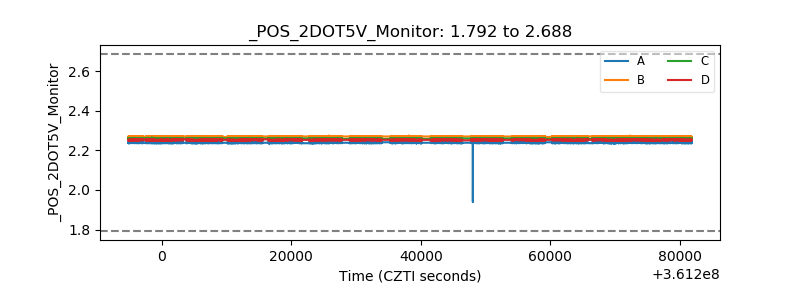 |
| +5 Volts monitor | 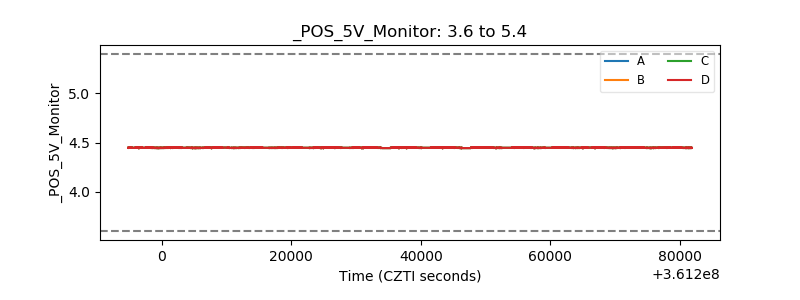 |
| _ROLL_ROT | 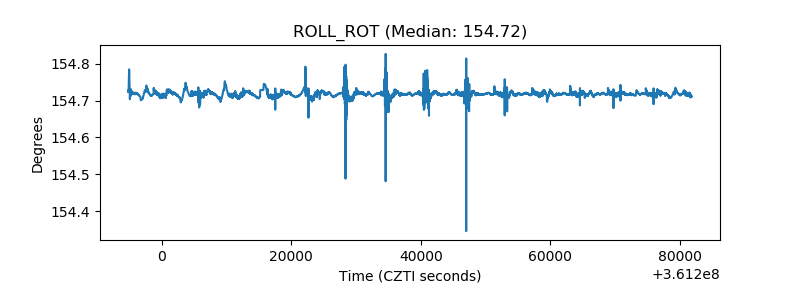 |
| _Roll_DEC | 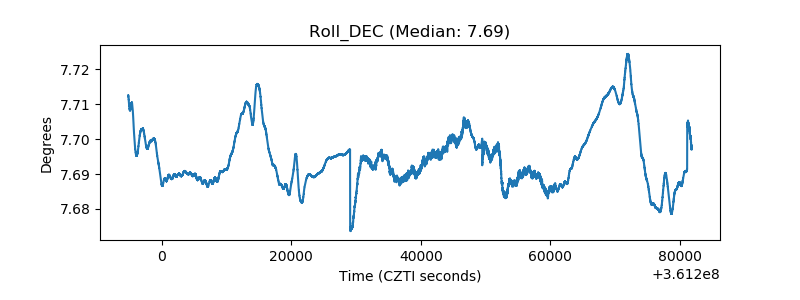 |
| _Roll_RA | 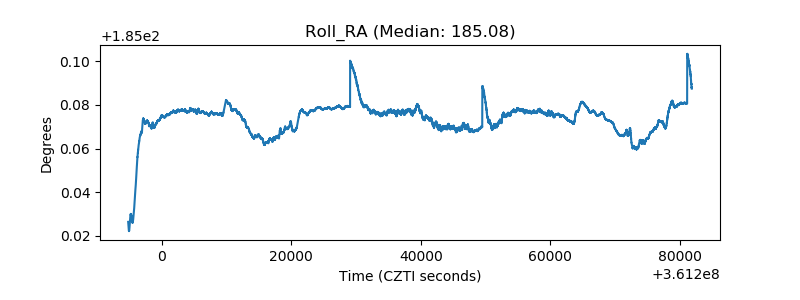 |
| Veto Counter | 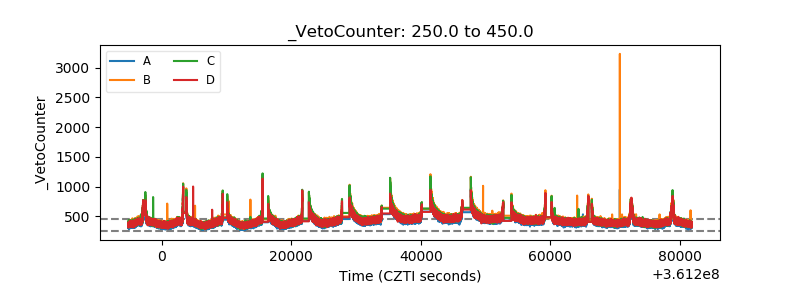 |