| Param | Original file | Final file |
|---|---|---|
| Filename | modeM0/AS1A10_071T46_9000004460_30852cztM0_level2.evt | modeM0/AS1A10_071T46_9000004460_30852cztM0_level2_quad_clean.evt |
| Size (bytes) | 418,495,680 | 42,485,760 |
| Size | 399.1 MB | 40.5 MB |
| Events in quadrant A | 1,994,739 | 262,828 |
| Events in quadrant B | 5,872,739 | 244,890 |
| Events in quadrant C | 2,116,591 | 250,719 |
| Events in quadrant D | 2,421,229 | 248,158 |
| Mode M0 | |||
|---|---|---|---|
| Quadrant | BADHDUFLAG | Total packets | Discarded packets |
| A | 0 | 8294 | 1 |
| B | 0 | 20227 | 1 |
| C | 0 | 8638 | 1 |
| D | 0 | 9669 | 1 |
| Mode SS | |||
|---|---|---|---|
| Quadrant | BADHDUFLAG | Total packets | Discarded packets |
| A | 0 | 80 | 0 |
| B | 0 | 80 | 0 |
| C | 0 | 80 | 0 |
| D | 0 | 80 | 0 |
| Mode M9 | |||
|---|---|---|---|
| Quadrant | BADHDUFLAG | Total packets | Discarded packets |
| A | 0 | 4 | 0 |
| B | 0 | 4 | 0 |
| C | 0 | 4 | 0 |
| D | 0 | 4 | 0 |
| Quadrant | Total seconds | Saturated seconds | Saturation percentage |
|---|---|---|---|
| A | 3960 | 94 | 2.373737% |
| B | 3960 | 1051 | 26.540404% |
| C | 3960 | 164 | 4.141414% |
| D | 3960 | 86 | 2.171717% |
Noise dominated data is calculated using 1-second bins in cleaned event files. If a bin has >2000 counts, and if more than 50% of those come from <1% of pixels, then it is considered to be noise-dominated and hence unusable.
| Quadrant | # 1 sec bins | Bins with >0 counts | Bins with >2000 counts | High rate bins dominated by noise | Noise dominated (total time) | Noise dominated (detector-on time) | Marked lightcurve |
|---|---|---|---|---|---|---|---|
| A | 4290 | 3961 | 0 | 0 | 0.00% | 0.00% | 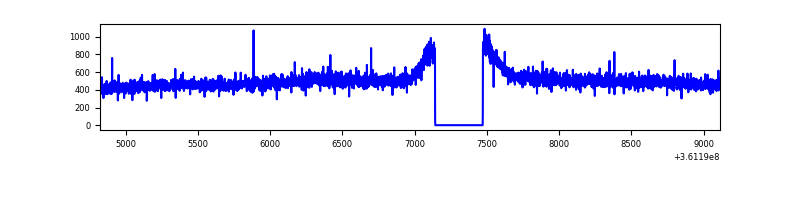 |
| B | 4290 | 3960 | 233 | 233 | 5.43% | 5.88% | 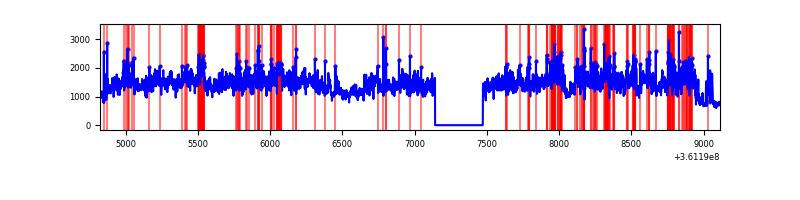 |
| C | 4290 | 3961 | 5 | 5 | 0.12% | 0.13% | 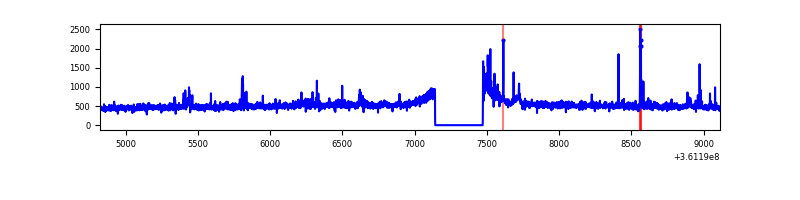 |
| D | 4290 | 3960 | 10 | 10 | 0.23% | 0.25% | 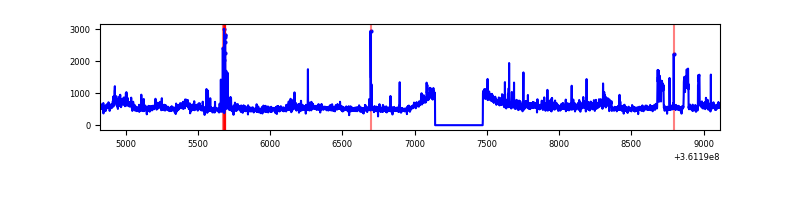 |
Top three noisy pixels from each quadrant. If the there are fewer than three noisy pixels in the level2.evt file, extra rows are filled as -1
| Pixel properties | Quadrant properties | ||||||
|---|---|---|---|---|---|---|---|
| Quadrant | DetID | PixID | Counts | Sigma | Mean | Median | Sigma |
| A | 13 | 254 | 7237 | 62.74 | 517 | 504 | 107.3 |
| A | 3 | 137 | 5479 | 46.36 | 517 | 504 | 107.3 |
| A | 0 | 226 | 4377 | 36.09 | 517 | 504 | 107.3 |
| B | 6 | 36 | 2836639 | 29582.52 | 484 | 472 | 95.9 |
| B | 6 | 159 | 1089074 | 11354.62 | 484 | 472 | 95.9 |
| B | 0 | 230 | 24011 | 245.52 | 484 | 472 | 95.9 |
| C | 0 | 10 | 86870 | 733.84 | 489 | 491 | 117.7 |
| C | 14 | 238 | 77626 | 655.31 | 489 | 491 | 117.7 |
| C | 3 | 233 | 25320 | 210.94 | 489 | 491 | 117.7 |
| D | 8 | 195 | 457161 | 3838.63 | 497 | 484 | 119.0 |
| D | 2 | 250 | 45268 | 376.43 | 497 | 484 | 119.0 |
| D | 2 | 234 | 15221 | 123.87 | 497 | 484 | 119.0 |
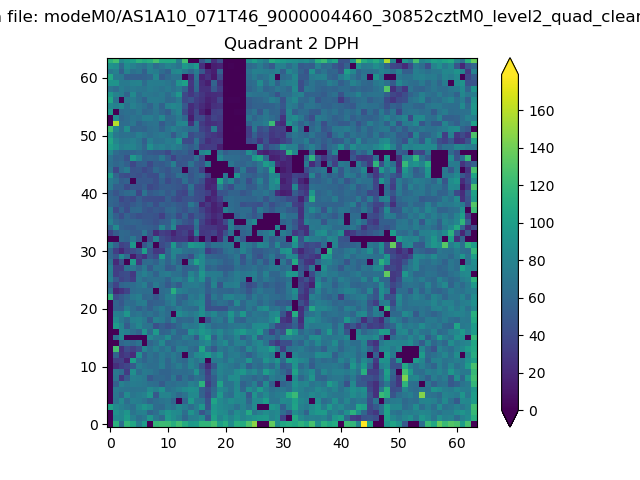
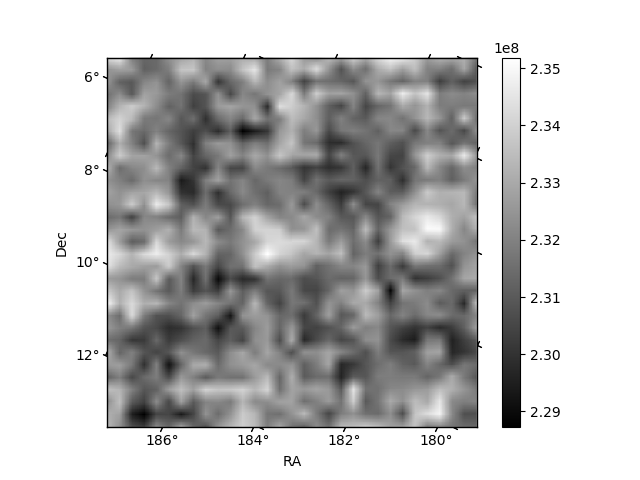
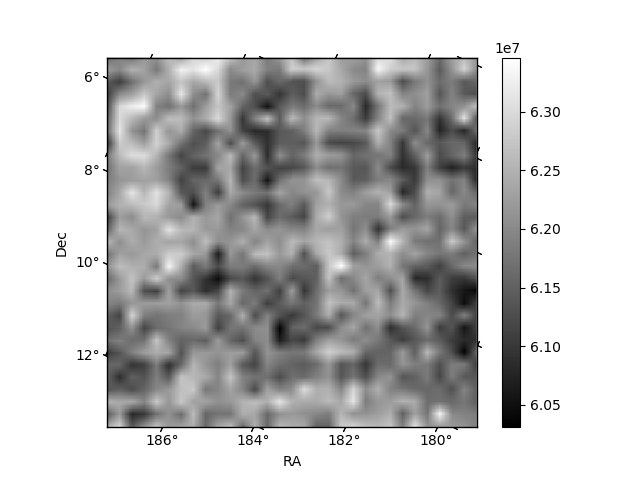
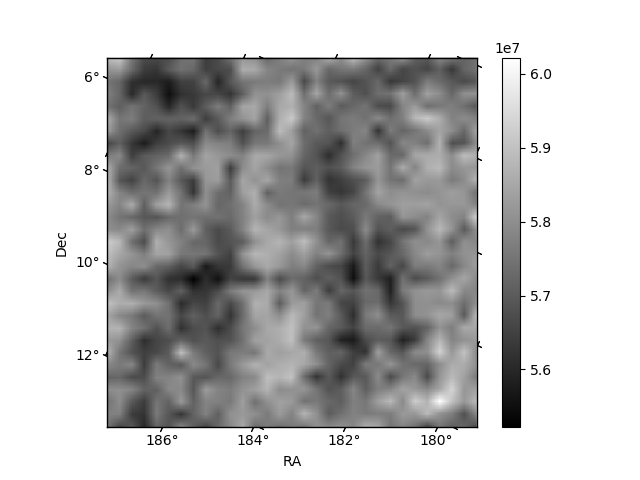
Histogram calculated using DETX and DETY for each event in the final _common_clean file
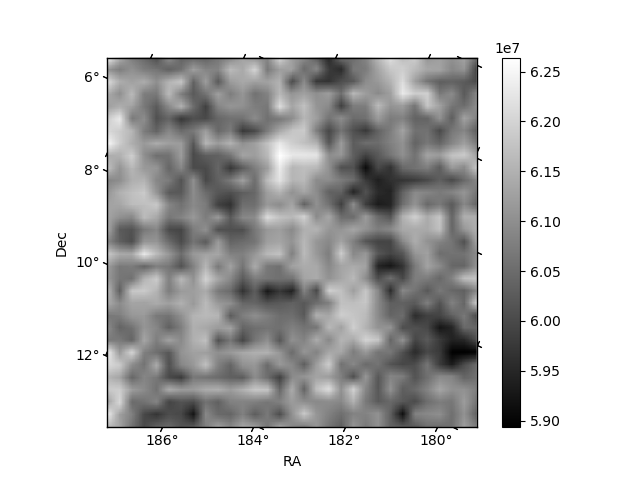
| Quadrant A | 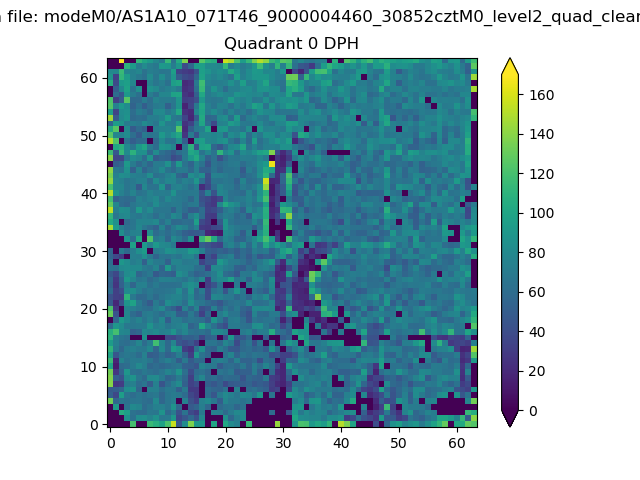 |
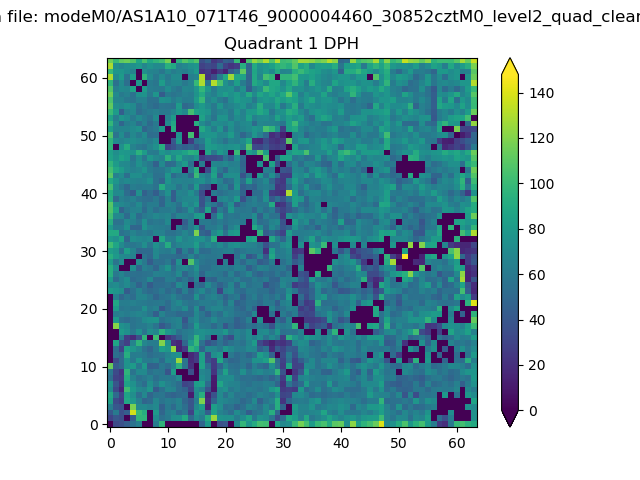 |
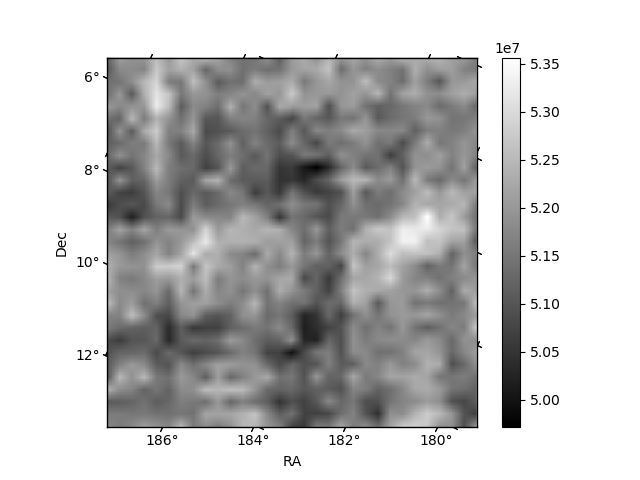
Quadrant B |
|---|---|---|---|
| Quadrant D | 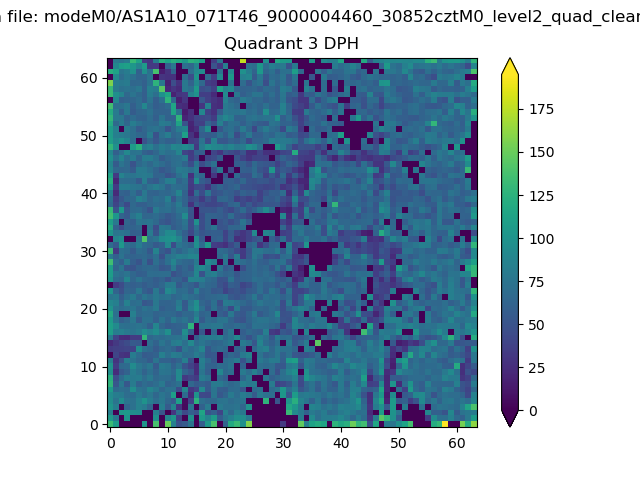 |
 |
Quadrant C |
| Plot type | Count rate plots | Images |
|---|---|---|
| Comparison with Poisson distribution Blue bars denote a histogram of data divided into 1 sec bins. Red curve is a Poisson curve with rate = median count rate of data. |
 |
 |
| Quadrant-wise count rates Data is divided into 100 sec bins |
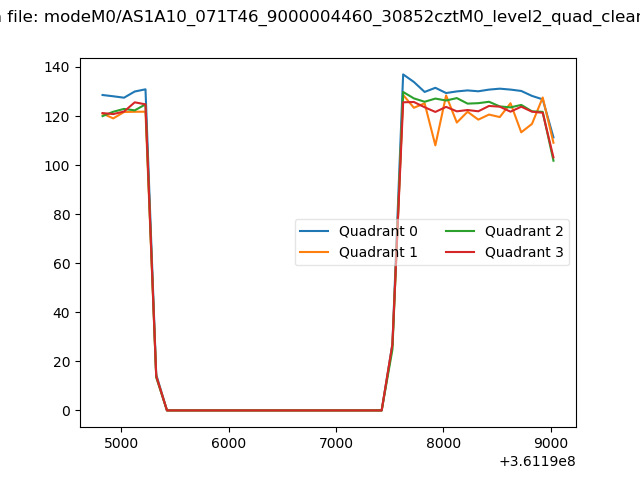 |
|
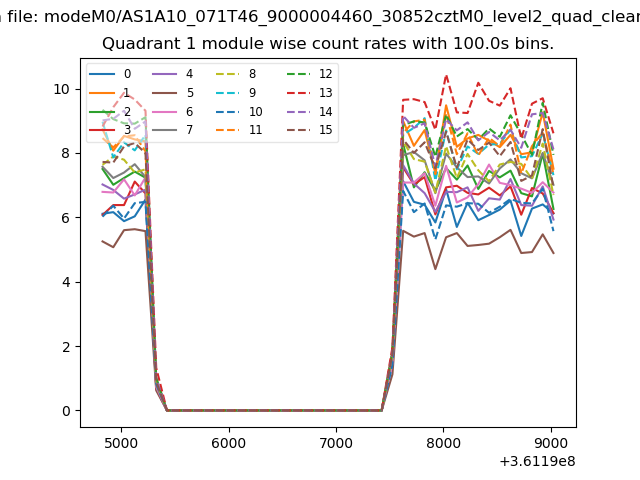
| Module-wise count rates for Quadrant A Data is divided into 100 sec bins |
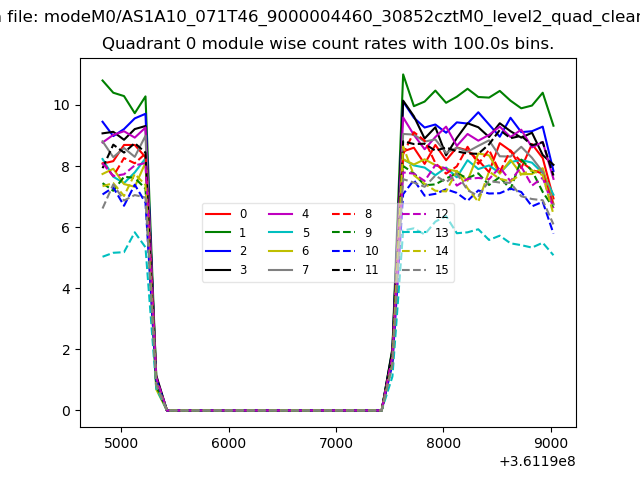 |
 |
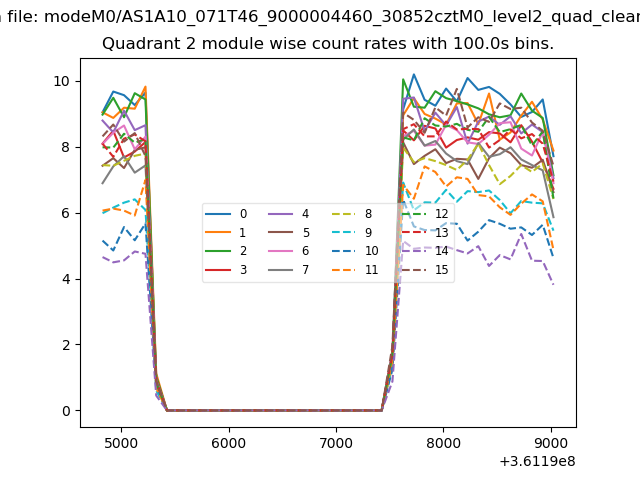
| Module-wise count rates for Quadrant B Data is divided into 100 sec bins |
 |
 |
| Module-wise count rates for Quadrant C Data is divided into 100 sec bins |
 |
 |
| Module-wise count rates for Quadrant D Data is divided into 100 sec bins |
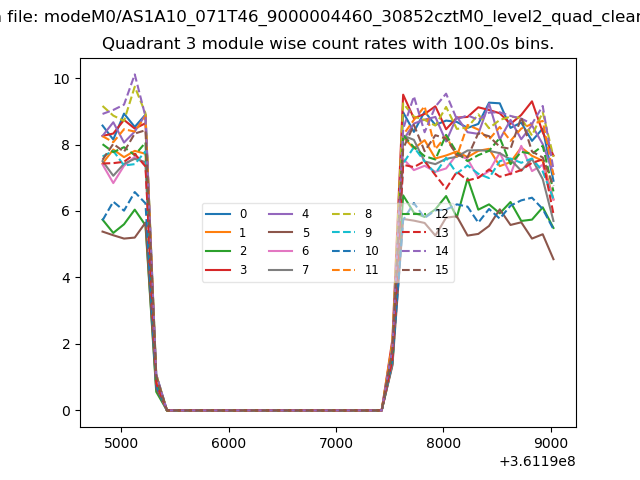 |
 |
| Parameter | Plot |
|---|---|
| CZT HV Monitor | 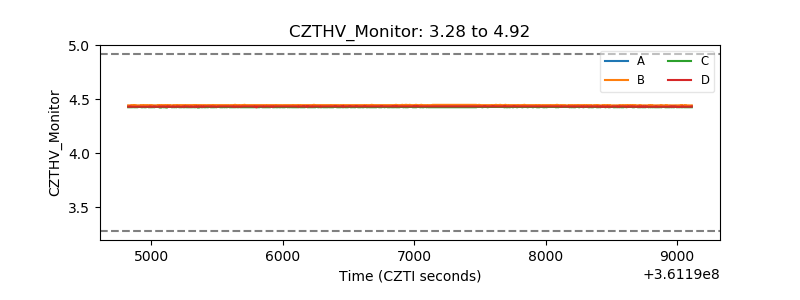 |
| D_VDD | 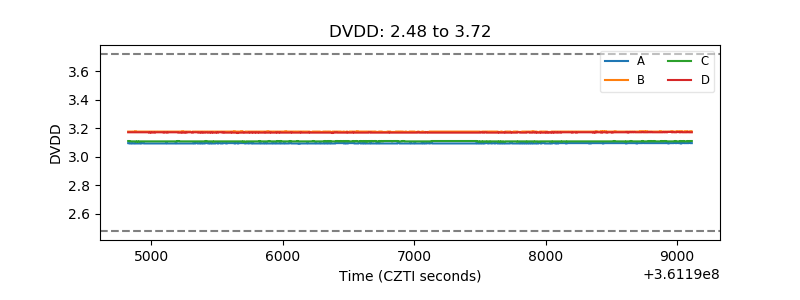 |
| Temperature 1 | 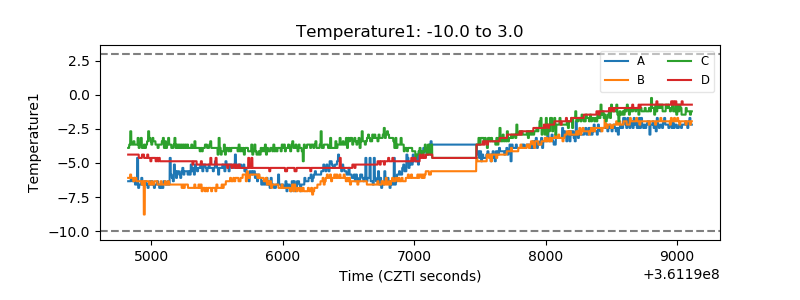 |
| Veto HV Monitor | 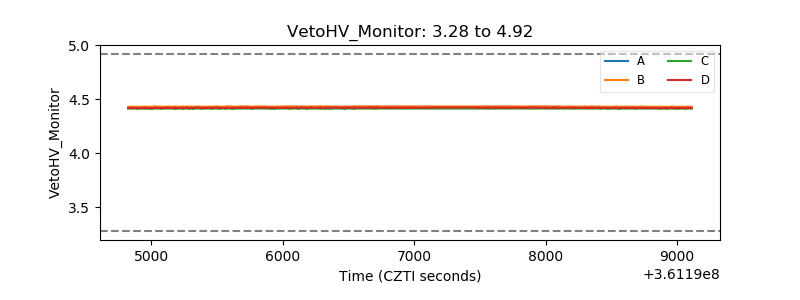 |
| Veto LLD | 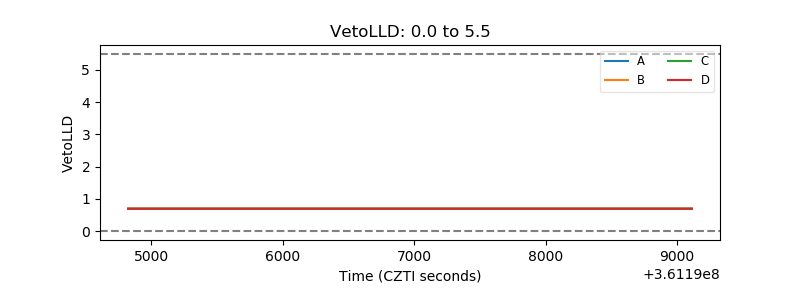 |
| Alpha Counter | 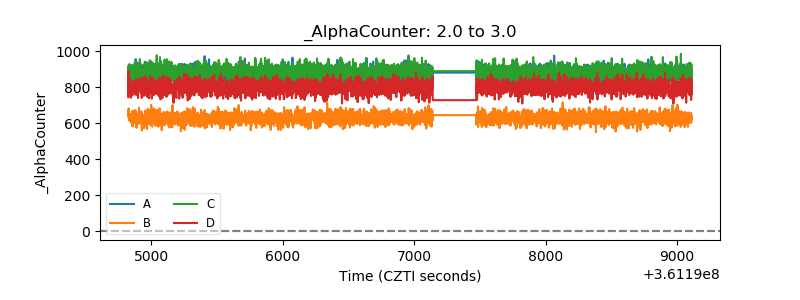 |
| _CPM_Rate | 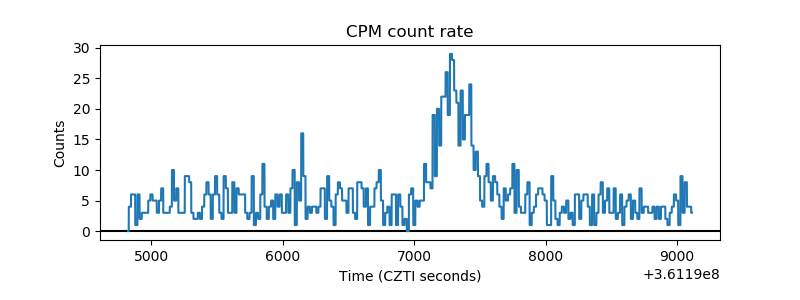 |
| CZT Counter | 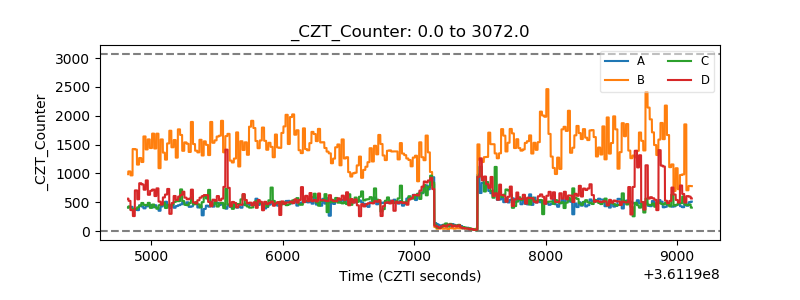 |
| +2.5 Volts monitor | 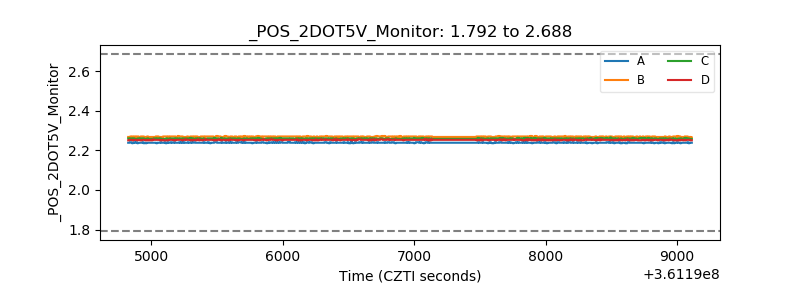 |
| +5 Volts monitor |  |
| _ROLL_ROT | 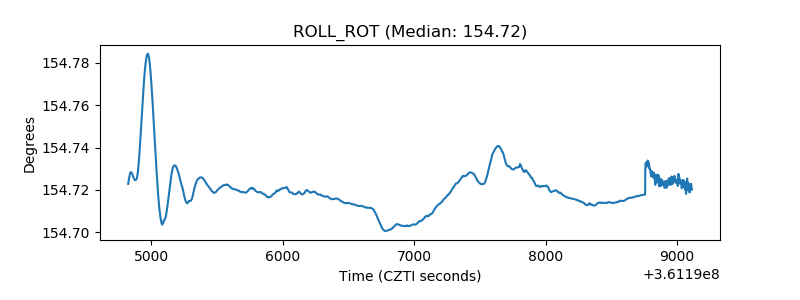 |
| _Roll_DEC | 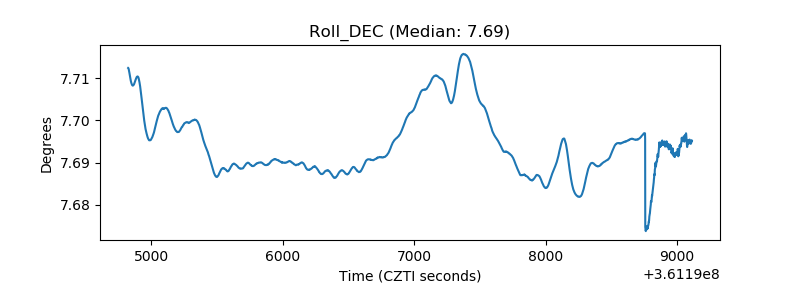 |
| _Roll_RA | 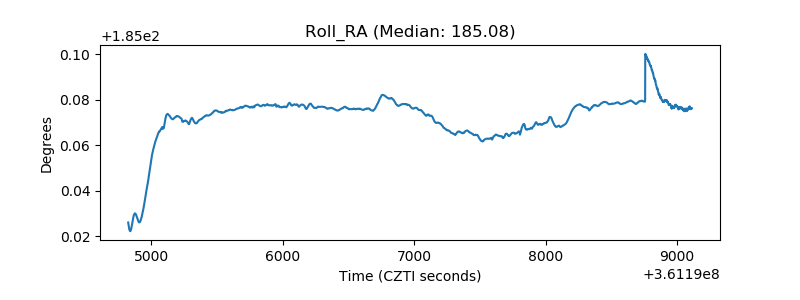 |
| Veto Counter | 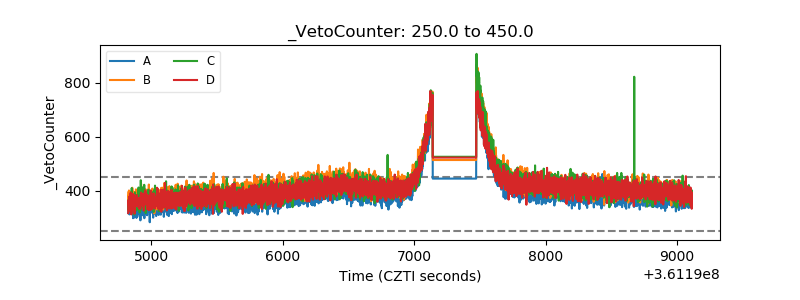 |