| Param | Original file | Final file |
|---|---|---|
| Filename | modeM0/AS1A10_071T46_9000004460_30855cztM0_level2.evt | modeM0/AS1A10_071T46_9000004460_30855cztM0_level2_quad_clean.evt |
| Size (bytes) | 1,269,774,720 | 163,091,520 |
| Size | 1.2 GB | 155.5 MB |
| Events in quadrant A | 6,253,259 | 1,054,908 |
| Events in quadrant B | 16,484,233 | 994,192 |
| Events in quadrant C | 6,955,743 | 1,001,040 |
| Events in quadrant D | 7,883,890 | 987,523 |
| Mode M0 | |||
|---|---|---|---|
| Quadrant | BADHDUFLAG | Total packets | Discarded packets |
| A | 0 | 27059 | 3 |
| B | 0 | 58055 | 3 |
| C | 0 | 29115 | 3 |
| D | 0 | 31800 | 3 |
| Mode SS | |||
|---|---|---|---|
| Quadrant | BADHDUFLAG | Total packets | Discarded packets |
| A | 0 | 268 | 0 |
| B | 0 | 268 | 0 |
| C | 0 | 268 | 0 |
| D | 0 | 268 | 0 |
| Mode M9 | |||
|---|---|---|---|
| Quadrant | BADHDUFLAG | Total packets | Discarded packets |
| A | 0 | 20 | 0 |
| B | 0 | 20 | 0 |
| C | 0 | 20 | 0 |
| D | 0 | 20 | 0 |
| Quadrant | Total seconds | Saturated seconds | Saturation percentage |
|---|---|---|---|
| A | 13035 | 195 | 1.495972% |
| B | 13035 | 2067 | 15.857307% |
| C | 13035 | 403 | 3.091676% |
| D | 13035 | 391 | 2.999616% |
Noise dominated data is calculated using 1-second bins in cleaned event files. If a bin has >2000 counts, and if more than 50% of those come from <1% of pixels, then it is considered to be noise-dominated and hence unusable.
| Quadrant | # 1 sec bins | Bins with >0 counts | Bins with >2000 counts | High rate bins dominated by noise | Noise dominated (total time) | Noise dominated (detector-on time) | Marked lightcurve |
|---|---|---|---|---|---|---|---|
| A | 15075 | 13035 | 0 | 0 | 0.00% | 0.00% | 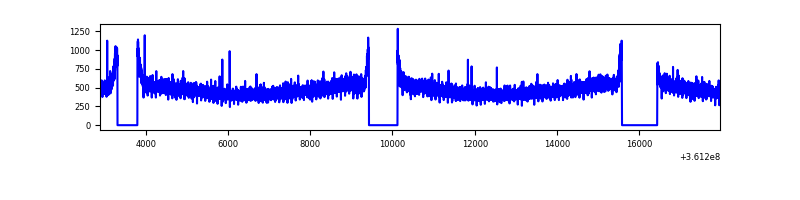 |
| B | 15075 | 13035 | 592 | 592 | 3.93% | 4.54% | 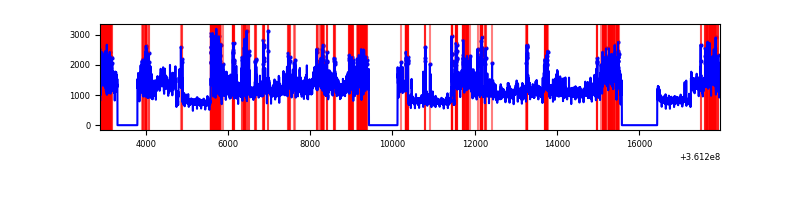 |
| C | 15075 | 13035 | 38 | 38 | 0.25% | 0.29% | 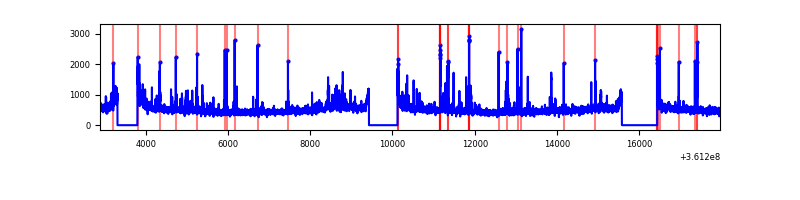 |
| D | 15075 | 13035 | 238 | 238 | 1.58% | 1.83% | 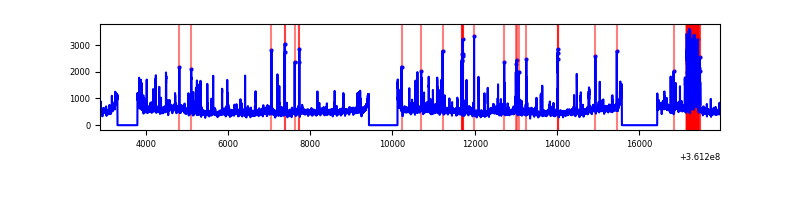 |
Top three noisy pixels from each quadrant. If the there are fewer than three noisy pixels in the level2.evt file, extra rows are filled as -1
| Pixel properties | Quadrant properties | ||||||
|---|---|---|---|---|---|---|---|
| Quadrant | DetID | PixID | Counts | Sigma | Mean | Median | Sigma |
| A | 13 | 254 | 24330 | 69.94 | 1618 | 1582 | 325.3 |
| A | 3 | 137 | 16895 | 47.08 | 1618 | 1582 | 325.3 |
| A | 0 | 226 | 13525 | 36.72 | 1618 | 1582 | 325.3 |
| B | 6 | 36 | 6524514 | 21960.0 | 1540 | 1497 | 297.0 |
| B | 6 | 159 | 3622774 | 12191.18 | 1540 | 1497 | 297.0 |
| B | 5 | 172 | 53633 | 175.52 | 1540 | 1497 | 297.0 |
| C | 2 | 16 | 332059 | 906.76 | 1540 | 1548 | 364.5 |
| C | 0 | 10 | 286992 | 783.12 | 1540 | 1548 | 364.5 |
| C | 14 | 238 | 245420 | 669.07 | 1540 | 1548 | 364.5 |
| D | 8 | 195 | 1118993 | 3034.14 | 1550 | 1513 | 368.3 |
| D | 1 | 52 | 600605 | 1626.63 | 1550 | 1513 | 368.3 |
| D | 2 | 250 | 79009 | 210.41 | 1550 | 1513 | 368.3 |
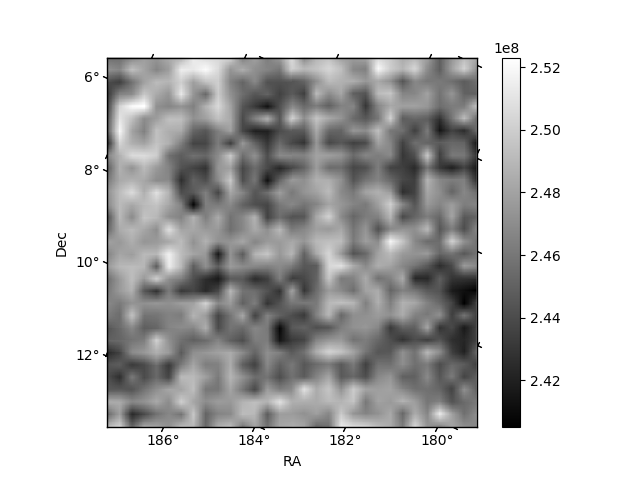
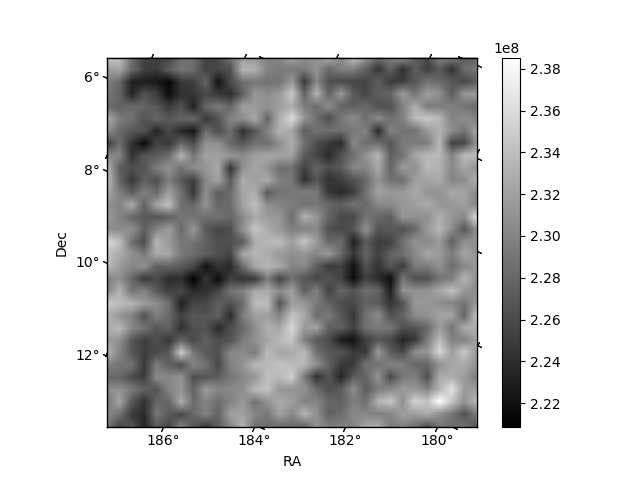
Histogram calculated using DETX and DETY for each event in the final _common_clean file
| Quadrant A | 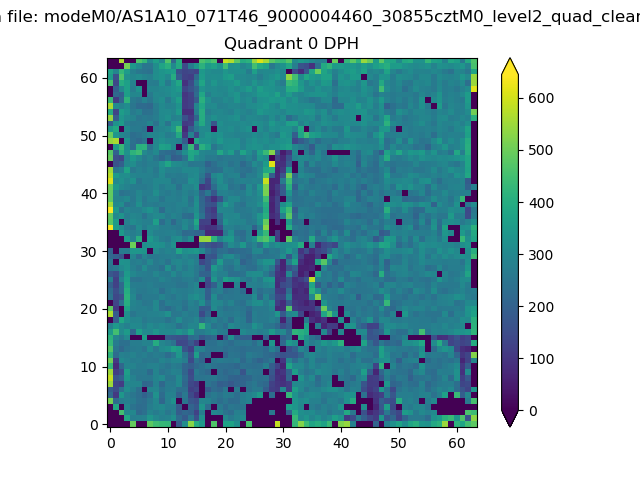 |
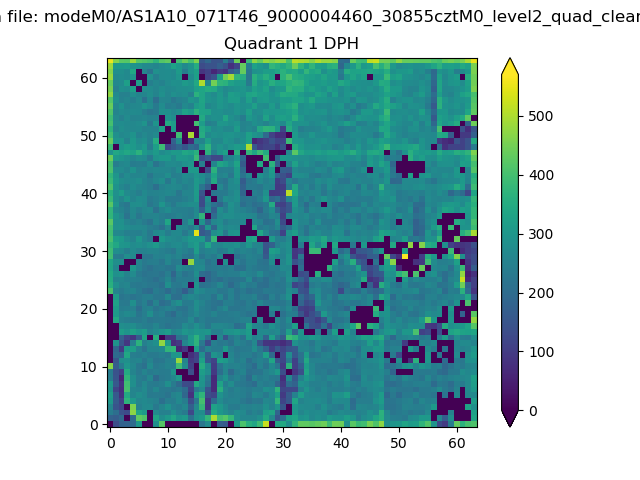 |
Quadrant B |
|---|---|---|---|
| Quadrant D | 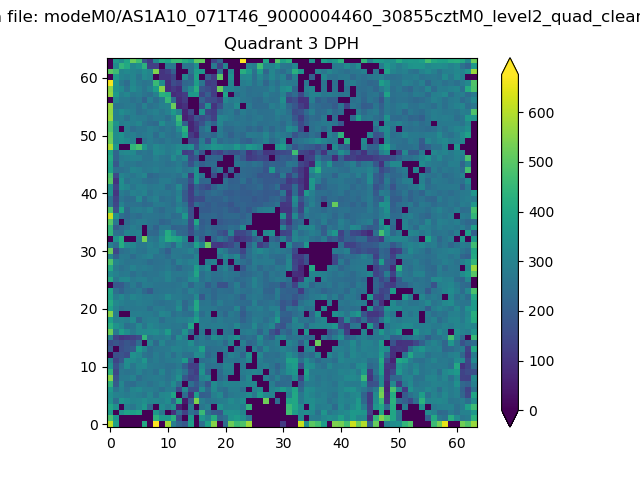 |
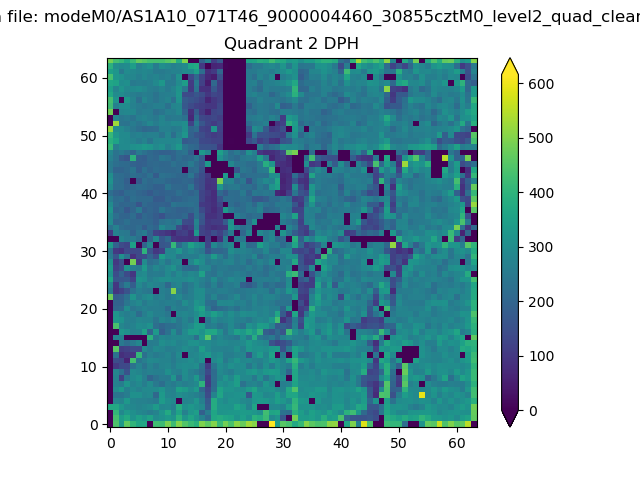 |
Quadrant C |
| Plot type | Count rate plots | Images |
|---|---|---|
| Comparison with Poisson distribution Blue bars denote a histogram of data divided into 1 sec bins. Red curve is a Poisson curve with rate = median count rate of data. |
 |
 |
| Quadrant-wise count rates Data is divided into 100 sec bins |
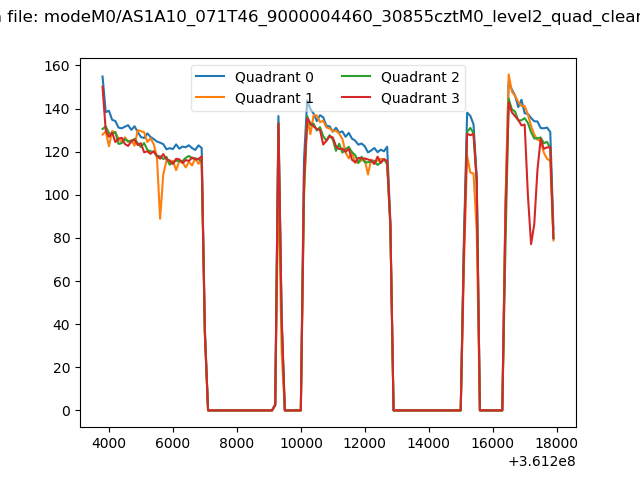 |
|
| Module-wise count rates for Quadrant A Data is divided into 100 sec bins |
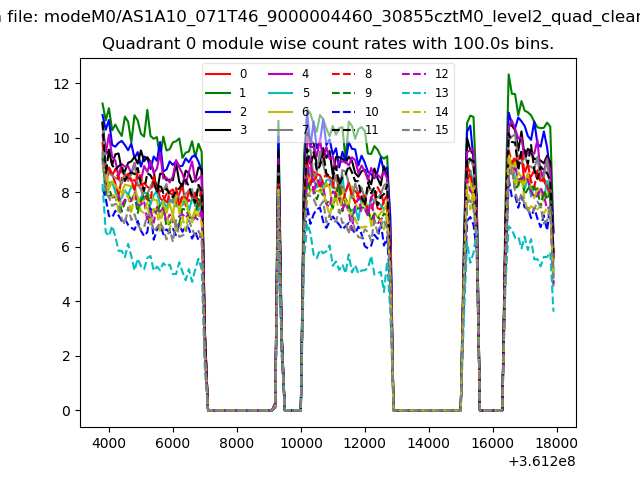 |
 |
| Module-wise count rates for Quadrant B Data is divided into 100 sec bins |
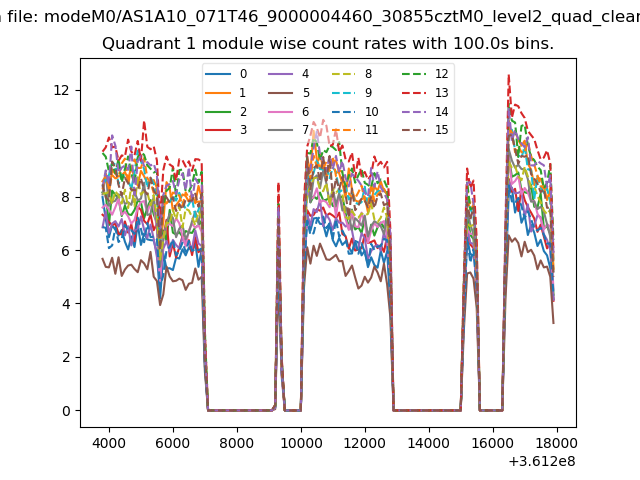 |
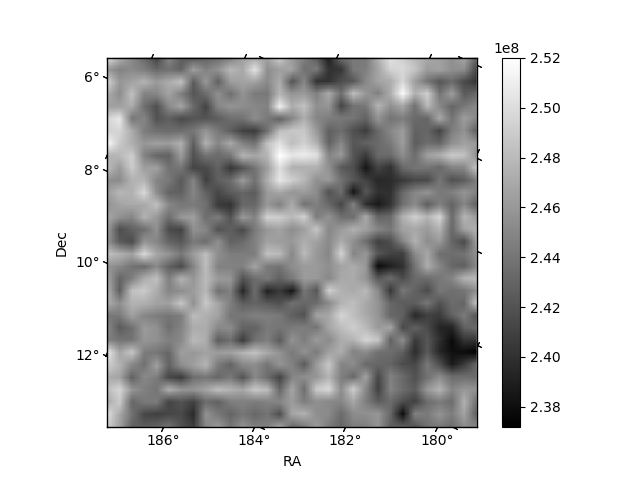 |
| Module-wise count rates for Quadrant C Data is divided into 100 sec bins |
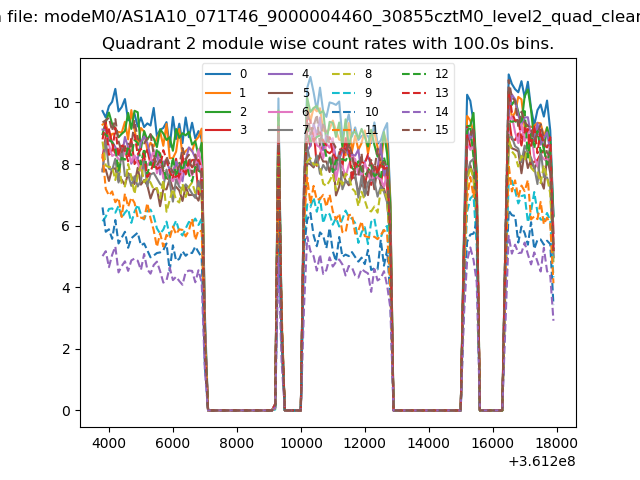 |
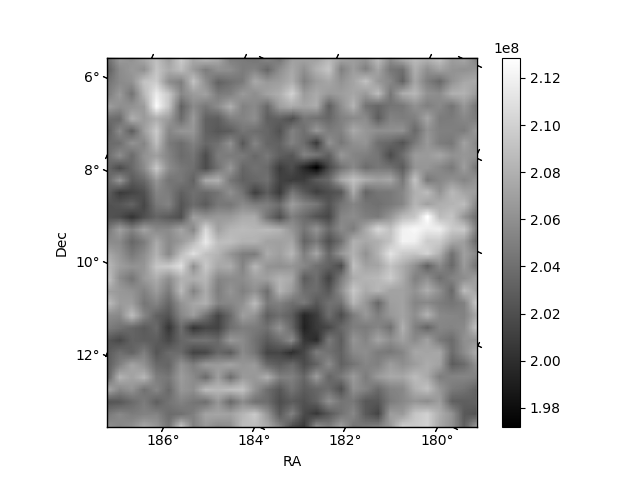 |
| Module-wise count rates for Quadrant D Data is divided into 100 sec bins |
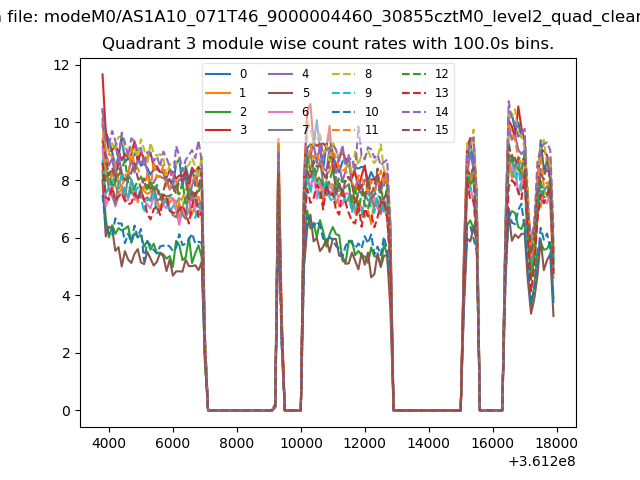 |
 |
| Parameter | Plot |
|---|---|
| CZT HV Monitor | 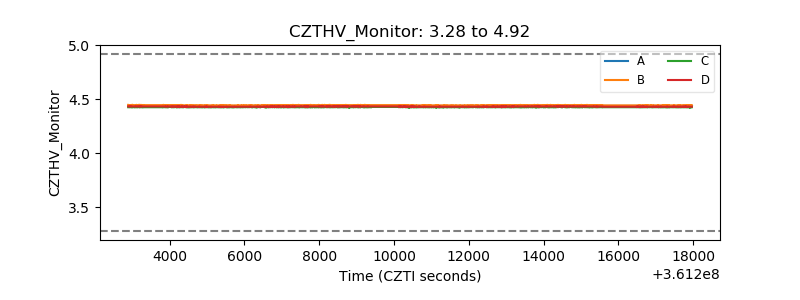 |
| D_VDD | 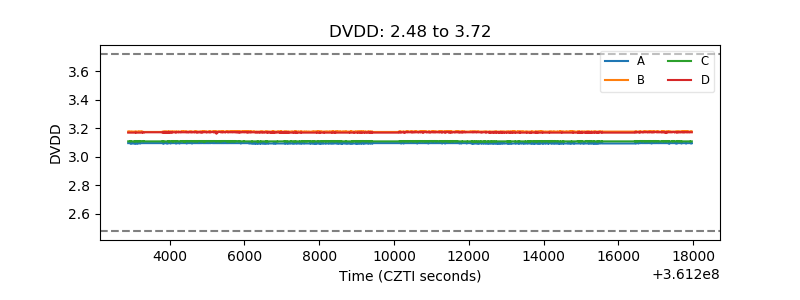 |
| Temperature 1 | 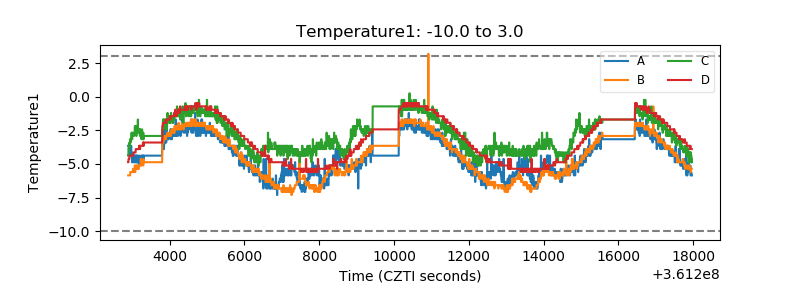 |
| Veto HV Monitor |  |
| Veto LLD | 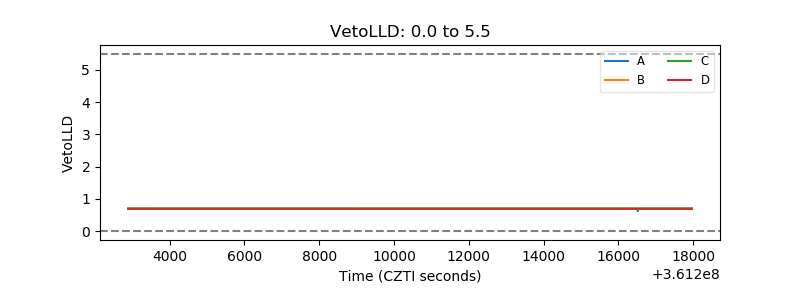 |
| Alpha Counter | 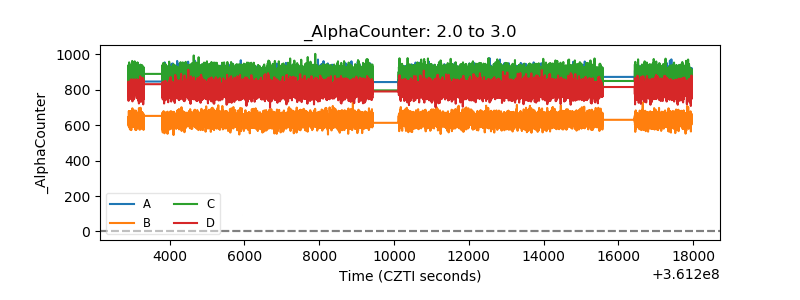 |
| _CPM_Rate | 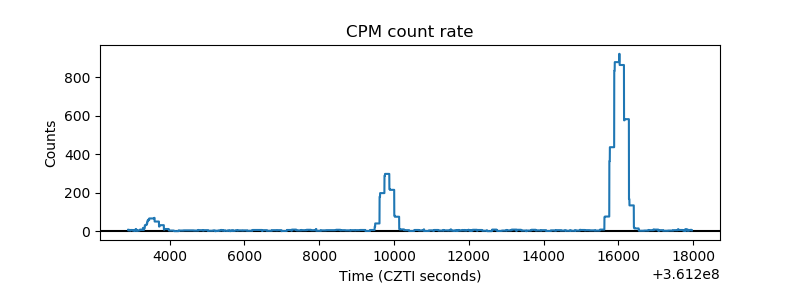 |
| CZT Counter | 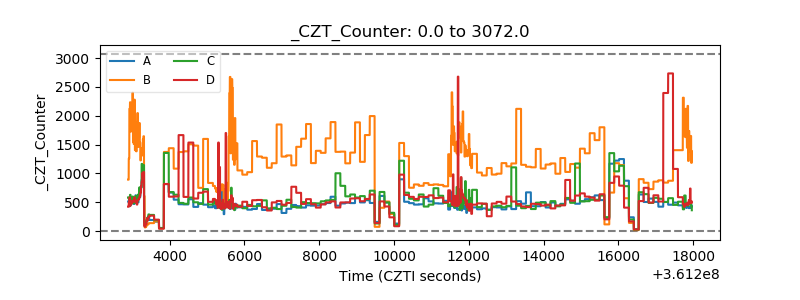 |
| +2.5 Volts monitor |  |
| +5 Volts monitor |  |
| _ROLL_ROT |  |
| _Roll_DEC |  |
| _Roll_RA | 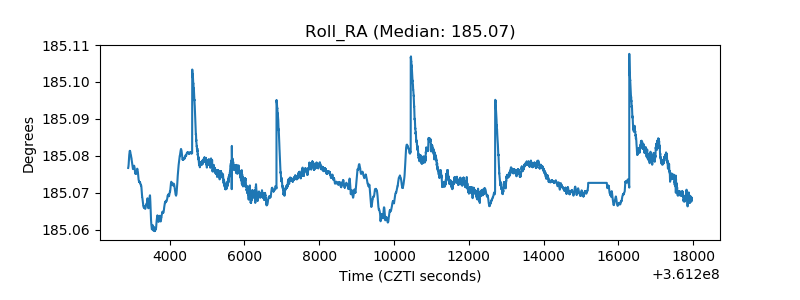 |
| Veto Counter | 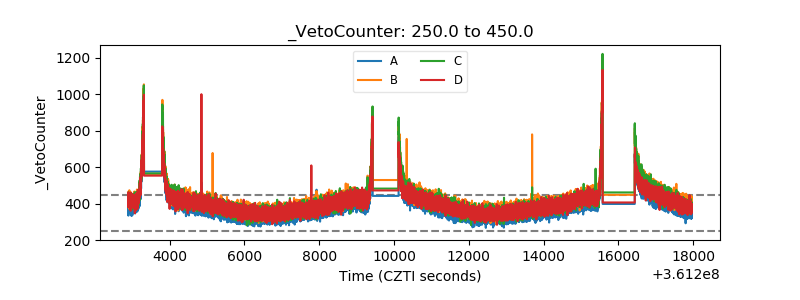 |