| Param | Original file | Final file |
|---|---|---|
| Filename | modeM0/AS1A10_071T46_9000004460_30856cztM0_level2.evt | modeM0/AS1A10_071T46_9000004460_30856cztM0_level2_quad_clean.evt |
| Size (bytes) | 723,142,080 | 90,849,600 |
| Size | 689.6 MB | 86.6 MB |
| Events in quadrant A | 3,181,222 | 609,608 |
| Events in quadrant B | 10,331,155 | 544,610 |
| Events in quadrant C | 3,631,125 | 574,498 |
| Events in quadrant D | 4,307,572 | 557,799 |
| Mode M0 | |||
|---|---|---|---|
| Quadrant | BADHDUFLAG | Total packets | Discarded packets |
| A | 0 | 13706 | 1 |
| B | 0 | 35221 | 1 |
| C | 0 | 15069 | 1 |
| D | 0 | 17310 | 1 |
| Mode SS | |||
|---|---|---|---|
| Quadrant | BADHDUFLAG | Total packets | Discarded packets |
| A | 0 | 136 | 0 |
| B | 0 | 136 | 0 |
| C | 0 | 136 | 0 |
| D | 0 | 136 | 0 |
| Mode M9 | |||
|---|---|---|---|
| Quadrant | BADHDUFLAG | Total packets | Discarded packets |
| A | 0 | 10 | 0 |
| B | 0 | 10 | 0 |
| C | 0 | 10 | 0 |
| D | 0 | 10 | 0 |
| Quadrant | Total seconds | Saturated seconds | Saturation percentage |
|---|---|---|---|
| A | 6649 | 33 | 0.496315% |
| B | 6649 | 1965 | 29.553316% |
| C | 6649 | 182 | 2.737254% |
| D | 6650 | 255 | 3.834586% |
Noise dominated data is calculated using 1-second bins in cleaned event files. If a bin has >2000 counts, and if more than 50% of those come from <1% of pixels, then it is considered to be noise-dominated and hence unusable.
| Quadrant | # 1 sec bins | Bins with >0 counts | Bins with >2000 counts | High rate bins dominated by noise | Noise dominated (total time) | Noise dominated (detector-on time) | Marked lightcurve |
|---|---|---|---|---|---|---|---|
| A | 7674 | 6649 | 0 | 0 | 0.00% | 0.00% | 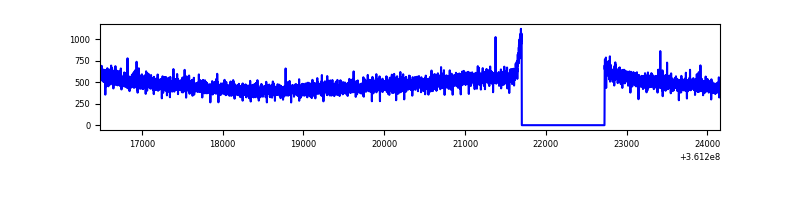 |
| B | 7674 | 6649 | 1270 | 1270 | 16.55% | 19.10% | 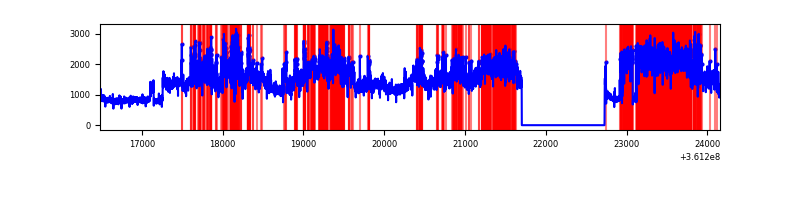 |
| C | 7674 | 6649 | 47 | 47 | 0.61% | 0.71% | 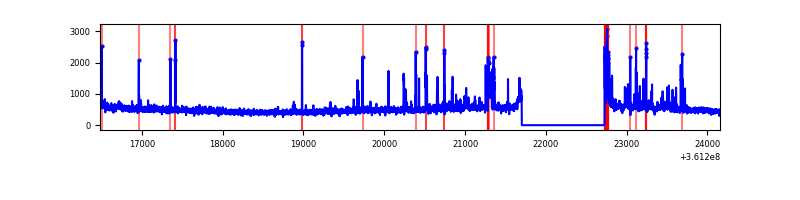 |
| D | 7675 | 6651 | 225 | 225 | 2.93% | 3.38% | 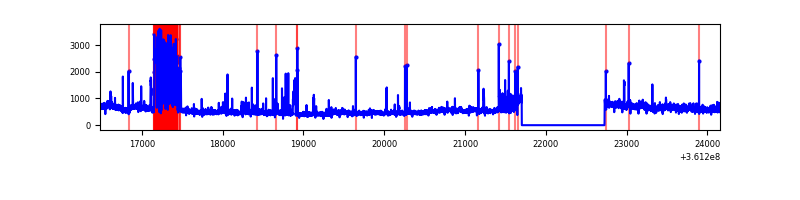 |
Top three noisy pixels from each quadrant. If the there are fewer than three noisy pixels in the level2.evt file, extra rows are filled as -1
| Pixel properties | Quadrant properties | ||||||
|---|---|---|---|---|---|---|---|
| Quadrant | DetID | PixID | Counts | Sigma | Mean | Median | Sigma |
| A | 13 | 254 | 12797 | 71.83 | 824 | 808 | 166.9 |
| A | 3 | 137 | 8269 | 44.7 | 824 | 808 | 166.9 |
| A | 0 | 226 | 7024 | 37.24 | 824 | 808 | 166.9 |
| B | 6 | 36 | 5352912 | 36316.41 | 766 | 747 | 147.4 |
| B | 6 | 159 | 1827294 | 12393.79 | 766 | 747 | 147.4 |
| B | 0 | 229 | 27090 | 178.75 | 766 | 747 | 147.4 |
| C | 0 | 10 | 222629 | 1198.78 | 783 | 788 | 185.1 |
| C | 2 | 16 | 181718 | 977.71 | 783 | 788 | 185.1 |
| C | 14 | 238 | 125580 | 674.35 | 783 | 788 | 185.1 |
| D | 8 | 195 | 609712 | 3305.79 | 778 | 761 | 184.2 |
| D | 1 | 52 | 575451 | 3119.79 | 778 | 761 | 184.2 |
| D | 2 | 250 | 91154 | 490.71 | 778 | 761 | 184.2 |
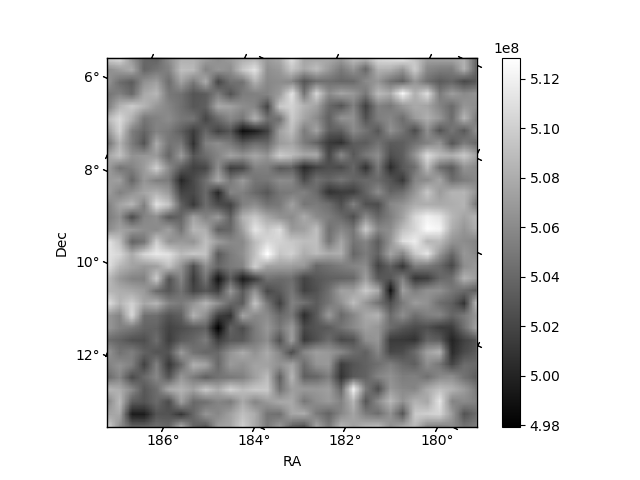
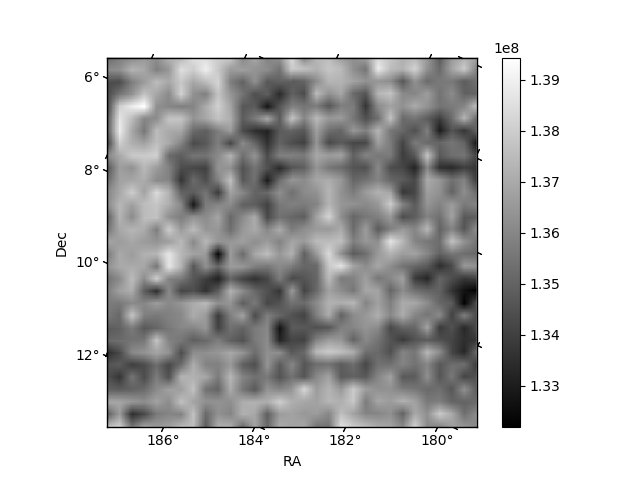
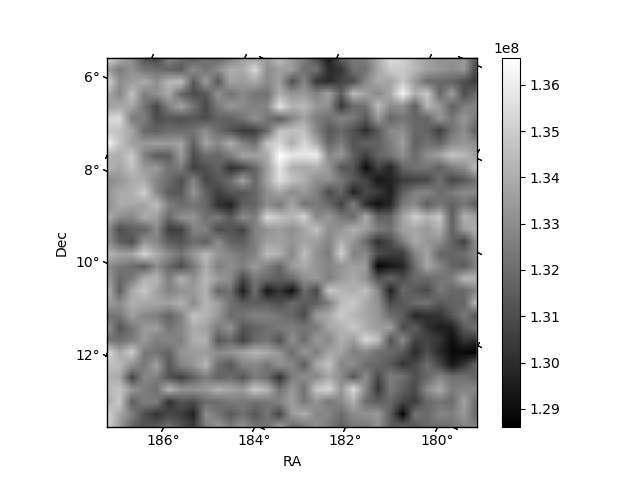
Histogram calculated using DETX and DETY for each event in the final _common_clean file
| Quadrant A | 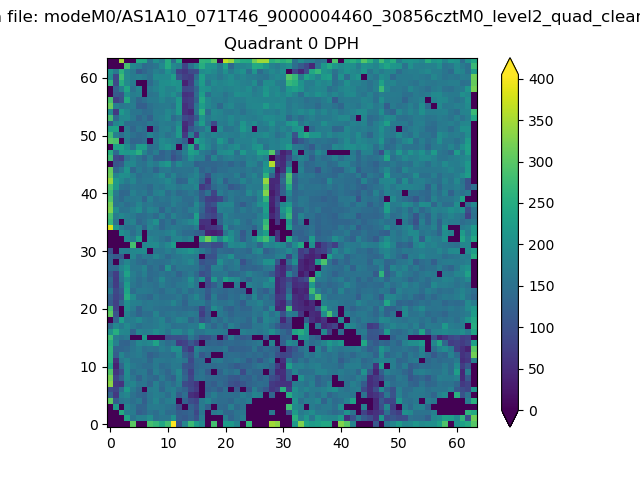 |
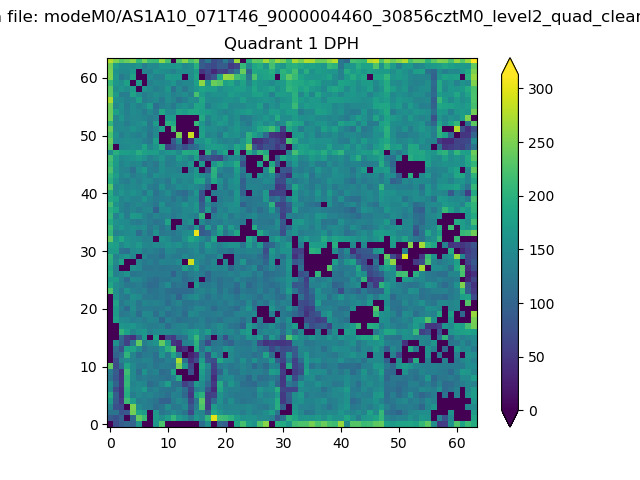 |
Quadrant B |
|---|---|---|---|
| Quadrant D | 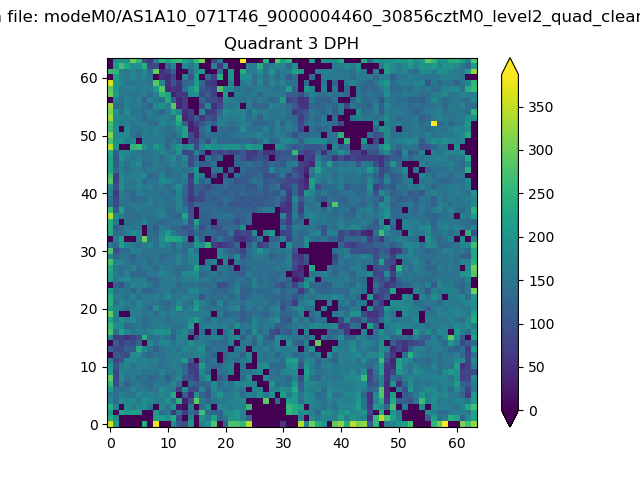 |
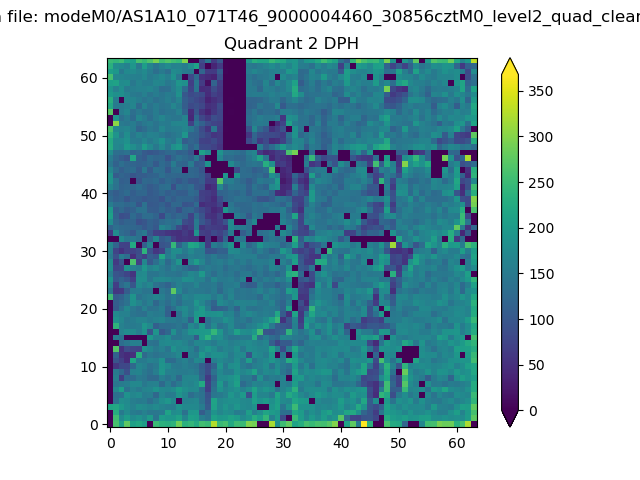 |
Quadrant C |
| Plot type | Count rate plots | Images |
|---|---|---|
| Comparison with Poisson distribution Blue bars denote a histogram of data divided into 1 sec bins. Red curve is a Poisson curve with rate = median count rate of data. |
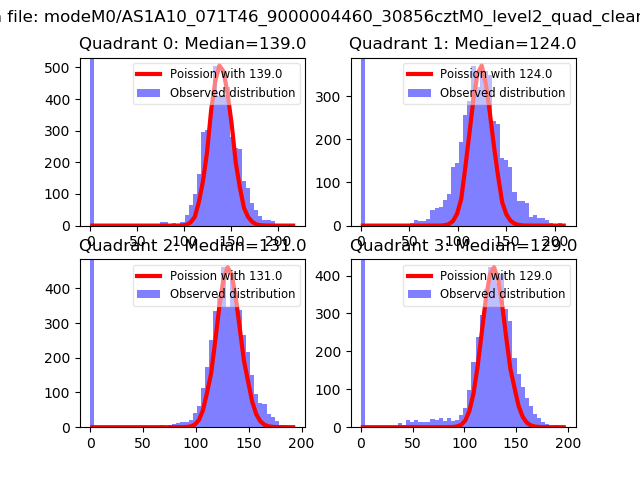 |
 |
| Quadrant-wise count rates Data is divided into 100 sec bins |
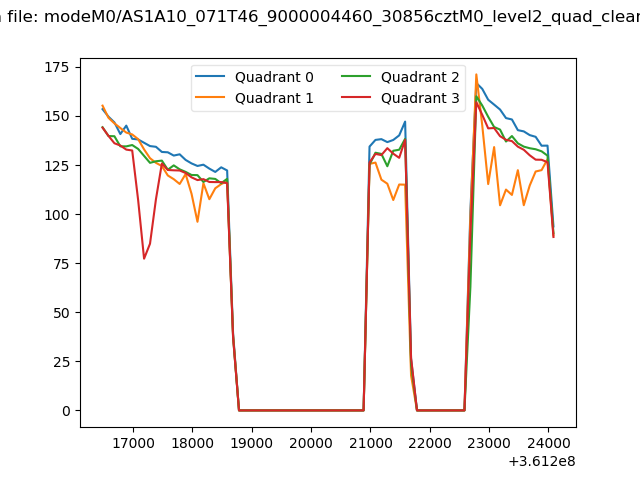 |
|
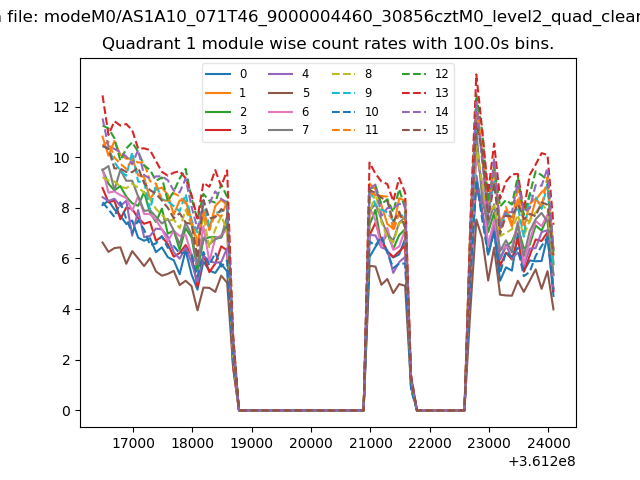
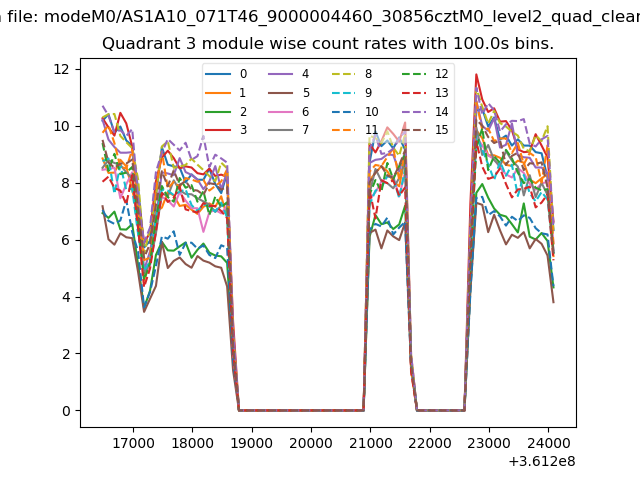
| Module-wise count rates for Quadrant A Data is divided into 100 sec bins |
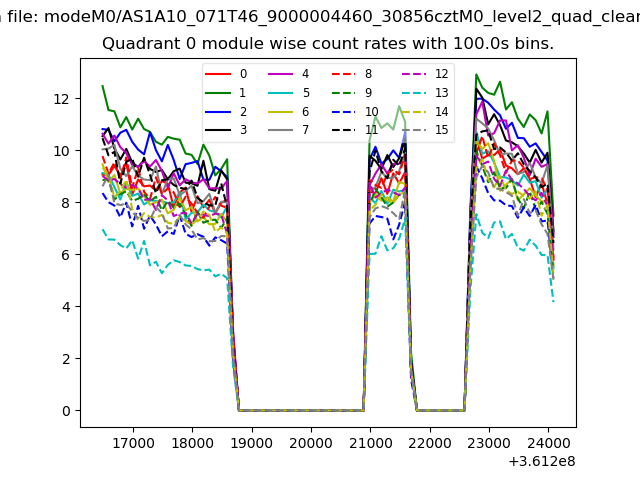 |
 |
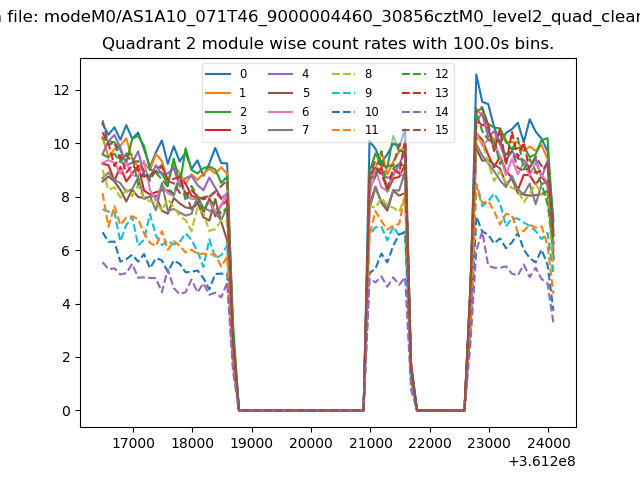
| Module-wise count rates for Quadrant B Data is divided into 100 sec bins |
 |
 |
| Module-wise count rates for Quadrant C Data is divided into 100 sec bins |
 |
 |
| Module-wise count rates for Quadrant D Data is divided into 100 sec bins |
 |
 |
| Parameter | Plot |
|---|---|
| CZT HV Monitor |  |
| D_VDD | 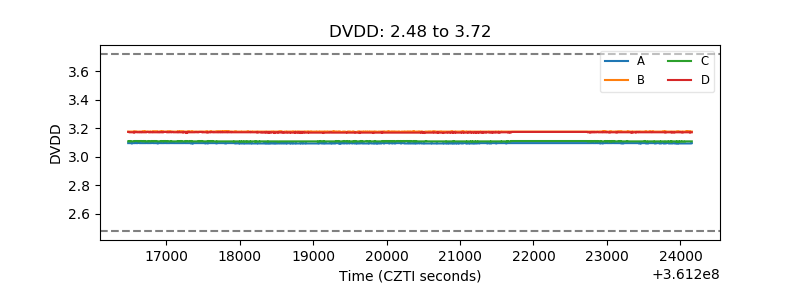 |
| Temperature 1 | 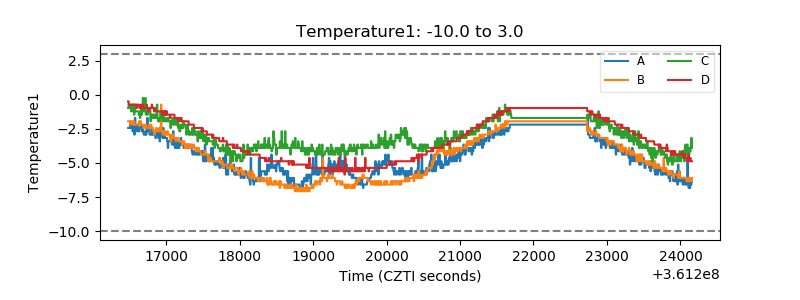 |
| Veto HV Monitor | 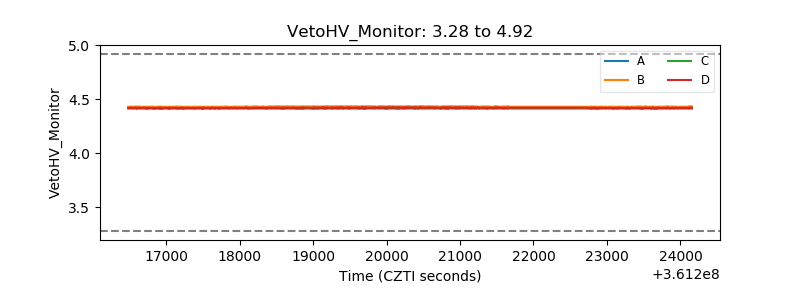 |
| Veto LLD | 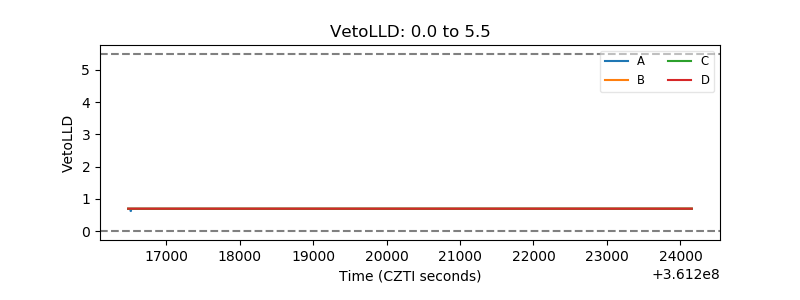 |
| Alpha Counter | 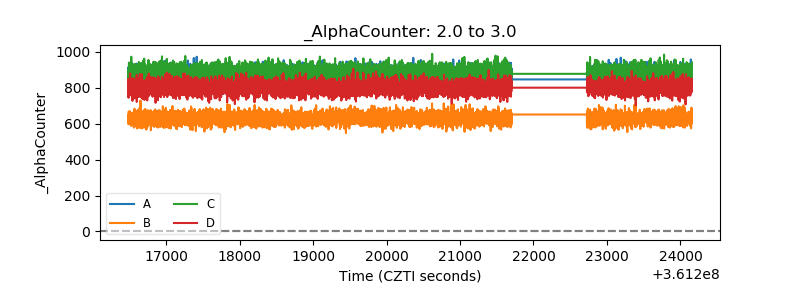 |
| _CPM_Rate | 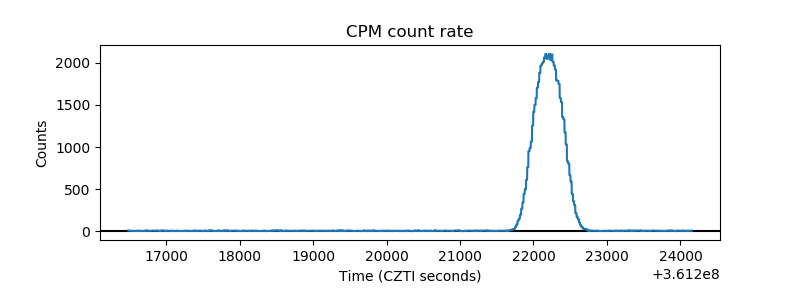 |
| CZT Counter | 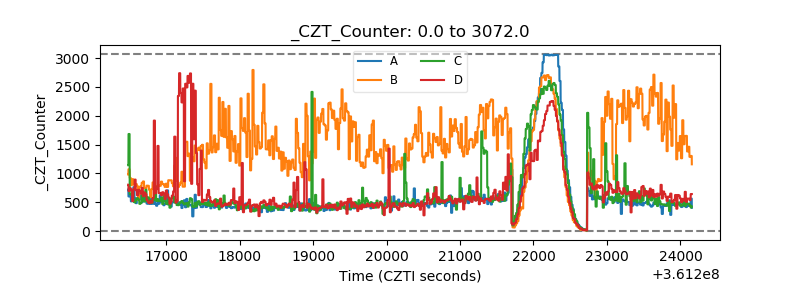 |
| +2.5 Volts monitor |  |
| +5 Volts monitor |  |
| _ROLL_ROT | 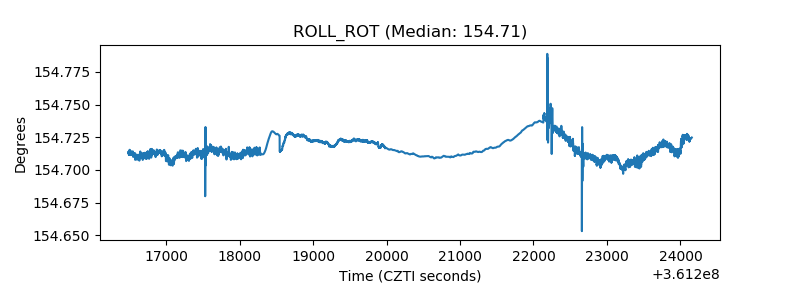 |
| _Roll_DEC | 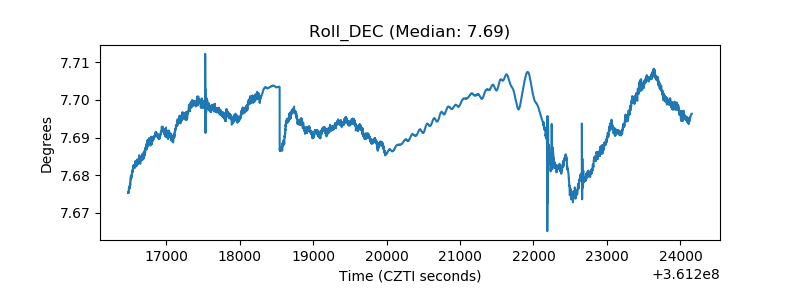 |
| _Roll_RA | 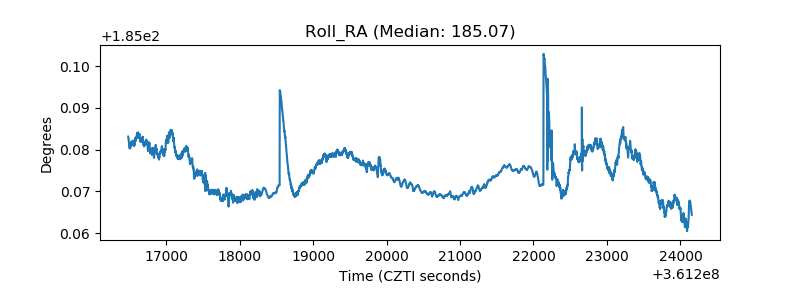 |
| Veto Counter | 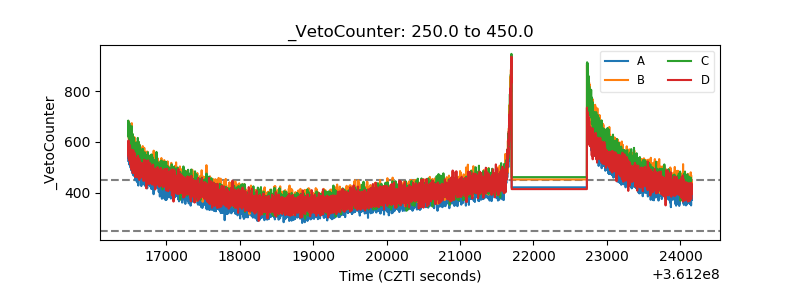 |