| Param | Original file | Final file |
|---|---|---|
| Filename | modeM0/AS1A10_071T46_9000004460_30858cztM0_level2.evt | modeM0/AS1A10_071T46_9000004460_30858cztM0_level2_quad_clean.evt |
| Size (bytes) | 695,710,080 | 93,862,080 |
| Size | 663.5 MB | 89.5 MB |
| Events in quadrant A | 3,261,138 | 627,497 |
| Events in quadrant B | 9,887,885 | 583,956 |
| Events in quadrant C | 3,648,125 | 592,046 |
| Events in quadrant D | 3,834,395 | 586,166 |
| Mode M0 | |||
|---|---|---|---|
| Quadrant | BADHDUFLAG | Total packets | Discarded packets |
| A | 0 | 13725 | 2 |
| B | 0 | 33910 | 2 |
| C | 0 | 14856 | 3 |
| D | 0 | 15632 | 2 |
| Mode SS | |||
|---|---|---|---|
| Quadrant | BADHDUFLAG | Total packets | Discarded packets |
| A | 0 | 132 | 0 |
| B | 0 | 132 | 0 |
| C | 0 | 132 | 0 |
| D | 0 | 132 | 0 |
| Mode M9 | |||
|---|---|---|---|
| Quadrant | BADHDUFLAG | Total packets | Discarded packets |
| A | 0 | 17 | 0 |
| B | 0 | 18 | 0 |
| C | 0 | 18 | 0 |
| D | 0 | 18 | 0 |
| Quadrant | Total seconds | Saturated seconds | Saturation percentage |
|---|---|---|---|
| A | 6484 | 30 | 0.462677% |
| B | 6484 | 1896 | 29.241209% |
| C | 6483 | 154 | 2.375443% |
| D | 6483 | 22 | 0.339349% |
Noise dominated data is calculated using 1-second bins in cleaned event files. If a bin has >2000 counts, and if more than 50% of those come from <1% of pixels, then it is considered to be noise-dominated and hence unusable.
| Quadrant | # 1 sec bins | Bins with >0 counts | Bins with >2000 counts | High rate bins dominated by noise | Noise dominated (total time) | Noise dominated (detector-on time) | Marked lightcurve |
|---|---|---|---|---|---|---|---|
| A | 7649 | 6485 | 8 | 8 | 0.10% | 0.12% | 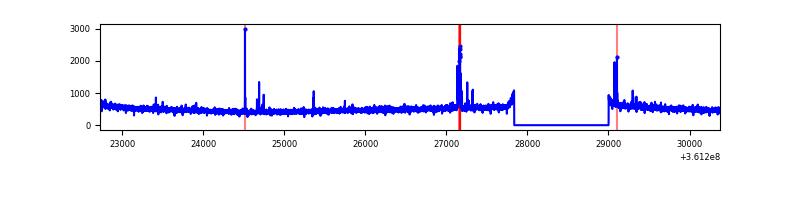 |
| B | 7649 | 6484 | 1224 | 1224 | 16.00% | 18.88% | 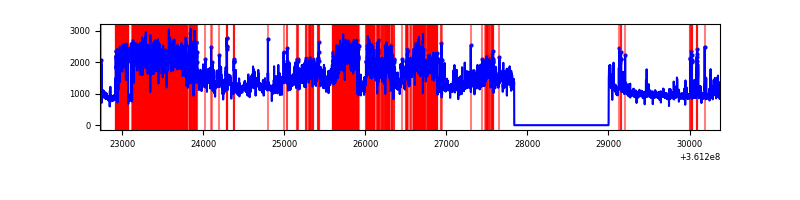 |
| C | 7648 | 6483 | 58 | 58 | 0.76% | 0.89% | 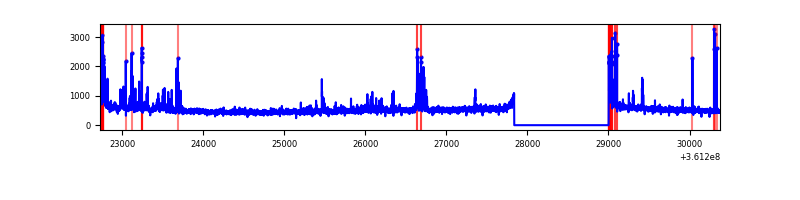 |
| D | 7648 | 6484 | 10 | 10 | 0.13% | 0.15% | 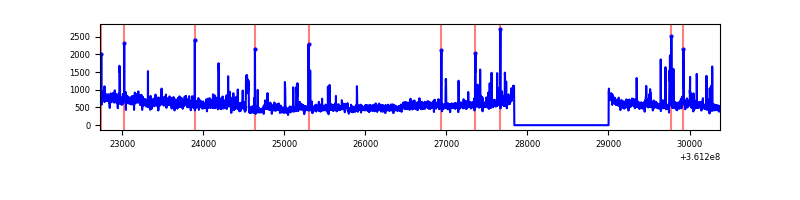 |
Top three noisy pixels from each quadrant. If the there are fewer than three noisy pixels in the level2.evt file, extra rows are filled as -1
| Pixel properties | Quadrant properties | ||||||
|---|---|---|---|---|---|---|---|
| Quadrant | DetID | PixID | Counts | Sigma | Mean | Median | Sigma |
| A | 0 | 13 | 78497 | 470.64 | 824 | 808 | 165.1 |
| A | 13 | 254 | 13198 | 75.06 | 824 | 808 | 165.1 |
| A | 3 | 137 | 8072 | 44.01 | 824 | 808 | 165.1 |
| B | 6 | 36 | 4911990 | 33488.95 | 773 | 755 | 146.7 |
| B | 6 | 159 | 1787948 | 12186.59 | 773 | 755 | 146.7 |
| B | 0 | 229 | 51497 | 346.0 | 773 | 755 | 146.7 |
| C | 0 | 10 | 231274 | 1251.22 | 783 | 790 | 184.2 |
| C | 2 | 16 | 180581 | 976.02 | 783 | 790 | 184.2 |
| C | 14 | 238 | 126818 | 684.16 | 783 | 790 | 184.2 |
| D | 8 | 195 | 680424 | 3660.15 | 786 | 768 | 185.7 |
| D | 2 | 250 | 79637 | 424.73 | 786 | 768 | 185.7 |
| D | 1 | 52 | 31990 | 168.14 | 786 | 768 | 185.7 |
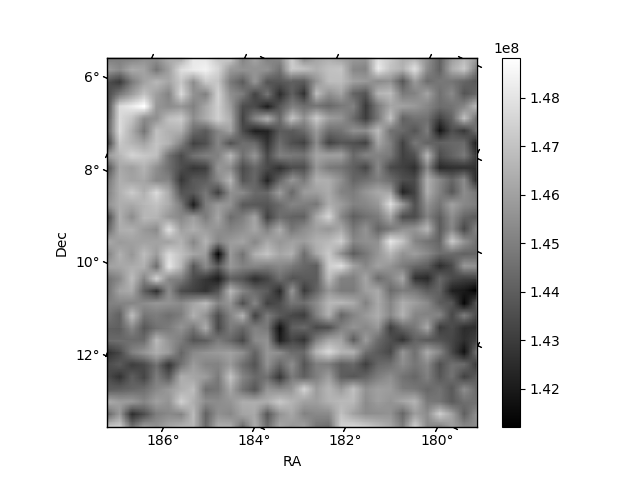
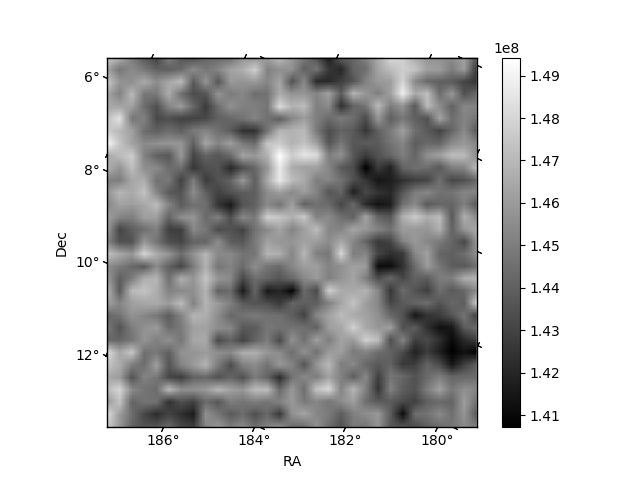
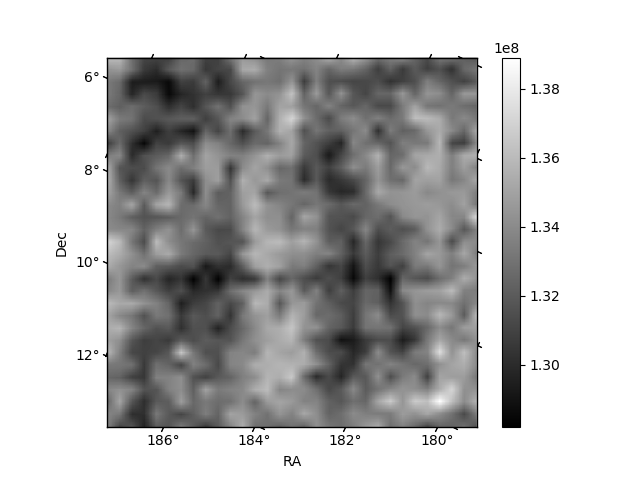
Histogram calculated using DETX and DETY for each event in the final _common_clean file
| Quadrant A | 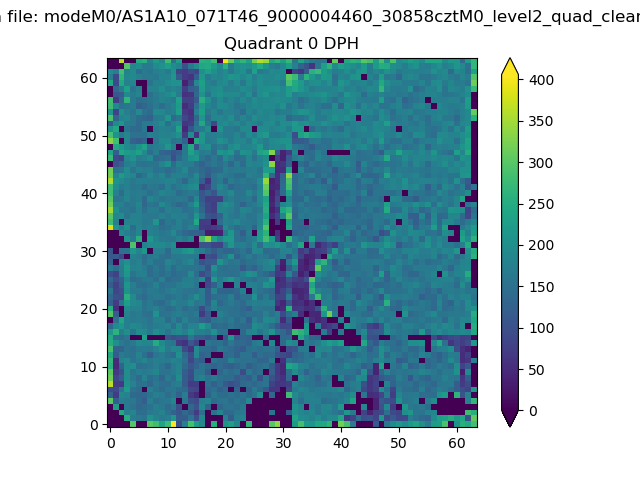 |
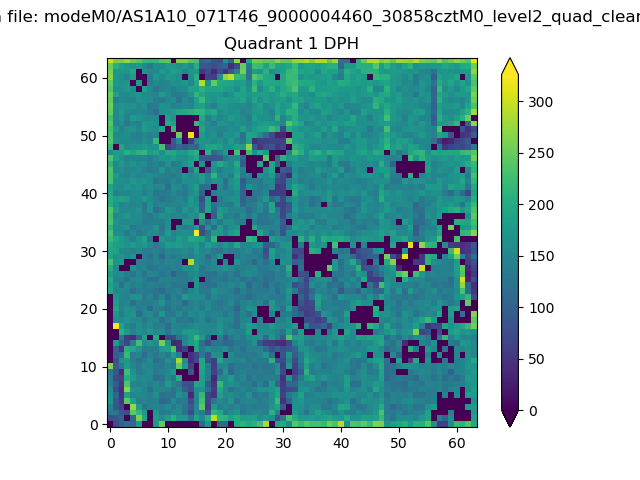 |
Quadrant B |
|---|---|---|---|
| Quadrant D | 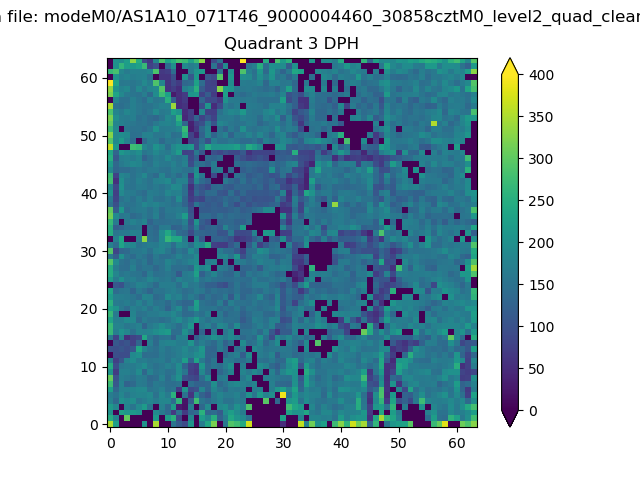 |
 |
Quadrant C |
| Plot type | Count rate plots | Images |
|---|---|---|
| Comparison with Poisson distribution Blue bars denote a histogram of data divided into 1 sec bins. Red curve is a Poisson curve with rate = median count rate of data. |
 |
 |
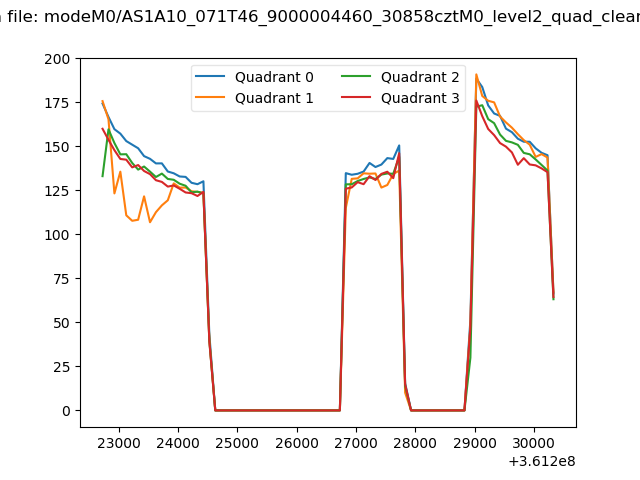
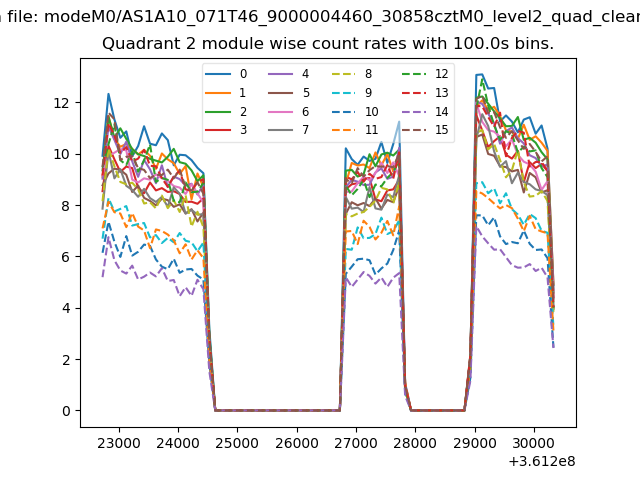
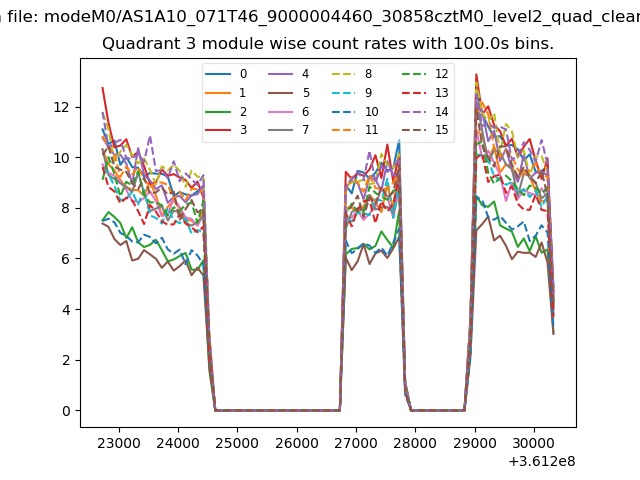
| Quadrant-wise count rates Data is divided into 100 sec bins |
 |
|
| Module-wise count rates for Quadrant A Data is divided into 100 sec bins |
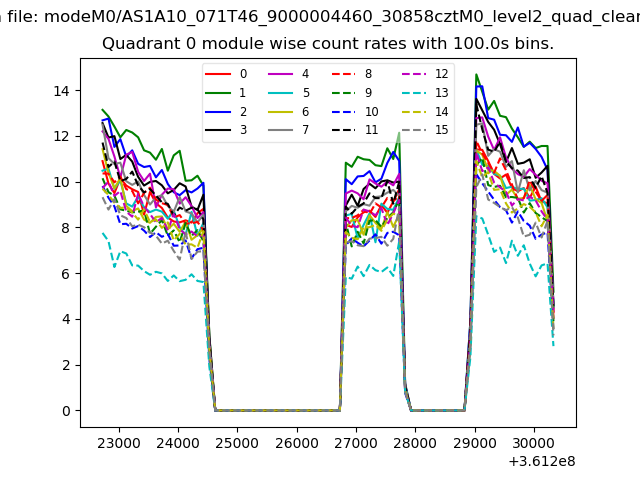 |
 |
| Module-wise count rates for Quadrant B Data is divided into 100 sec bins |
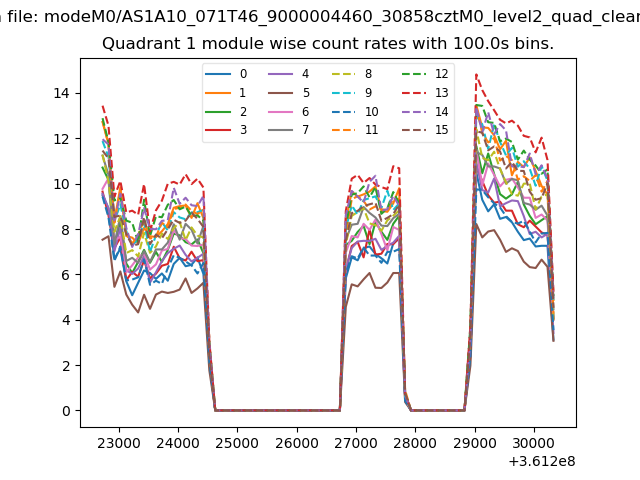 |
 |
| Module-wise count rates for Quadrant C Data is divided into 100 sec bins |
 |
 |
| Module-wise count rates for Quadrant D Data is divided into 100 sec bins |
 |
 |
| Parameter | Plot |
|---|---|
| CZT HV Monitor | 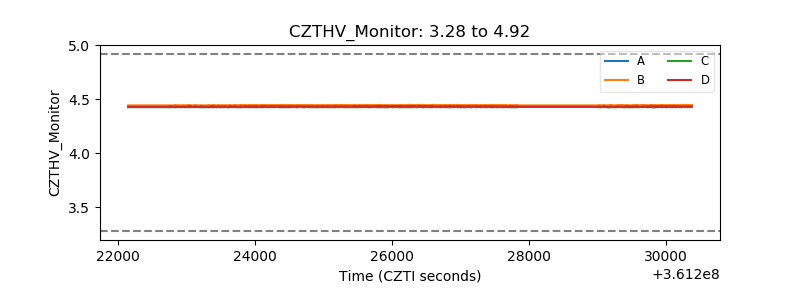 |
| D_VDD | 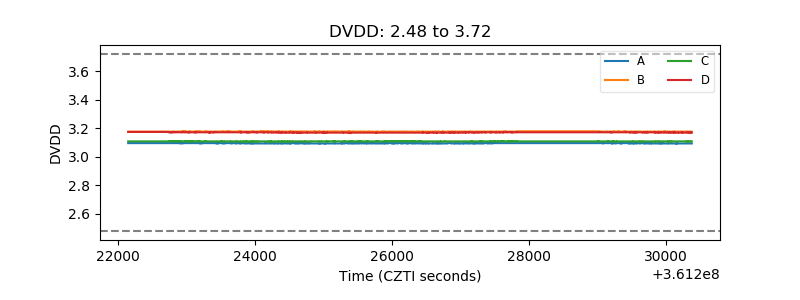 |
| Temperature 1 | 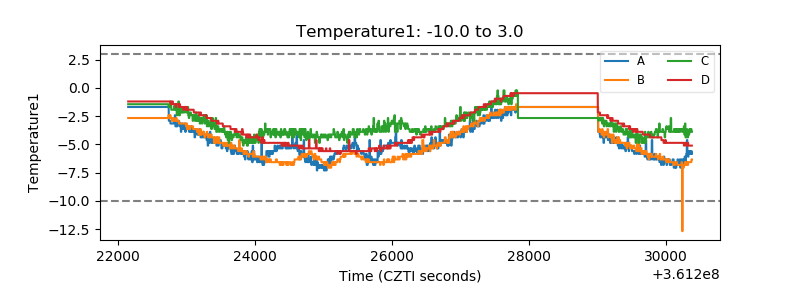 |
| Veto HV Monitor |  |
| Veto LLD | 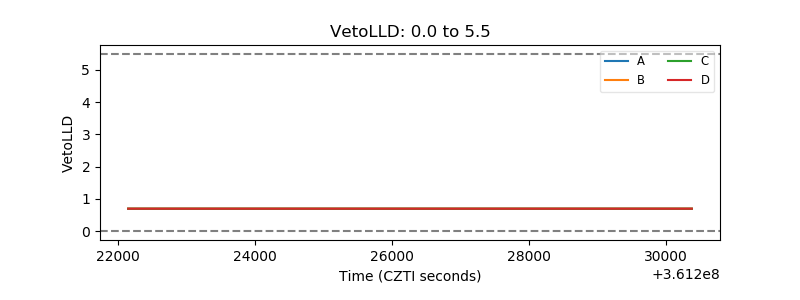 |
| Alpha Counter | 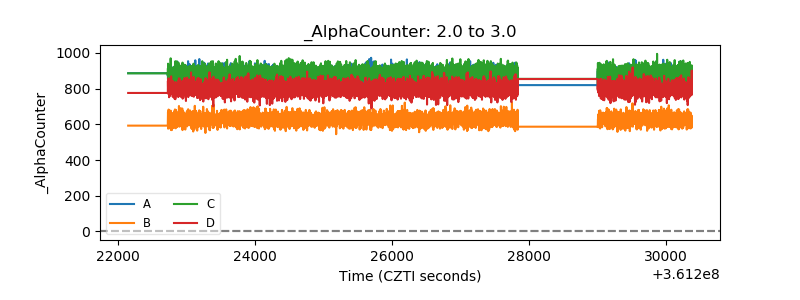 |
| _CPM_Rate | 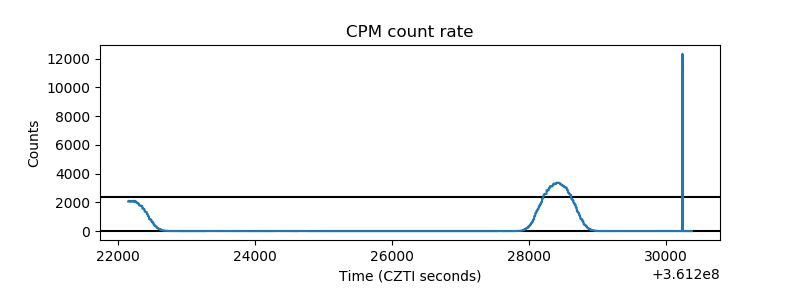 |
| CZT Counter |  |
| +2.5 Volts monitor |  |
| +5 Volts monitor |  |
| _ROLL_ROT | 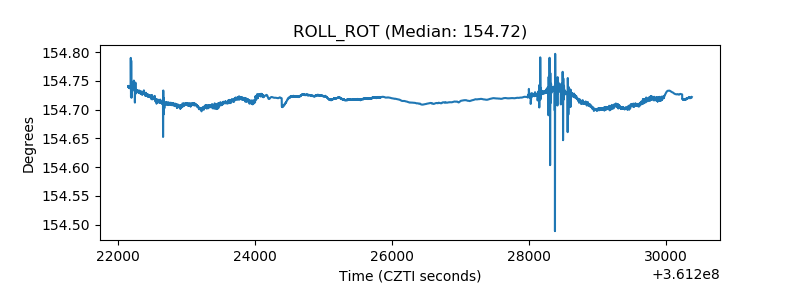 |
| _Roll_DEC | 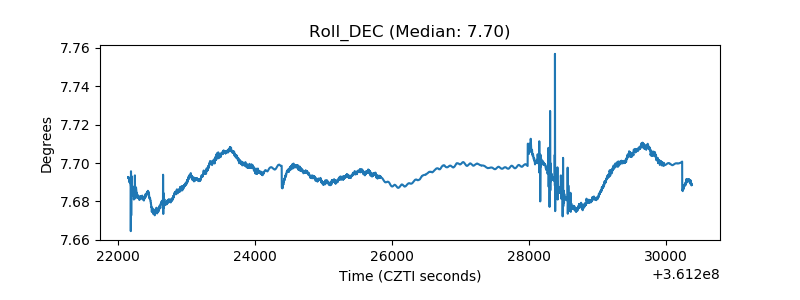 |
| _Roll_RA |  |
| Veto Counter | 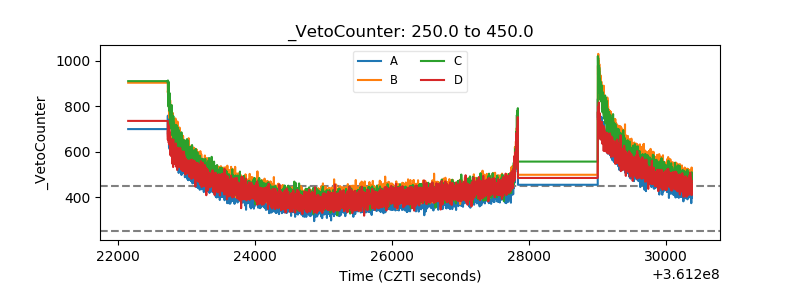 |