| Param | Original file | Final file |
|---|---|---|
| Filename | modeM0/AS1A10_071T46_9000004460_30860cztM0_level2.evt | modeM0/AS1A10_071T46_9000004460_30860cztM0_level2_quad_clean.evt |
| Size (bytes) | 702,743,040 | 82,656,000 |
| Size | 670.2 MB | 78.8 MB |
| Events in quadrant A | 3,513,664 | 540,871 |
| Events in quadrant B | 9,943,365 | 521,562 |
| Events in quadrant C | 3,672,075 | 504,678 |
| Events in quadrant D | 3,732,170 | 499,383 |
| Mode M0 | |||
|---|---|---|---|
| Quadrant | BADHDUFLAG | Total packets | Discarded packets |
| A | 0 | 14146 | 2 |
| B | 0 | 33868 | 4 |
| C | 0 | 14724 | 2 |
| D | 0 | 15077 | 2 |
| Mode SS | |||
|---|---|---|---|
| Quadrant | BADHDUFLAG | Total packets | Discarded packets |
| A | 0 | 126 | 0 |
| B | 0 | 126 | 0 |
| C | 0 | 126 | 0 |
| D | 0 | 126 | 0 |
| Mode M9 | |||
|---|---|---|---|
| Quadrant | BADHDUFLAG | Total packets | Discarded packets |
| A | 0 | 13 | 0 |
| B | 0 | 14 | 0 |
| C | 0 | 14 | 0 |
| D | 0 | 14 | 0 |
| Quadrant | Total seconds | Saturated seconds | Saturation percentage |
|---|---|---|---|
| A | 6254 | 46 | 0.735529% |
| B | 6253 | 1460 | 23.348793% |
| C | 6253 | 160 | 2.558772% |
| D | 6253 | 27 | 0.431793% |
Noise dominated data is calculated using 1-second bins in cleaned event files. If a bin has >2000 counts, and if more than 50% of those come from <1% of pixels, then it is considered to be noise-dominated and hence unusable.
| Quadrant | # 1 sec bins | Bins with >0 counts | Bins with >2000 counts | High rate bins dominated by noise | Noise dominated (total time) | Noise dominated (detector-on time) | Marked lightcurve |
|---|---|---|---|---|---|---|---|
| A | 7569 | 6255 | 22 | 22 | 0.29% | 0.35% | 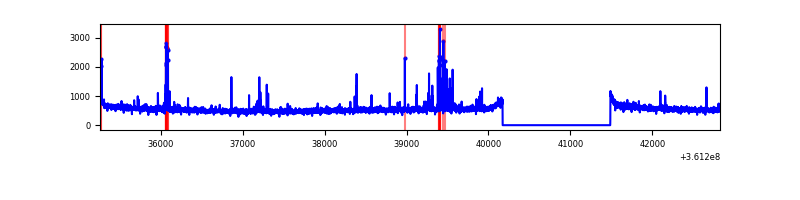 |
| B | 7568 | 6253 | 766 | 766 | 10.12% | 12.25% | 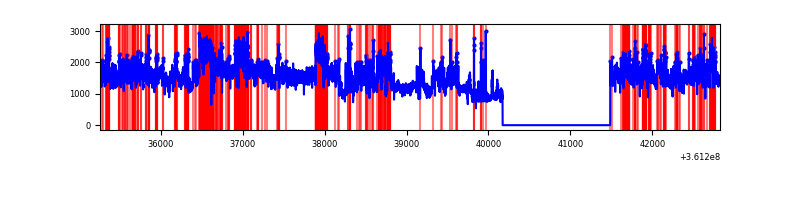 |
| C | 7568 | 6254 | 48 | 48 | 0.63% | 0.77% | 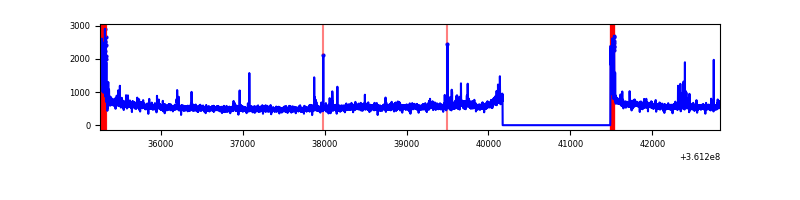 |
| D | 7568 | 6254 | 15 | 15 | 0.20% | 0.24% | 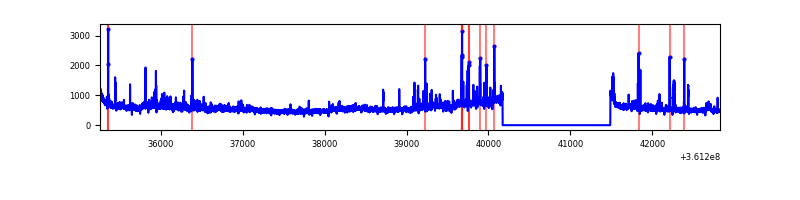 |
Top three noisy pixels from each quadrant. If the there are fewer than three noisy pixels in the level2.evt file, extra rows are filled as -1
| Pixel properties | Quadrant properties | ||||||
|---|---|---|---|---|---|---|---|
| Quadrant | DetID | PixID | Counts | Sigma | Mean | Median | Sigma |
| A | 0 | 13 | 173860 | 1004.91 | 866 | 850 | 172.2 |
| A | 13 | 254 | 12122 | 65.47 | 866 | 850 | 172.2 |
| A | 3 | 137 | 7889 | 40.89 | 866 | 850 | 172.2 |
| B | 6 | 36 | 4903730 | 31889.27 | 824 | 806 | 153.7 |
| B | 6 | 159 | 1731269 | 11255.16 | 824 | 806 | 153.7 |
| B | 5 | 172 | 37903 | 241.28 | 824 | 806 | 153.7 |
| C | 0 | 10 | 191889 | 1008.65 | 811 | 816 | 189.4 |
| C | 14 | 238 | 133546 | 700.66 | 811 | 816 | 189.4 |
| C | 2 | 16 | 123790 | 649.16 | 811 | 816 | 189.4 |
| D | 8 | 195 | 510363 | 2645.01 | 813 | 795 | 192.7 |
| D | 2 | 250 | 90612 | 466.21 | 813 | 795 | 192.7 |
| D | 2 | 234 | 26152 | 131.62 | 813 | 795 | 192.7 |
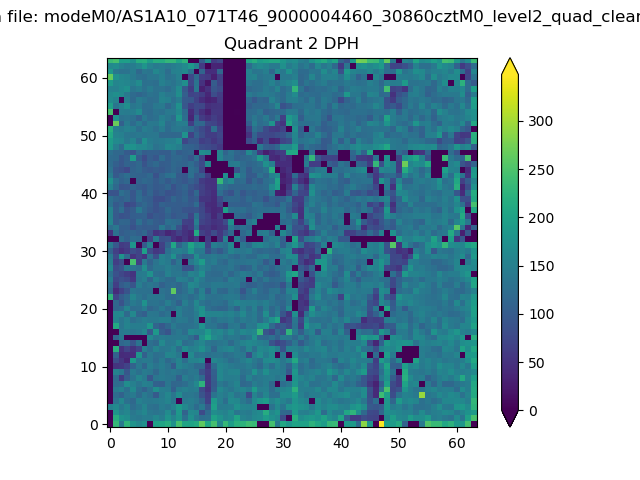
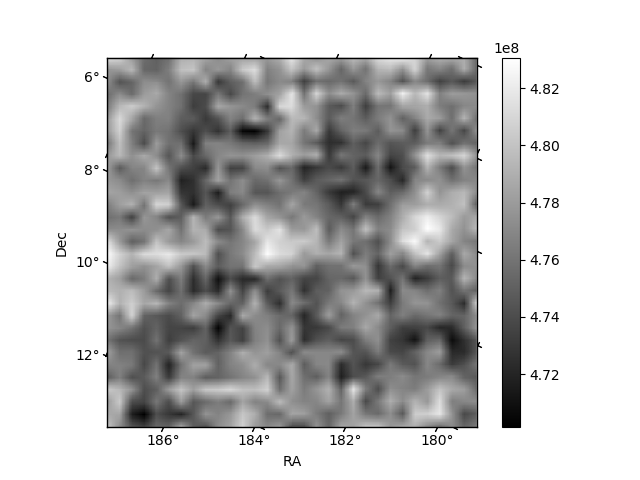
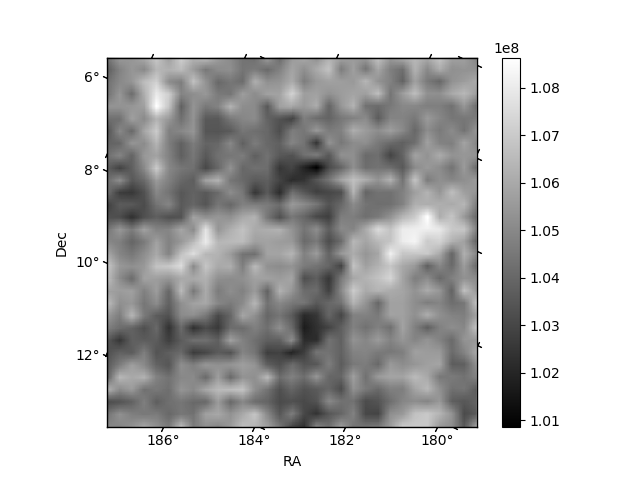
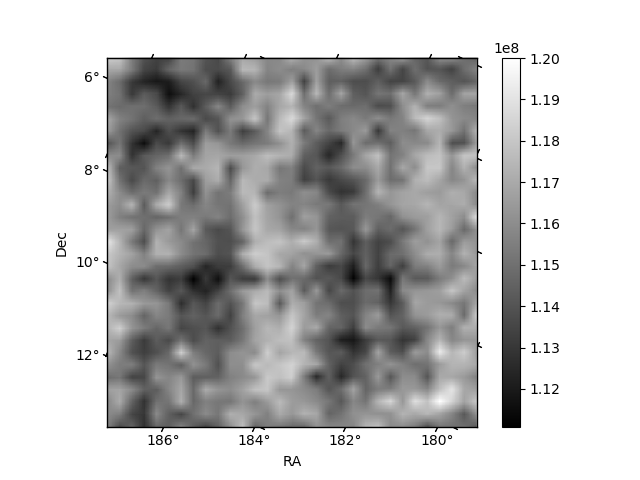
Histogram calculated using DETX and DETY for each event in the final _common_clean file
| Quadrant A | 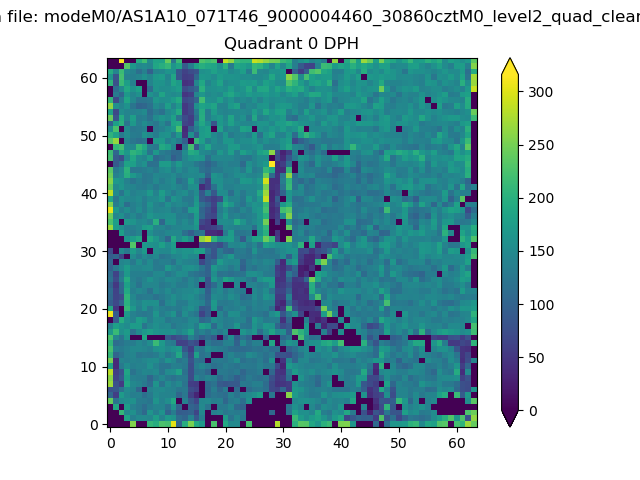 |
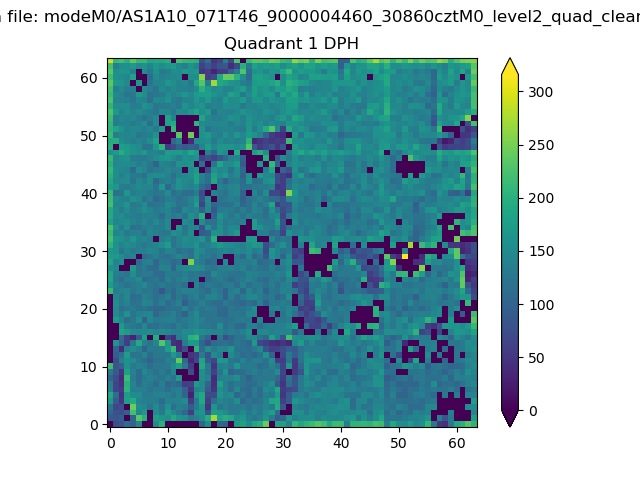 |
Quadrant B |
|---|---|---|---|
| Quadrant D | 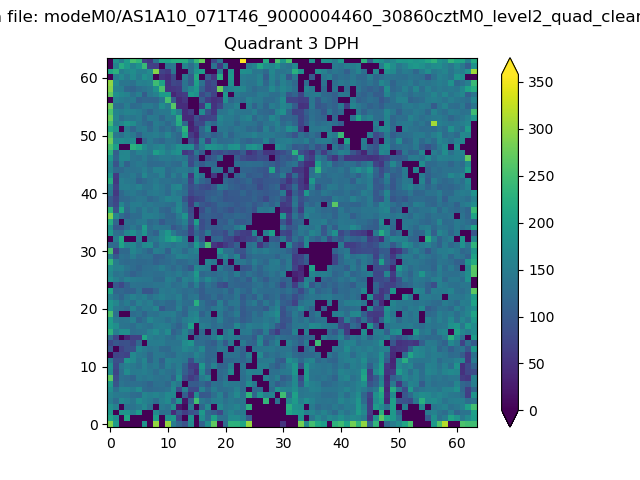 |
 |
Quadrant C |
| Plot type | Count rate plots | Images |
|---|---|---|
| Comparison with Poisson distribution Blue bars denote a histogram of data divided into 1 sec bins. Red curve is a Poisson curve with rate = median count rate of data. |
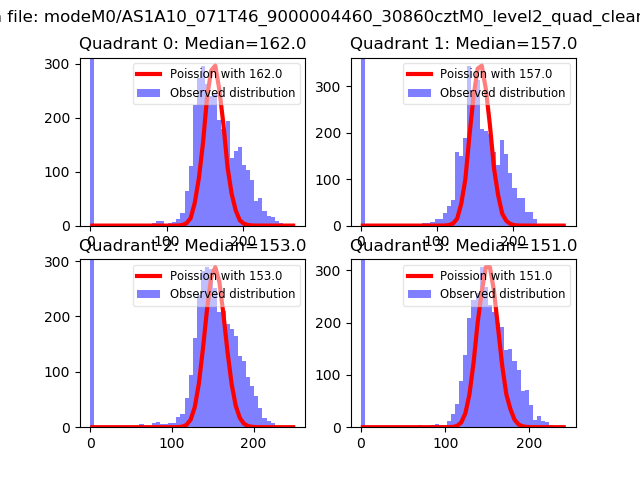 |
 |
| Quadrant-wise count rates Data is divided into 100 sec bins |
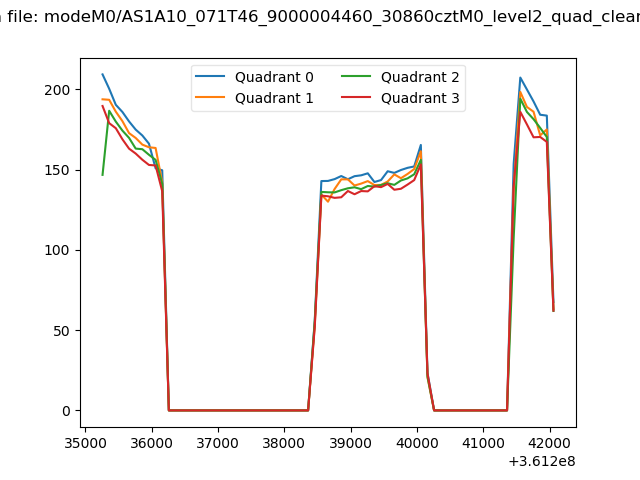 |
|
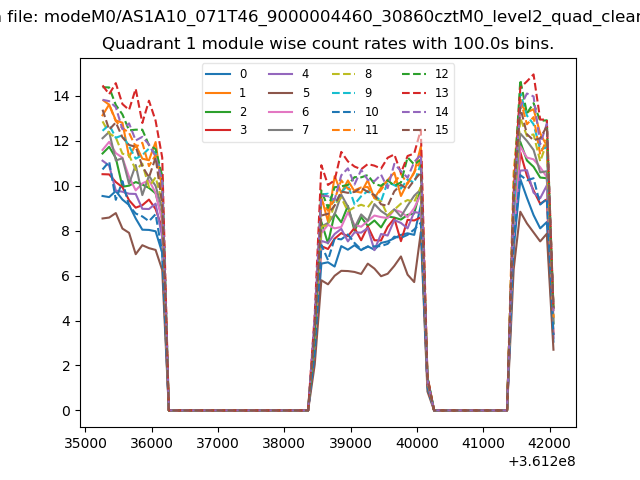
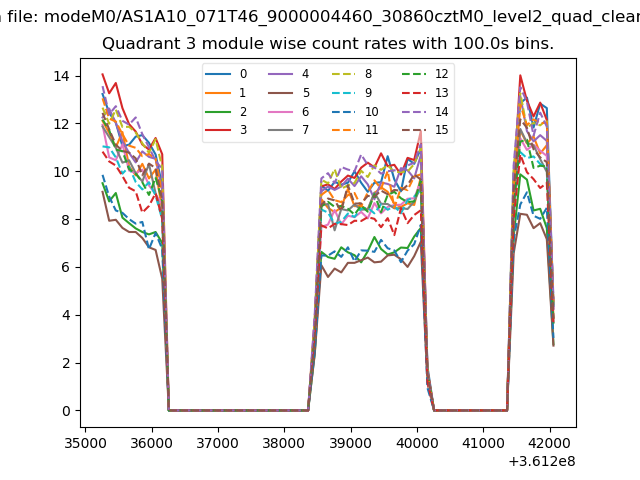
| Module-wise count rates for Quadrant A Data is divided into 100 sec bins |
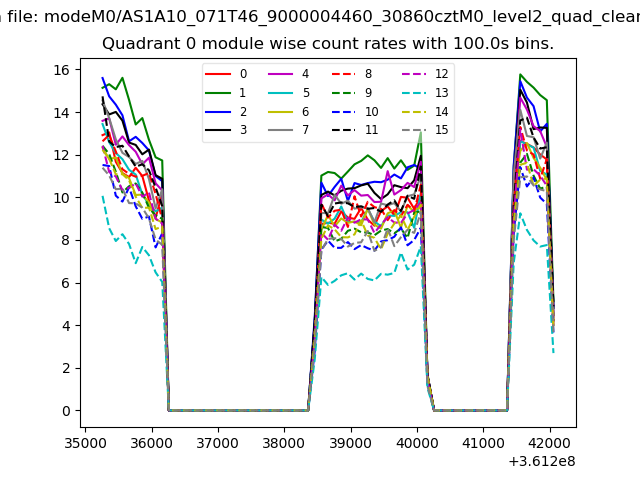 |
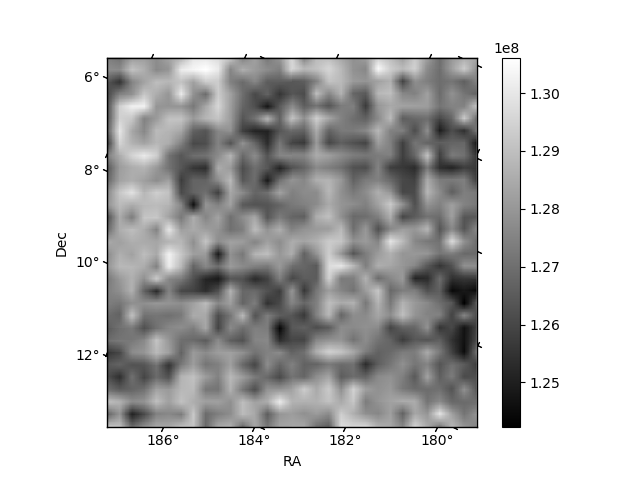 |
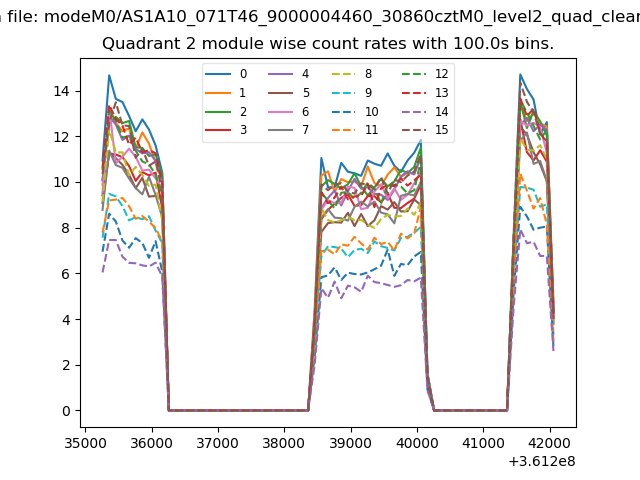
| Module-wise count rates for Quadrant B Data is divided into 100 sec bins |
 |
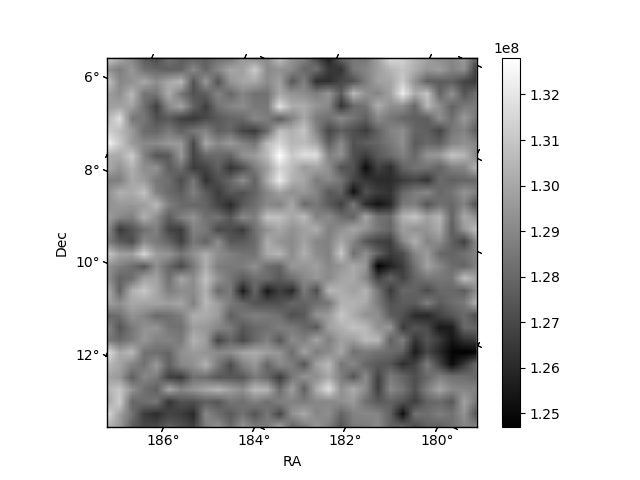 |
| Module-wise count rates for Quadrant C Data is divided into 100 sec bins |
 |
 |
| Module-wise count rates for Quadrant D Data is divided into 100 sec bins |
 |
 |
| Parameter | Plot |
|---|---|
| CZT HV Monitor | 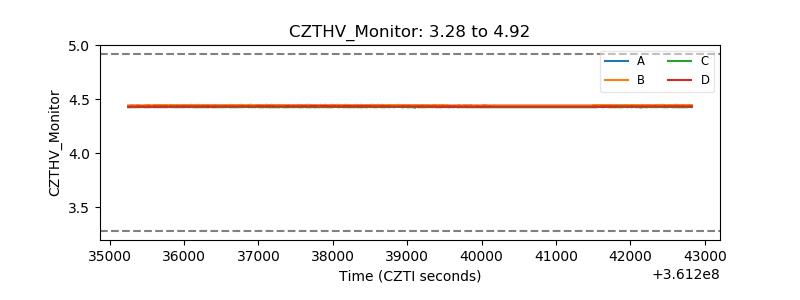 |
| D_VDD |  |
| Temperature 1 | 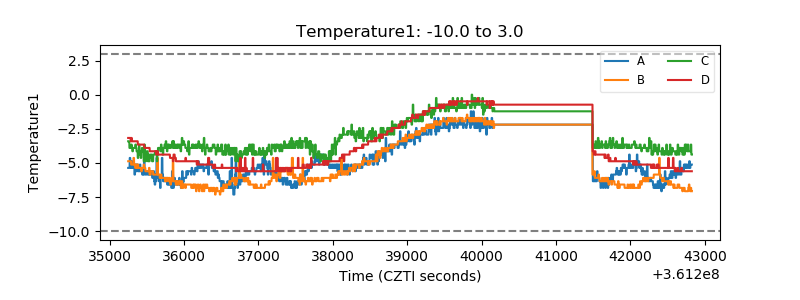 |
| Veto HV Monitor | 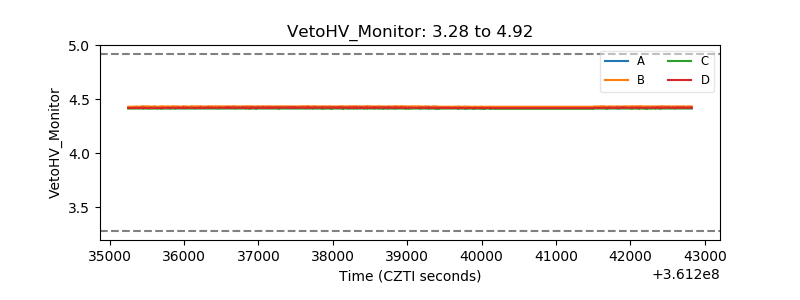 |
| Veto LLD | 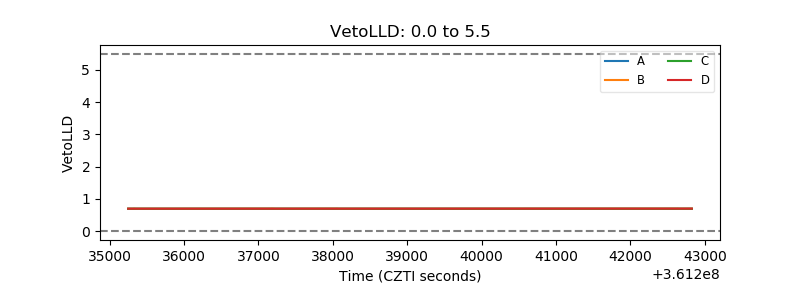 |
| Alpha Counter | 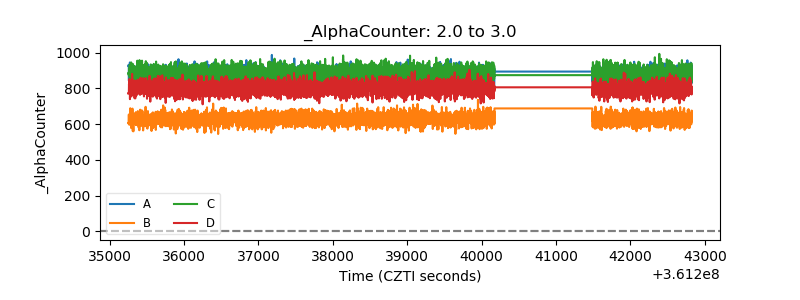 |
| _CPM_Rate | 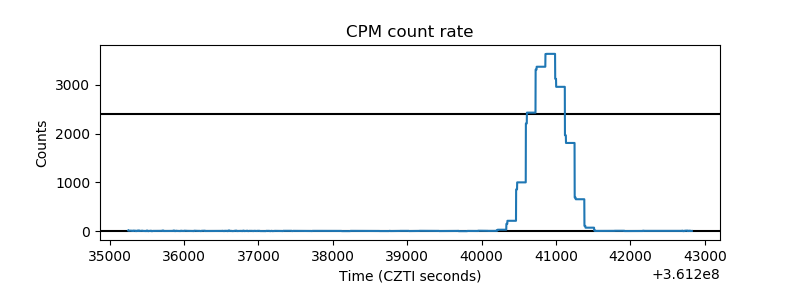 |
| CZT Counter | 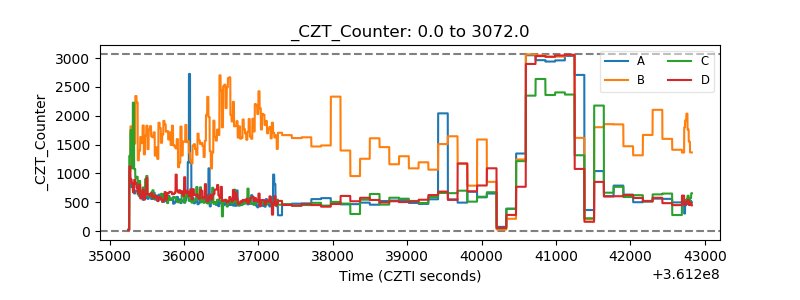 |
| +2.5 Volts monitor |  |
| +5 Volts monitor | 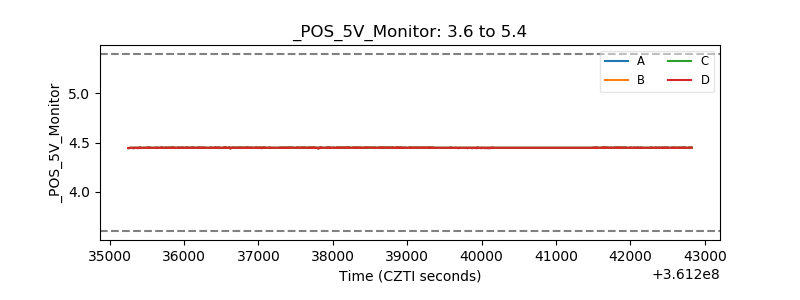 |
| _ROLL_ROT | 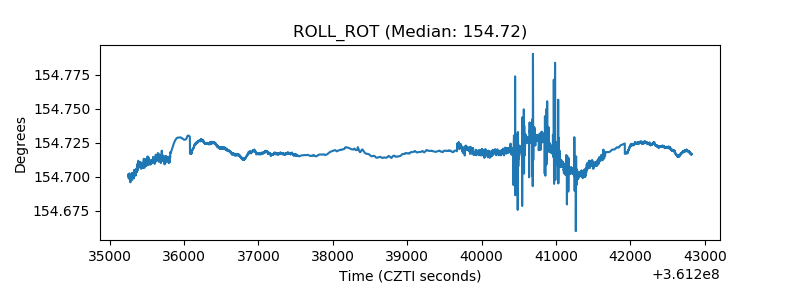 |
| _Roll_DEC | 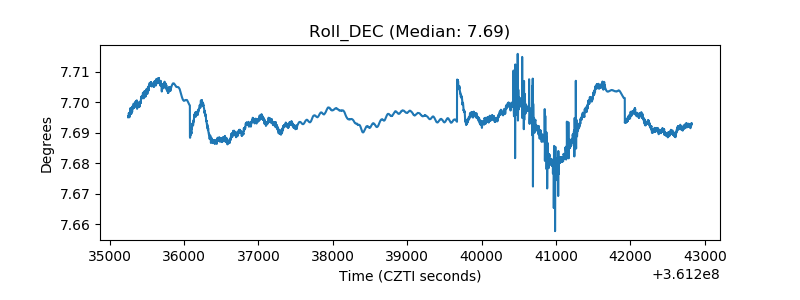 |
| _Roll_RA | 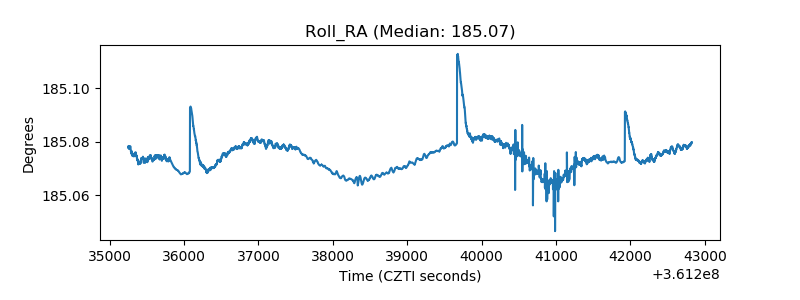 |
| Veto Counter | 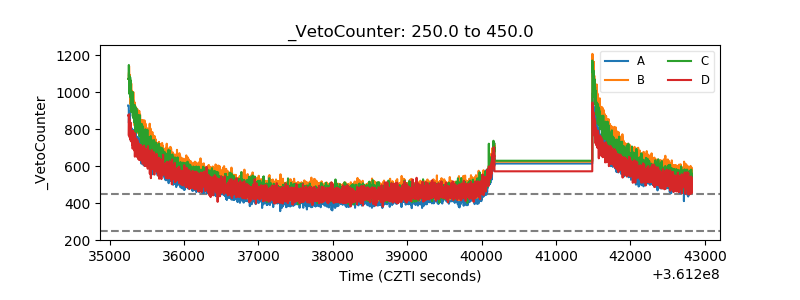 |