| Param | Original file | Final file |
|---|---|---|
| Filename | modeM0/AS1A10_071T46_9000004460_30863cztM0_level2.evt | modeM0/AS1A10_071T46_9000004460_30863cztM0_level2_quad_clean.evt |
| Size (bytes) | 700,358,400 | 72,869,760 |
| Size | 667.9 MB | 69.5 MB |
| Events in quadrant A | 3,469,178 | 454,695 |
| Events in quadrant B | 9,760,306 | 423,242 |
| Events in quadrant C | 3,624,145 | 429,694 |
| Events in quadrant D | 3,901,273 | 428,135 |
| Mode M0 | |||
|---|---|---|---|
| Quadrant | BADHDUFLAG | Total packets | Discarded packets |
| A | 0 | 14108 | 2 |
| B | 0 | 33783 | 4 |
| C | 0 | 14582 | 2 |
| D | 0 | 15847 | 2 |
| Mode SS | |||
|---|---|---|---|
| Quadrant | BADHDUFLAG | Total packets | Discarded packets |
| A | 0 | 136 | 0 |
| B | 0 | 136 | 0 |
| C | 0 | 136 | 0 |
| D | 0 | 136 | 0 |
| Mode M9 | |||
|---|---|---|---|
| Quadrant | BADHDUFLAG | Total packets | Discarded packets |
| A | 0 | 12 | 0 |
| B | 0 | 13 | 0 |
| C | 0 | 13 | 0 |
| D | 0 | 13 | 0 |
| Quadrant | Total seconds | Saturated seconds | Saturation percentage |
|---|---|---|---|
| A | 6752 | 104 | 1.540284% |
| B | 6751 | 1360 | 20.145164% |
| C | 6751 | 171 | 2.532958% |
| D | 6751 | 83 | 1.229447% |
Noise dominated data is calculated using 1-second bins in cleaned event files. If a bin has >2000 counts, and if more than 50% of those come from <1% of pixels, then it is considered to be noise-dominated and hence unusable.
| Quadrant | # 1 sec bins | Bins with >0 counts | Bins with >2000 counts | High rate bins dominated by noise | Noise dominated (total time) | Noise dominated (detector-on time) | Marked lightcurve |
|---|---|---|---|---|---|---|---|
| A | 7702 | 6752 | 0 | 0 | 0.00% | 0.00% | 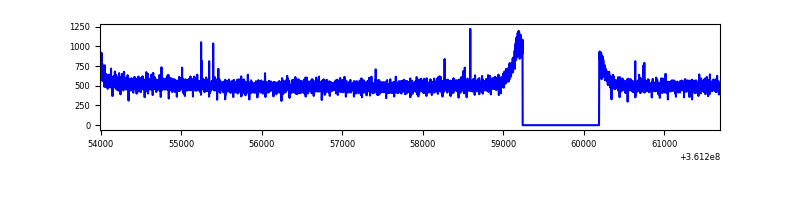 |
| B | 7701 | 6751 | 609 | 609 | 7.91% | 9.02% |  |
| C | 7701 | 6751 | 12 | 12 | 0.16% | 0.18% | 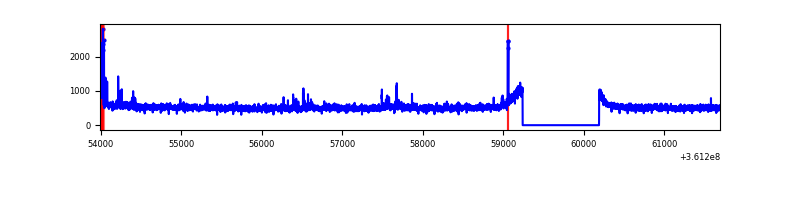 |
| D | 7701 | 6751 | 11 | 11 | 0.14% | 0.16% |  |
Top three noisy pixels from each quadrant. If the there are fewer than three noisy pixels in the level2.evt file, extra rows are filled as -1
| Pixel properties | Quadrant properties | ||||||
|---|---|---|---|---|---|---|---|
| Quadrant | DetID | PixID | Counts | Sigma | Mean | Median | Sigma |
| A | 13 | 254 | 12847 | 66.5 | 897 | 881 | 179.9 |
| A | 3 | 137 | 8779 | 43.89 | 897 | 881 | 179.9 |
| A | 0 | 31 | 7519 | 36.89 | 897 | 881 | 179.9 |
| B | 6 | 36 | 4509342 | 27893.15 | 844 | 823 | 161.6 |
| B | 6 | 159 | 1749397 | 10818.02 | 844 | 823 | 161.6 |
| B | 0 | 190 | 82606 | 505.97 | 844 | 823 | 161.6 |
| C | 14 | 238 | 136540 | 683.84 | 844 | 851 | 198.4 |
| C | 2 | 16 | 81200 | 404.94 | 844 | 851 | 198.4 |
| C | 0 | 10 | 55774 | 276.8 | 844 | 851 | 198.4 |
| D | 8 | 195 | 499990 | 2488.57 | 852 | 833 | 200.6 |
| D | 12 | 233 | 69660 | 343.14 | 852 | 833 | 200.6 |
| D | 2 | 250 | 57677 | 283.4 | 852 | 833 | 200.6 |
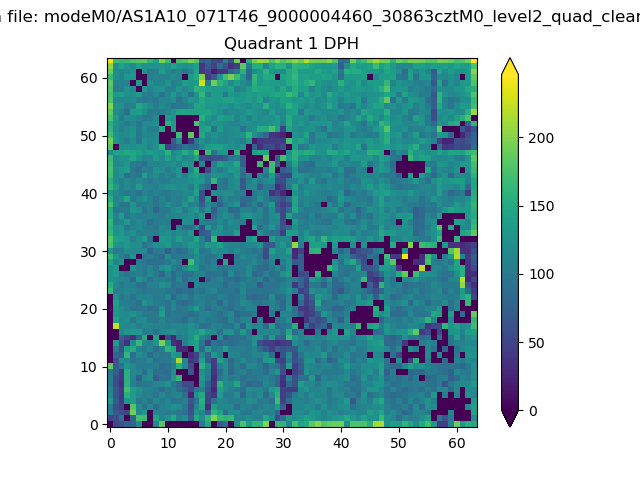
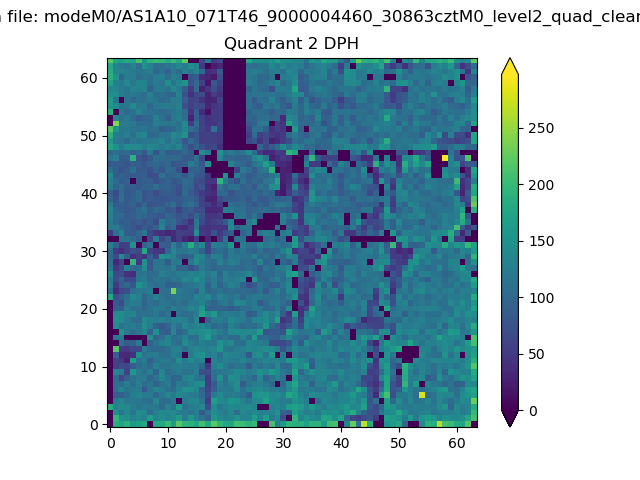
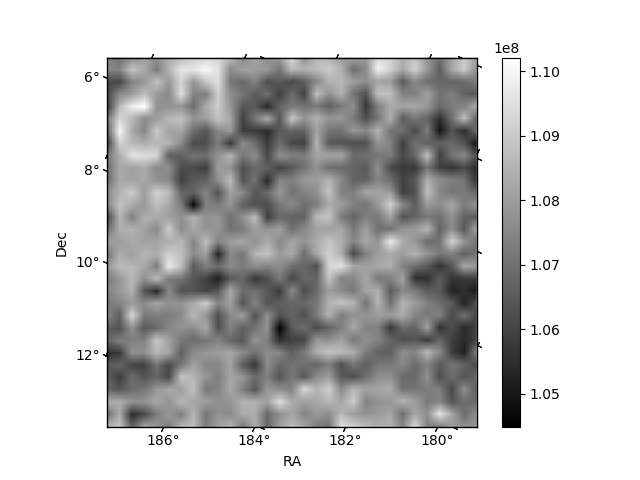
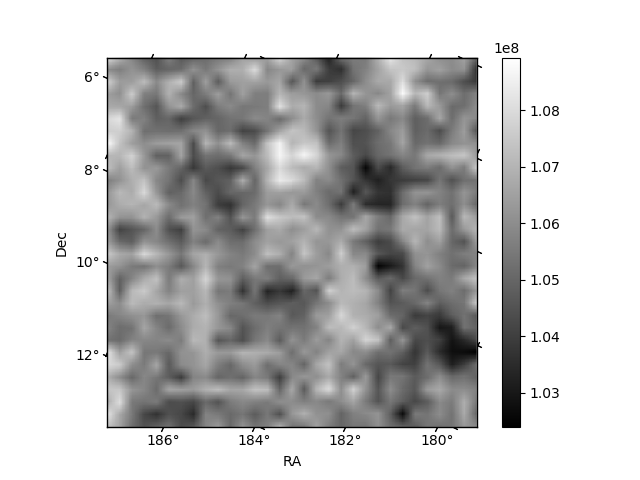
Histogram calculated using DETX and DETY for each event in the final _common_clean file
| Quadrant A |  |
 |
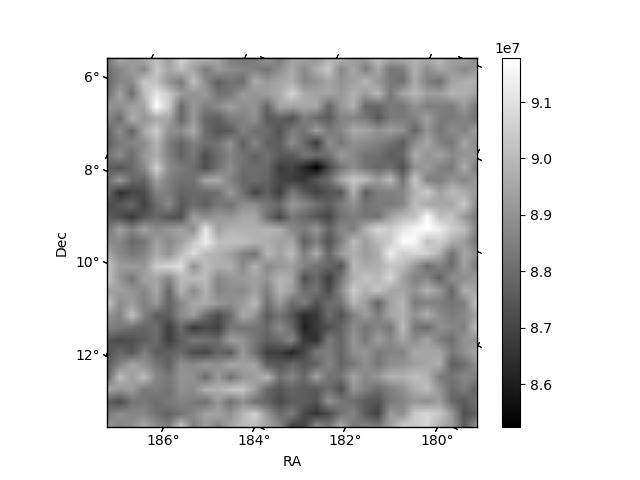
Quadrant B |
|---|---|---|---|
| Quadrant D | 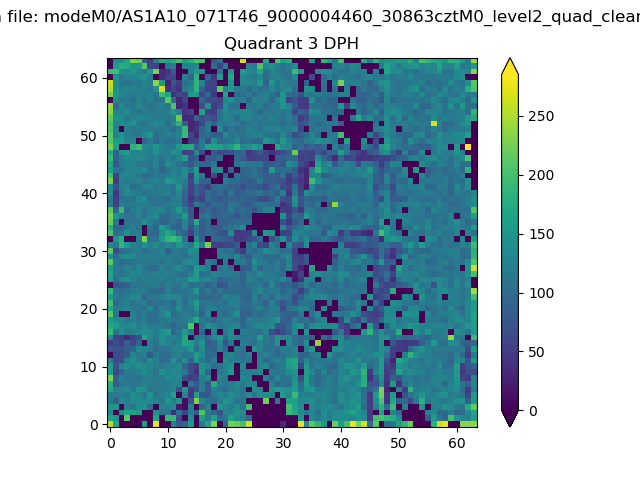 |
 |
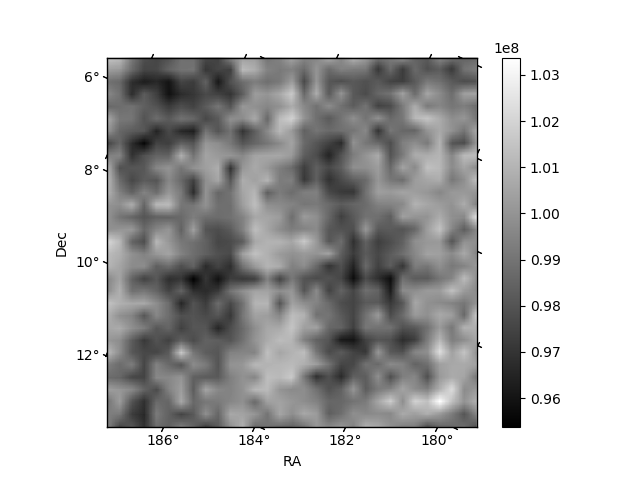
Quadrant C |
| Plot type | Count rate plots | Images |
|---|---|---|
| Comparison with Poisson distribution Blue bars denote a histogram of data divided into 1 sec bins. Red curve is a Poisson curve with rate = median count rate of data. |
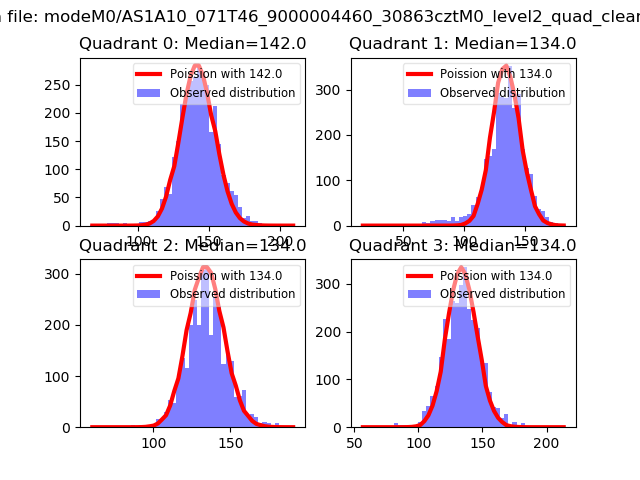 |
 |
| Quadrant-wise count rates Data is divided into 100 sec bins |
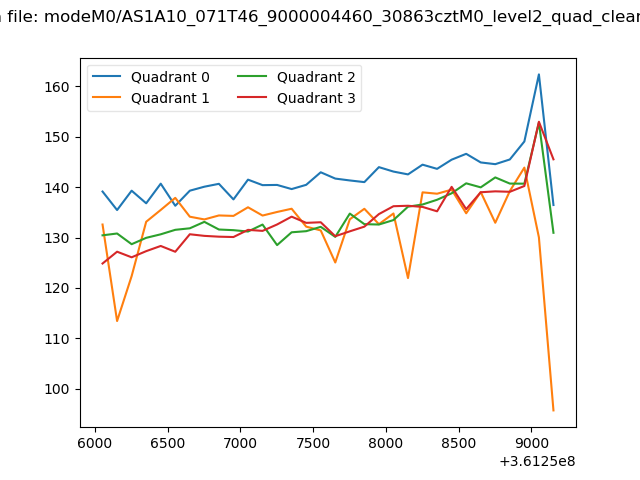 |
|
| Module-wise count rates for Quadrant A Data is divided into 100 sec bins |
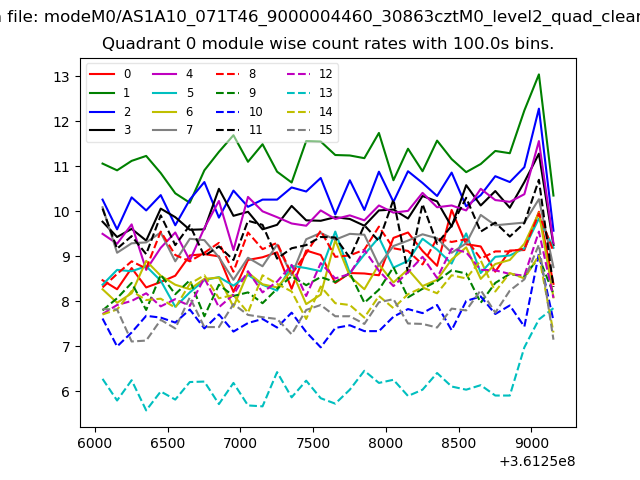 |
 |
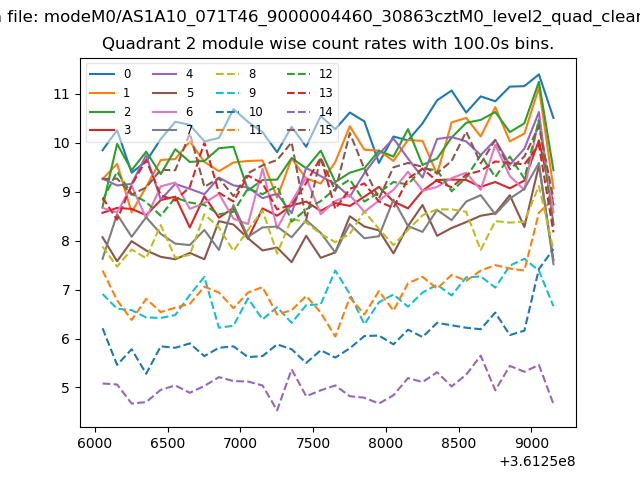
| Module-wise count rates for Quadrant B Data is divided into 100 sec bins |
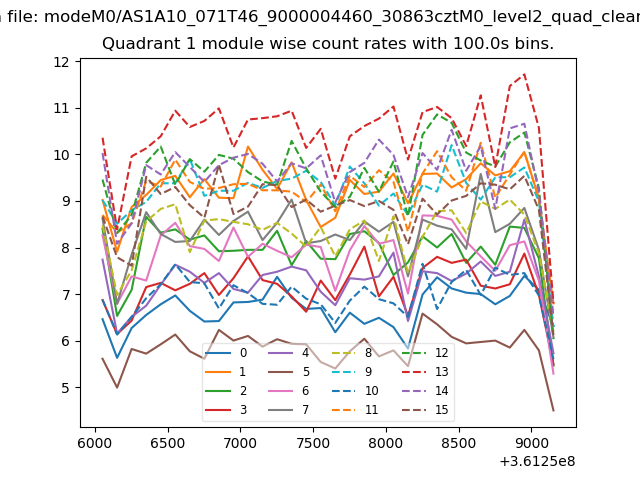 |
 |
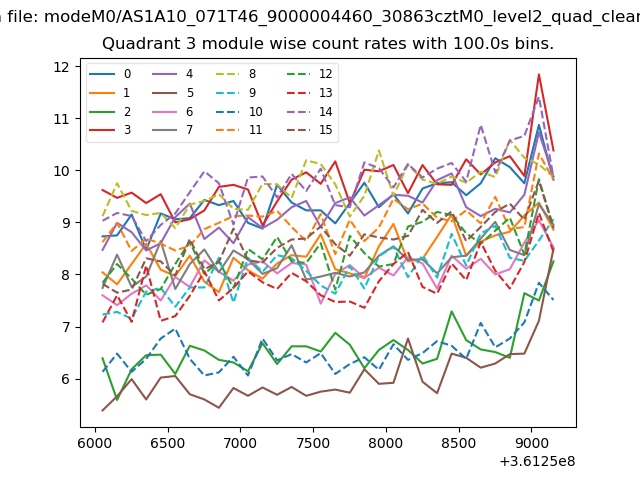
| Module-wise count rates for Quadrant C Data is divided into 100 sec bins |
 |
 |
| Module-wise count rates for Quadrant D Data is divided into 100 sec bins |
 |
 |
| Parameter | Plot |
|---|---|
| CZT HV Monitor | 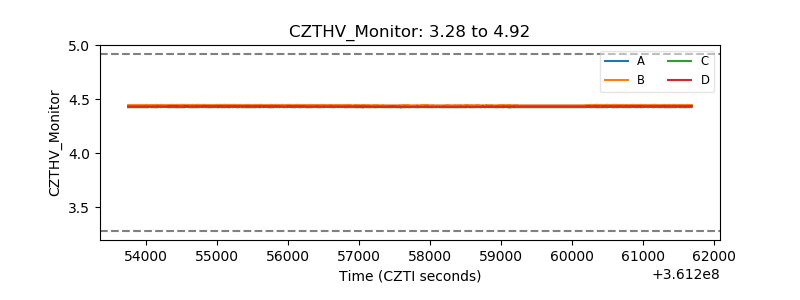 |
| D_VDD | 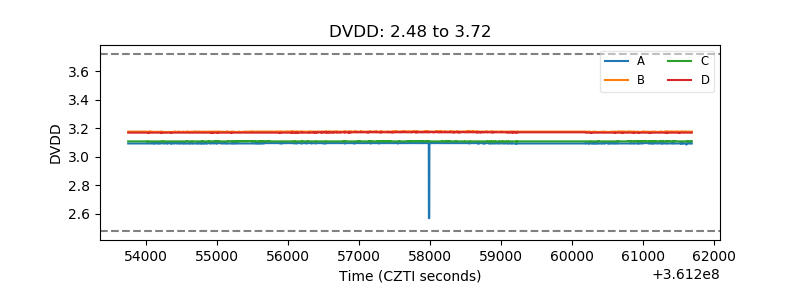 |
| Temperature 1 |  |
| Veto HV Monitor | 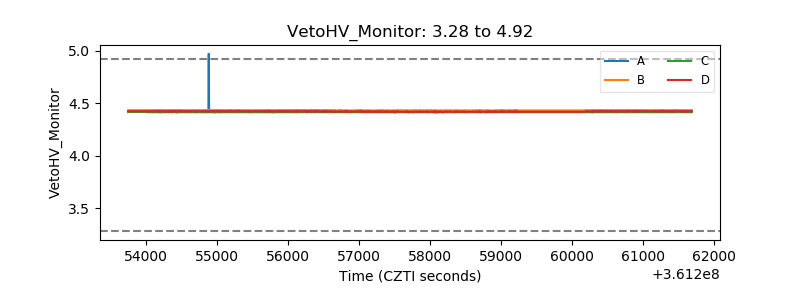 |
| Veto LLD |  |
| Alpha Counter | 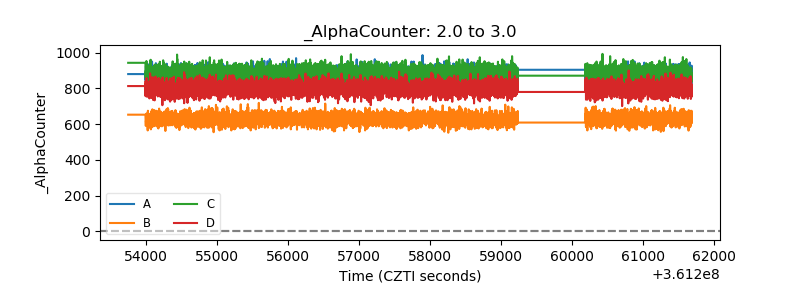 |
| _CPM_Rate | 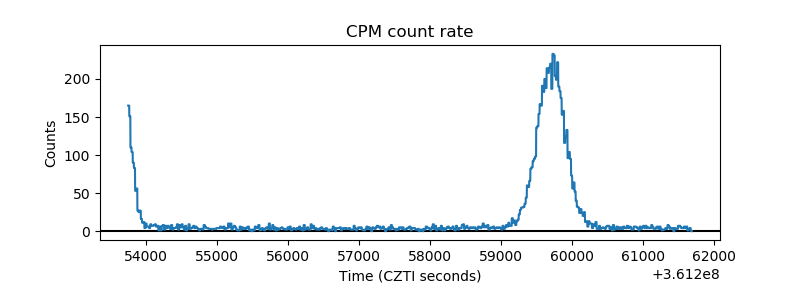 |
| CZT Counter | 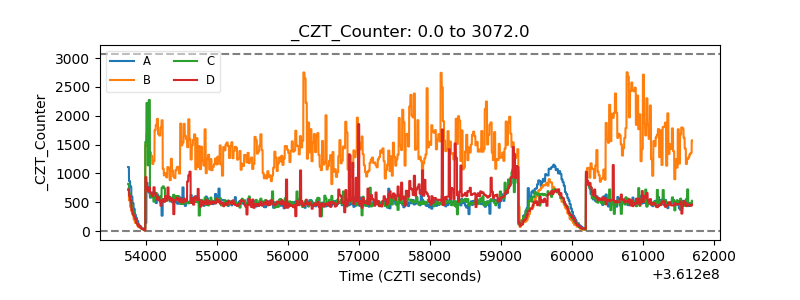 |
| +2.5 Volts monitor |  |
| +5 Volts monitor |  |
| _ROLL_ROT | 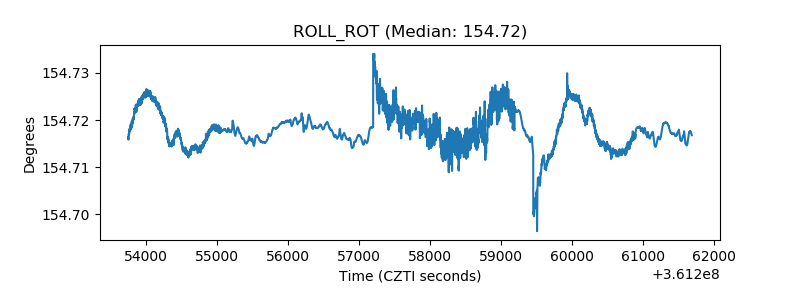 |
| _Roll_DEC | 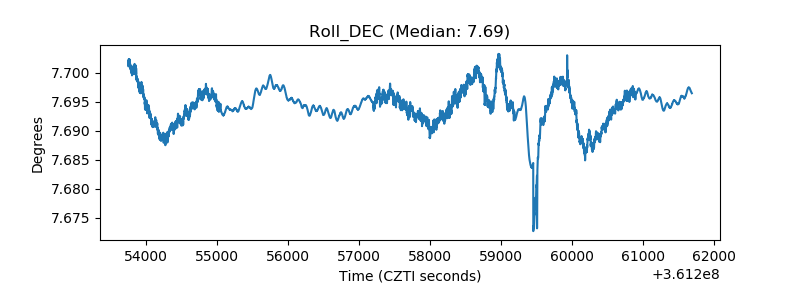 |
| _Roll_RA | 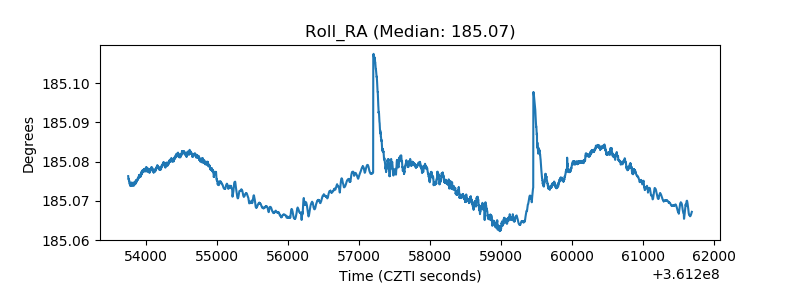 |
| Veto Counter | 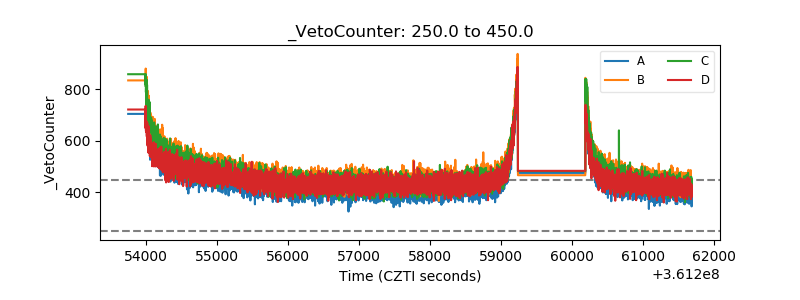 |