| Param | Original file | Final file |
|---|---|---|
| Filename | modeM0/AS1A10_071T46_9000004460_30864cztM0_level2.evt | modeM0/AS1A10_071T46_9000004460_30864cztM0_level2_quad_clean.evt |
| Size (bytes) | 751,417,920 | 81,397,440 |
| Size | 716.6 MB | 77.6 MB |
| Events in quadrant A | 3,692,347 | 512,575 |
| Events in quadrant B | 10,630,894 | 484,129 |
| Events in quadrant C | 3,776,681 | 484,027 |
| Events in quadrant D | 4,168,033 | 479,796 |
| Mode M0 | |||
|---|---|---|---|
| Quadrant | BADHDUFLAG | Total packets | Discarded packets |
| A | 0 | 15323 | 2 |
| B | 0 | 36651 | 2 |
| C | 0 | 15450 | 2 |
| D | 0 | 16850 | 3 |
| Mode SS | |||
|---|---|---|---|
| Quadrant | BADHDUFLAG | Total packets | Discarded packets |
| A | 0 | 148 | 0 |
| B | 0 | 148 | 0 |
| C | 0 | 148 | 0 |
| D | 0 | 148 | 0 |
| Mode M9 | |||
|---|---|---|---|
| Quadrant | BADHDUFLAG | Total packets | Discarded packets |
| A | 0 | 13 | 0 |
| B | 0 | 14 | 0 |
| C | 0 | 14 | 0 |
| D | 0 | 14 | 0 |
| Quadrant | Total seconds | Saturated seconds | Saturation percentage |
|---|---|---|---|
| A | 7235 | 183 | 2.529371% |
| B | 7235 | 1587 | 21.935038% |
| C | 7235 | 227 | 3.137526% |
| D | 7234 | 152 | 2.101189% |
Noise dominated data is calculated using 1-second bins in cleaned event files. If a bin has >2000 counts, and if more than 50% of those come from <1% of pixels, then it is considered to be noise-dominated and hence unusable.
| Quadrant | # 1 sec bins | Bins with >0 counts | Bins with >2000 counts | High rate bins dominated by noise | Noise dominated (total time) | Noise dominated (detector-on time) | Marked lightcurve |
|---|---|---|---|---|---|---|---|
| A | 7765 | 7235 | 7 | 7 | 0.09% | 0.10% | 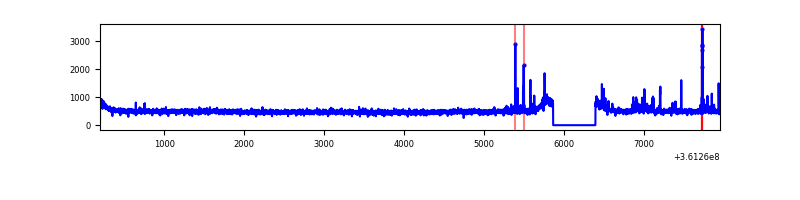 |
| B | 7765 | 7235 | 589 | 589 | 7.59% | 8.14% | 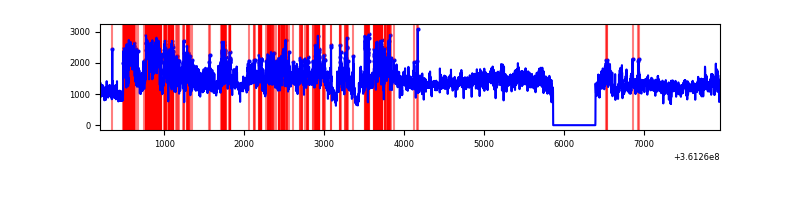 |
| C | 7765 | 7235 | 2 | 2 | 0.03% | 0.03% | 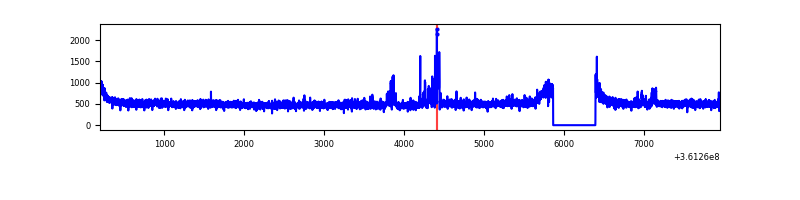 |
| D | 7764 | 7234 | 23 | 23 | 0.30% | 0.32% | 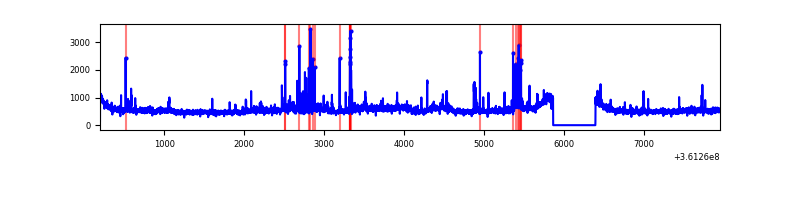 |
Top three noisy pixels from each quadrant. If the there are fewer than three noisy pixels in the level2.evt file, extra rows are filled as -1
| Pixel properties | Quadrant properties | ||||||
|---|---|---|---|---|---|---|---|
| Quadrant | DetID | PixID | Counts | Sigma | Mean | Median | Sigma |
| A | 0 | 13 | 111816 | 591.37 | 928 | 908 | 187.5 |
| A | 13 | 254 | 13712 | 68.27 | 928 | 908 | 187.5 |
| A | 3 | 137 | 9623 | 46.47 | 928 | 908 | 187.5 |
| B | 6 | 36 | 5123133 | 30125.43 | 872 | 849 | 170.0 |
| B | 6 | 159 | 1875917 | 11027.74 | 872 | 849 | 170.0 |
| B | 0 | 156 | 72423 | 420.94 | 872 | 849 | 170.0 |
| C | 3 | 233 | 149912 | 712.38 | 883 | 889 | 209.2 |
| C | 14 | 238 | 143397 | 681.23 | 883 | 889 | 209.2 |
| C | 2 | 114 | 16578 | 75.0 | 883 | 889 | 209.2 |
| D | 8 | 195 | 582039 | 2751.03 | 890 | 868 | 211.3 |
| D | 2 | 250 | 123063 | 578.42 | 890 | 868 | 211.3 |
| D | 12 | 233 | 56313 | 262.45 | 890 | 868 | 211.3 |
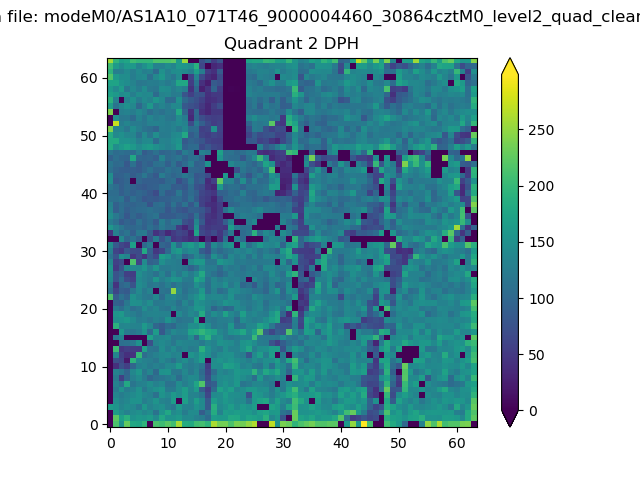
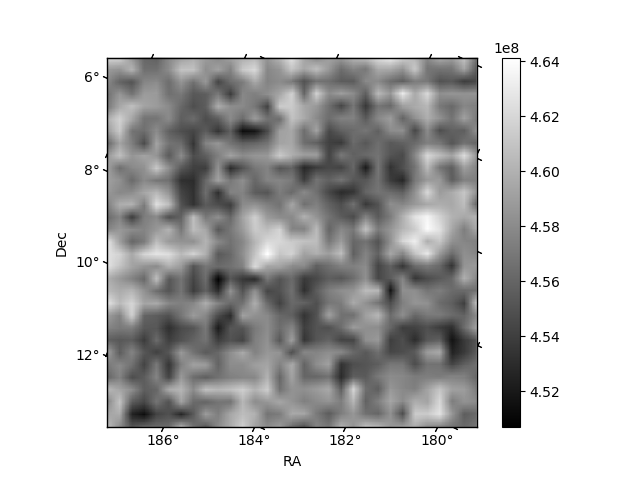
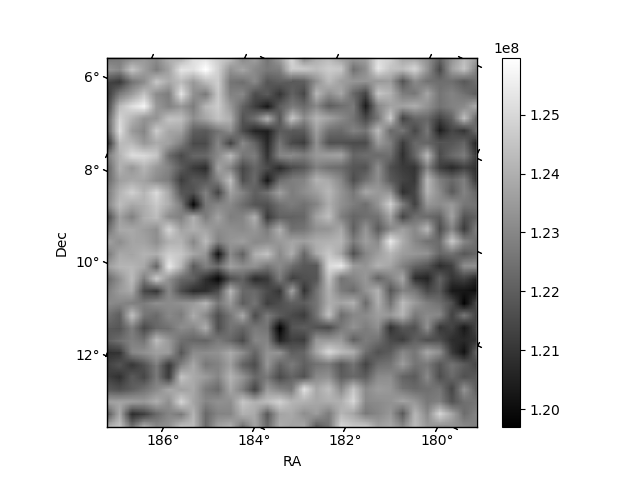
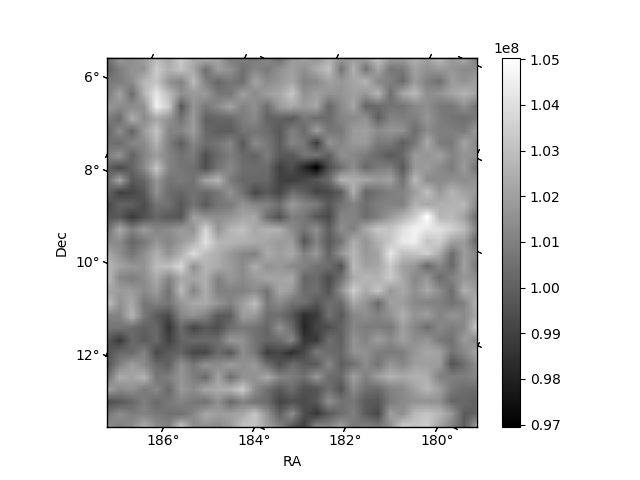
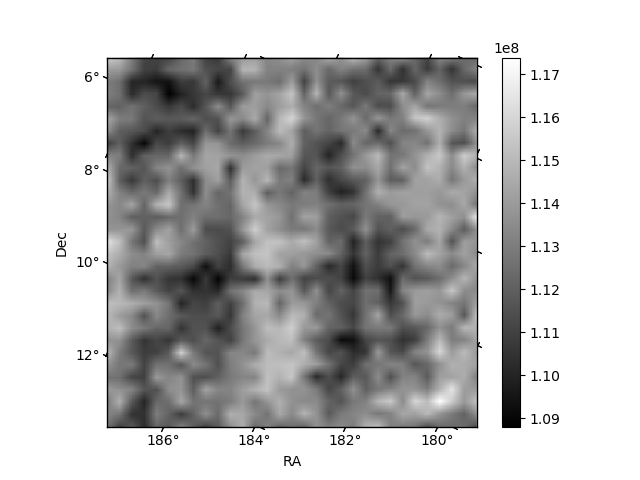
Histogram calculated using DETX and DETY for each event in the final _common_clean file
| Quadrant A | 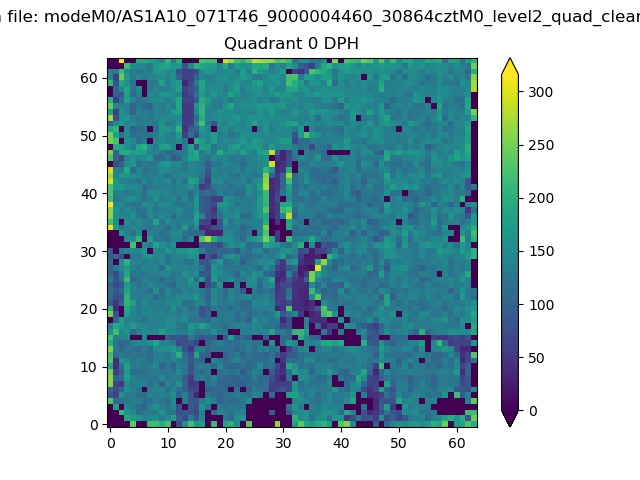 |
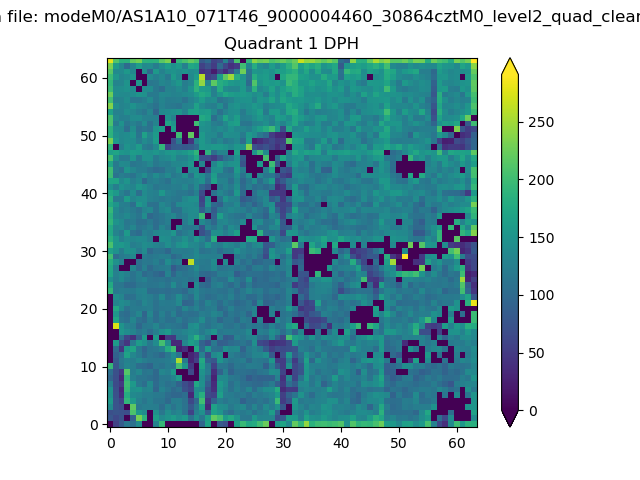 |
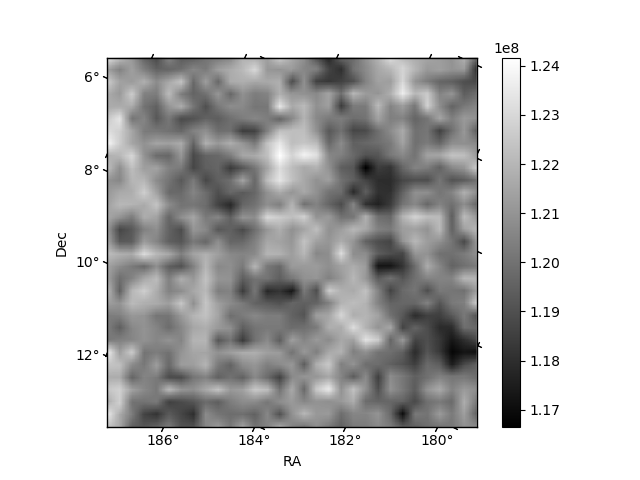
Quadrant B |
|---|---|---|---|
| Quadrant D | 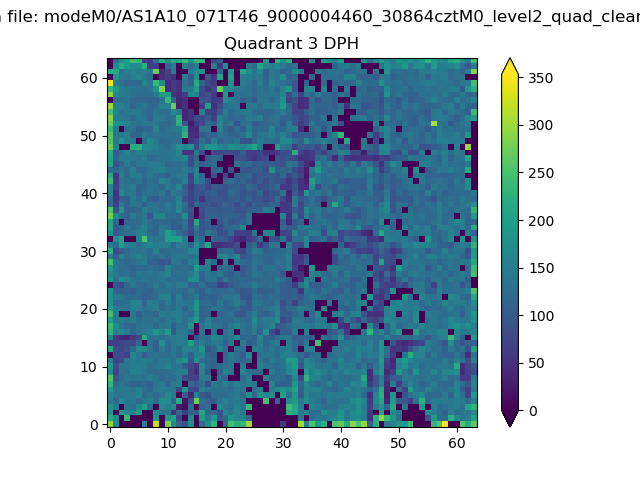 |
 |
Quadrant C |
| Plot type | Count rate plots | Images |
|---|---|---|
| Comparison with Poisson distribution Blue bars denote a histogram of data divided into 1 sec bins. Red curve is a Poisson curve with rate = median count rate of data. |
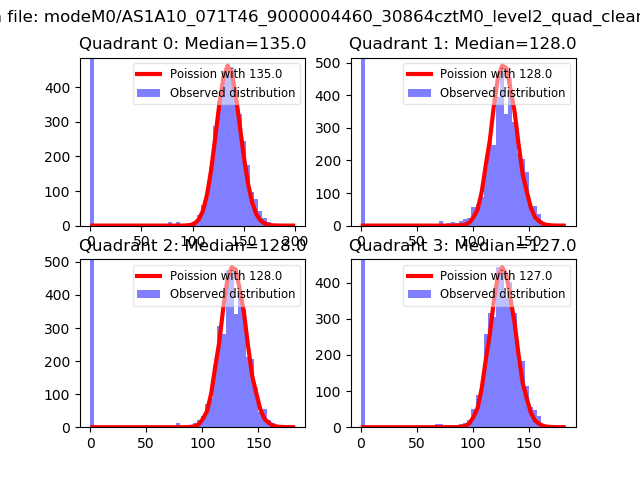 |
 |
| Quadrant-wise count rates Data is divided into 100 sec bins |
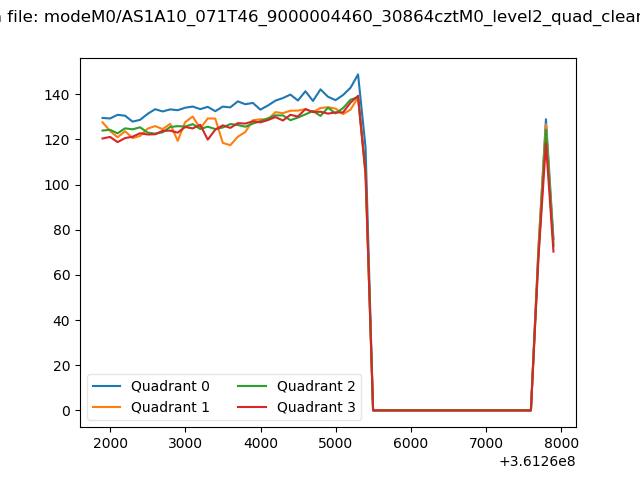 |
|
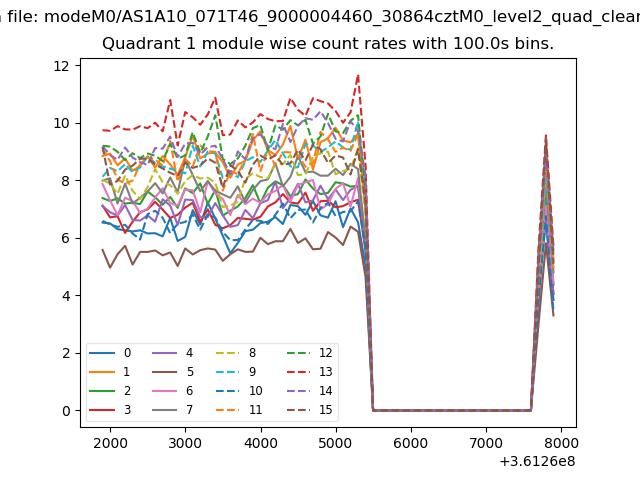
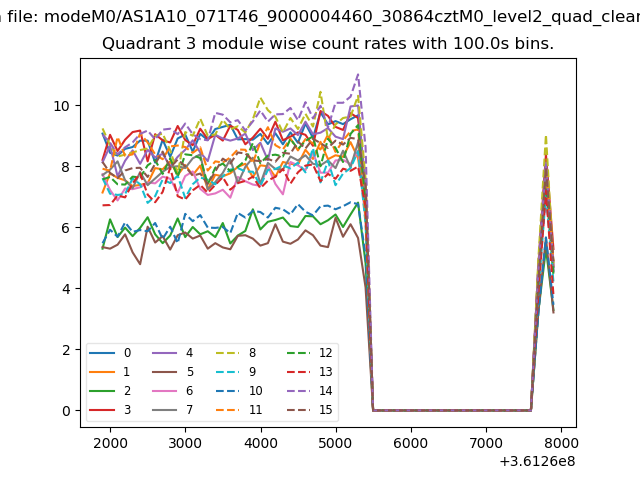
| Module-wise count rates for Quadrant A Data is divided into 100 sec bins |
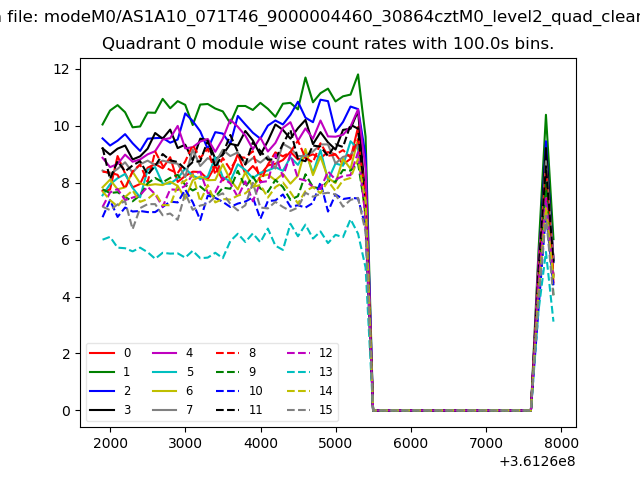 |
 |
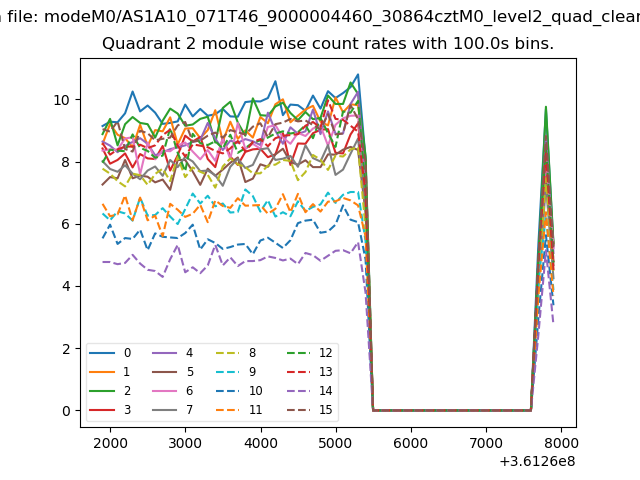
| Module-wise count rates for Quadrant B Data is divided into 100 sec bins |
 |
 |
| Module-wise count rates for Quadrant C Data is divided into 100 sec bins |
 |
 |
| Module-wise count rates for Quadrant D Data is divided into 100 sec bins |
 |
 |
| Parameter | Plot |
|---|---|
| CZT HV Monitor | 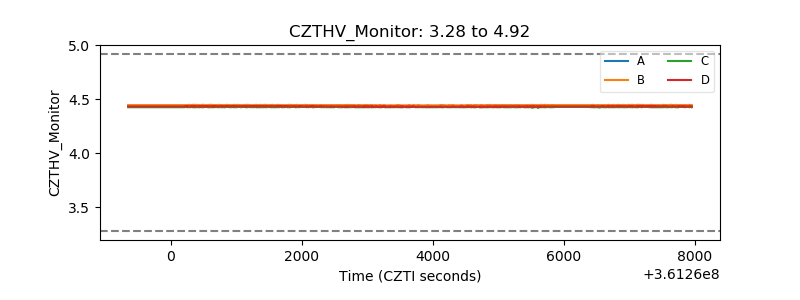 |
| D_VDD |  |
| Temperature 1 | 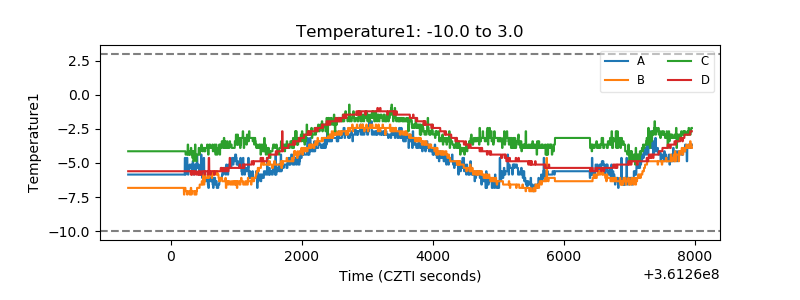 |
| Veto HV Monitor | 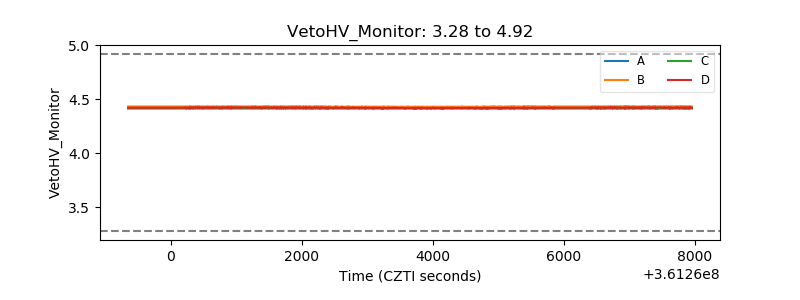 |
| Veto LLD | 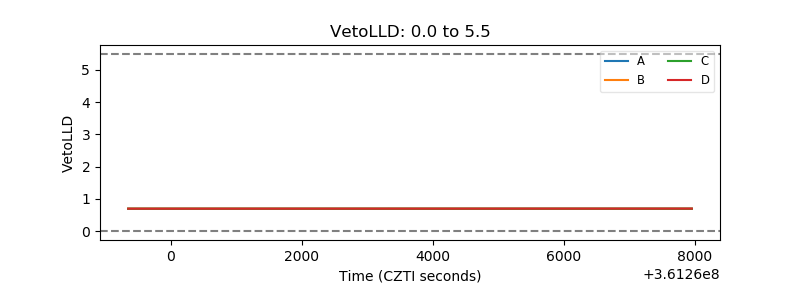 |
| Alpha Counter | 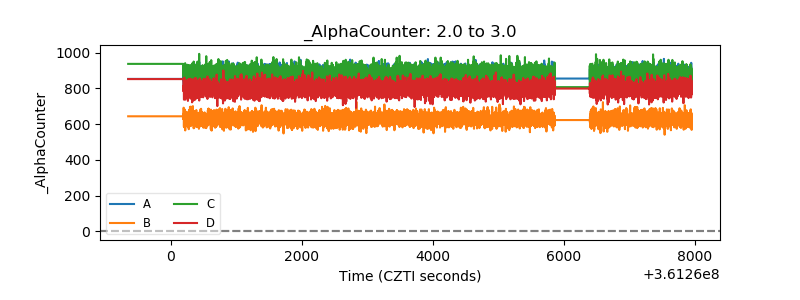 |
| _CPM_Rate | 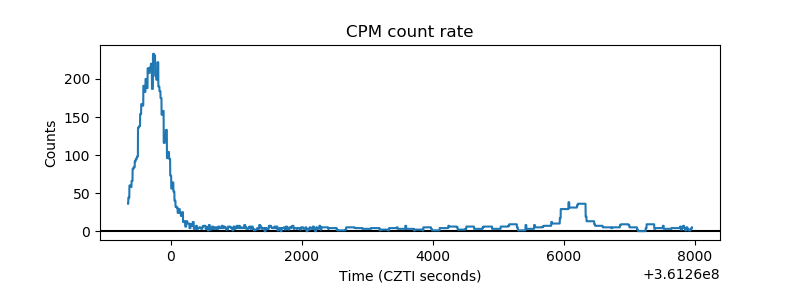 |
| CZT Counter | 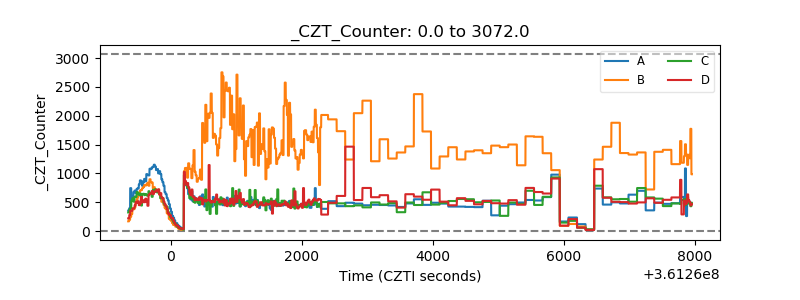 |
| +2.5 Volts monitor |  |
| +5 Volts monitor |  |
| _ROLL_ROT | 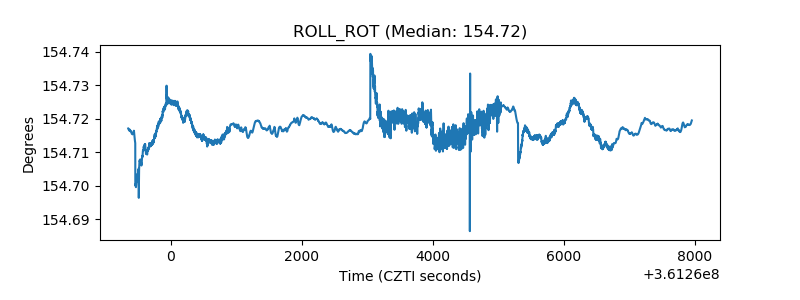 |
| _Roll_DEC | 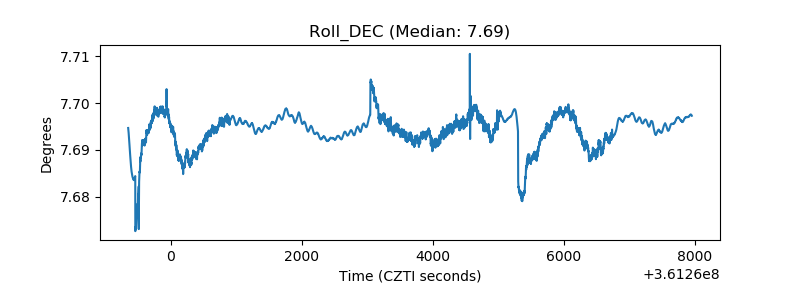 |
| _Roll_RA | 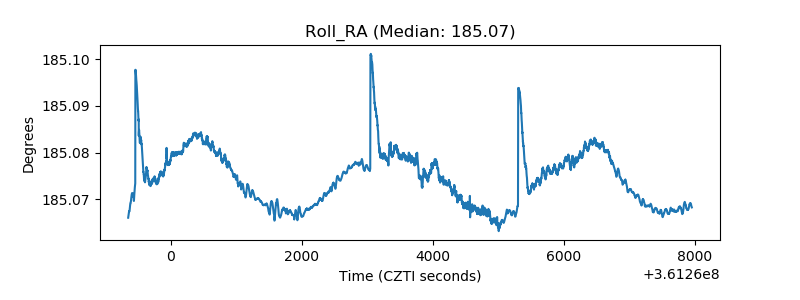 |
| Veto Counter | 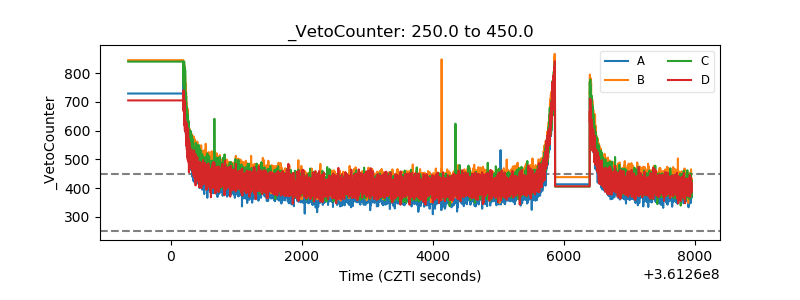 |