| Param | Original file | Final file |
|---|---|---|
| Filename | modeM0/AS1A10_071T46_9000004460_30865cztM0_level2.evt | modeM0/AS1A10_071T46_9000004460_30865cztM0_level2_quad_clean.evt |
| Size (bytes) | 806,469,120 | 91,704,960 |
| Size | 769.1 MB | 87.5 MB |
| Events in quadrant A | 4,134,306 | 578,518 |
| Events in quadrant B | 10,763,313 | 545,661 |
| Events in quadrant C | 4,270,068 | 549,451 |
| Events in quadrant D | 4,711,286 | 542,363 |
| Mode M0 | |||
|---|---|---|---|
| Quadrant | BADHDUFLAG | Total packets | Discarded packets |
| A | 0 | 17356 | 1 |
| B | 0 | 37688 | 1 |
| C | 0 | 17540 | 1 |
| D | 0 | 18817 | 1 |
| Mode SS | |||
|---|---|---|---|
| Quadrant | BADHDUFLAG | Total packets | Discarded packets |
| A | 0 | 162 | 0 |
| B | 0 | 162 | 0 |
| C | 0 | 162 | 0 |
| D | 0 | 162 | 0 |
| Quadrant | Total seconds | Saturated seconds | Saturation percentage |
|---|---|---|---|
| A | 8065 | 422 | 5.232486% |
| B | 8066 | 1596 | 19.786759% |
| C | 8066 | 472 | 5.851723% |
| D | 8066 | 347 | 4.302008% |
Noise dominated data is calculated using 1-second bins in cleaned event files. If a bin has >2000 counts, and if more than 50% of those come from <1% of pixels, then it is considered to be noise-dominated and hence unusable.
| Quadrant | # 1 sec bins | Bins with >0 counts | Bins with >2000 counts | High rate bins dominated by noise | Noise dominated (total time) | Noise dominated (detector-on time) | Marked lightcurve |
|---|---|---|---|---|---|---|---|
| A | 8065 | 8065 | 11 | 11 | 0.14% | 0.14% | 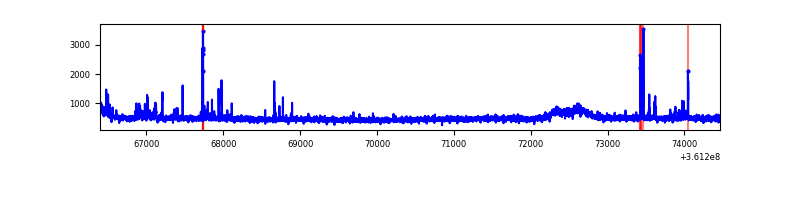 |
| B | 8066 | 8066 | 476 | 476 | 5.90% | 5.90% | 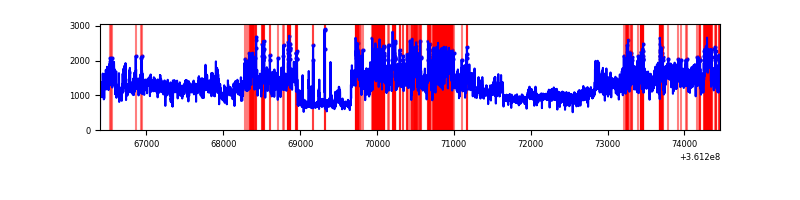 |
| C | 8066 | 8066 | 2 | 2 | 0.02% | 0.02% | 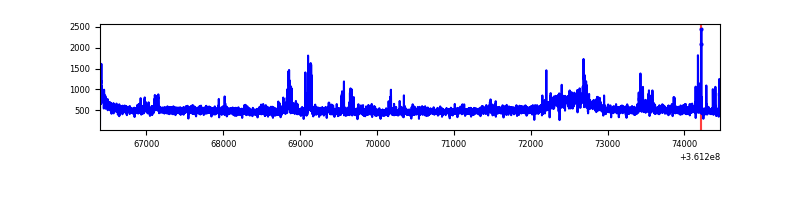 |
| D | 8066 | 8066 | 5 | 5 | 0.06% | 0.06% | 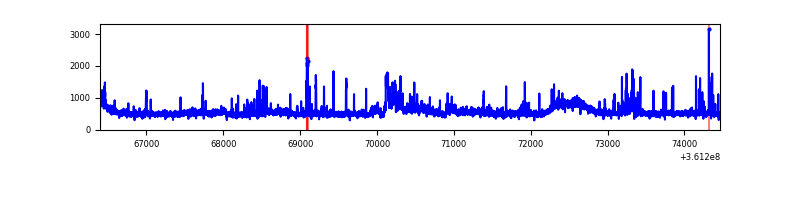 |
Top three noisy pixels from each quadrant. If the there are fewer than three noisy pixels in the level2.evt file, extra rows are filled as -1
| Pixel properties | Quadrant properties | ||||||
|---|---|---|---|---|---|---|---|
| Quadrant | DetID | PixID | Counts | Sigma | Mean | Median | Sigma |
| A | 0 | 13 | 146319 | 694.94 | 1030 | 1005 | 209.1 |
| A | 13 | 254 | 15234 | 68.05 | 1030 | 1005 | 209.1 |
| A | 5 | 168 | 13906 | 61.7 | 1030 | 1005 | 209.1 |
| B | 6 | 36 | 4509814 | 23483.92 | 985 | 959 | 192.0 |
| B | 6 | 159 | 2177287 | 11335.19 | 985 | 959 | 192.0 |
| B | 5 | 172 | 62105 | 318.47 | 985 | 959 | 192.0 |
| C | 14 | 238 | 157900 | 678.06 | 983 | 987 | 231.4 |
| C | 2 | 16 | 131339 | 563.29 | 983 | 987 | 231.4 |
| C | 3 | 233 | 116353 | 498.53 | 983 | 987 | 231.4 |
| D | 8 | 195 | 604847 | 2542.38 | 998 | 972 | 237.5 |
| D | 13 | 168 | 109849 | 458.38 | 998 | 972 | 237.5 |
| D | 12 | 233 | 80263 | 333.82 | 998 | 972 | 237.5 |
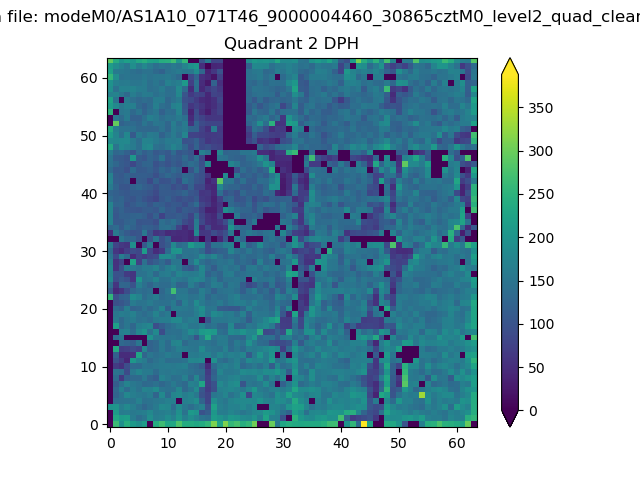
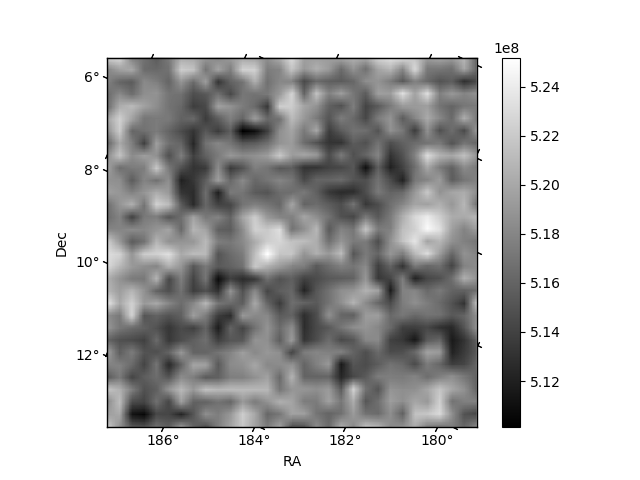
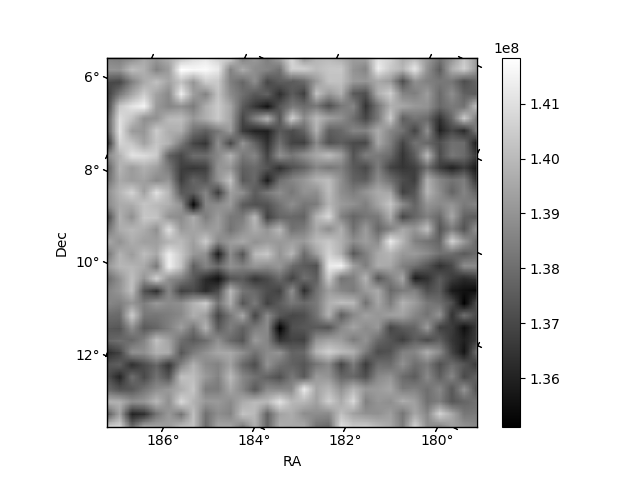
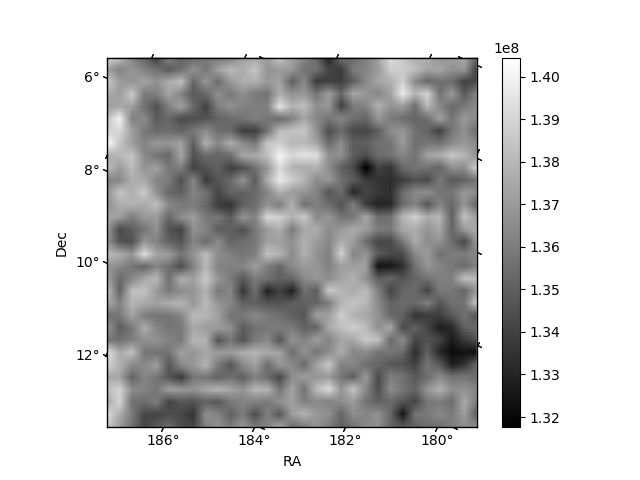
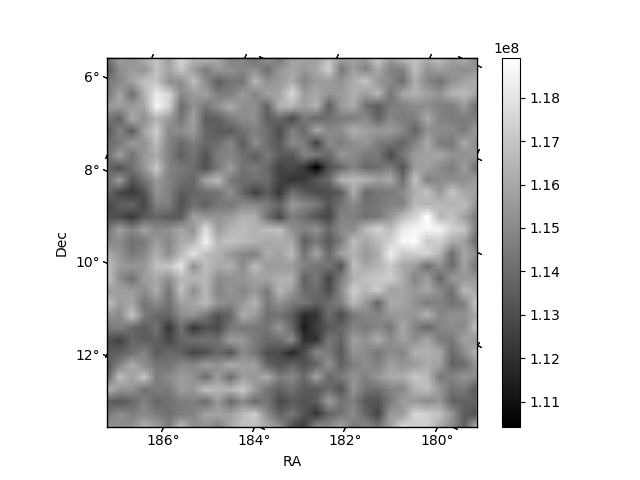
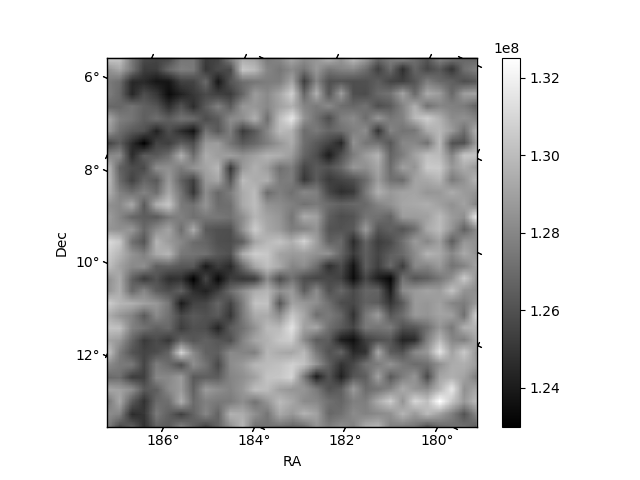
Histogram calculated using DETX and DETY for each event in the final _common_clean file
| Quadrant A | 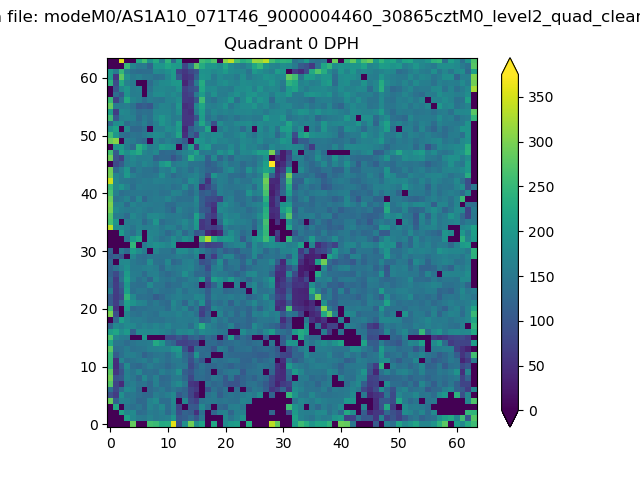 |
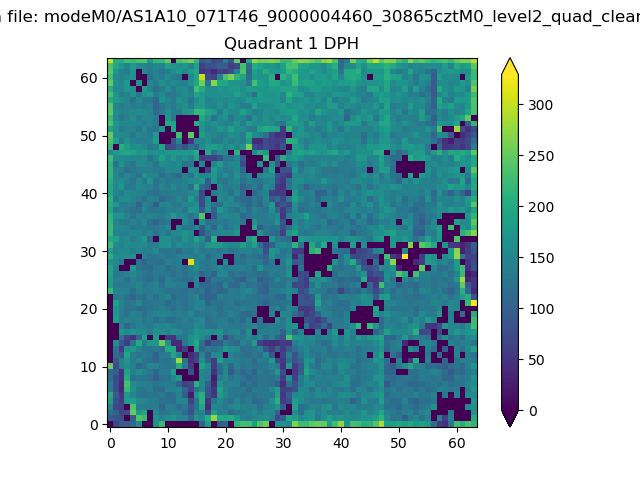 |
Quadrant B |
|---|---|---|---|
| Quadrant D | 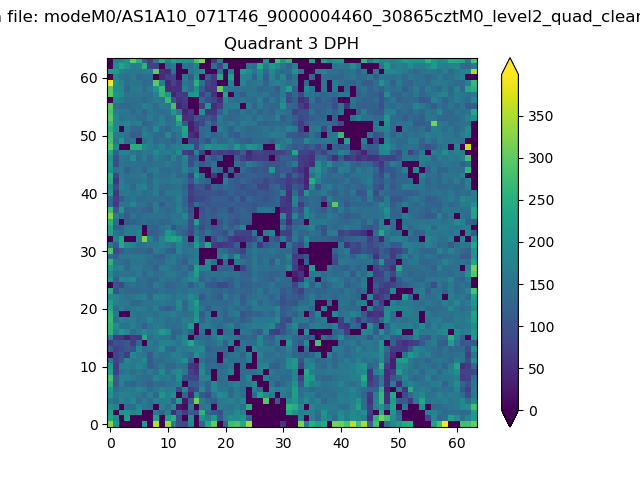 |
 |
Quadrant C |
| Plot type | Count rate plots | Images |
|---|---|---|
| Comparison with Poisson distribution Blue bars denote a histogram of data divided into 1 sec bins. Red curve is a Poisson curve with rate = median count rate of data. |
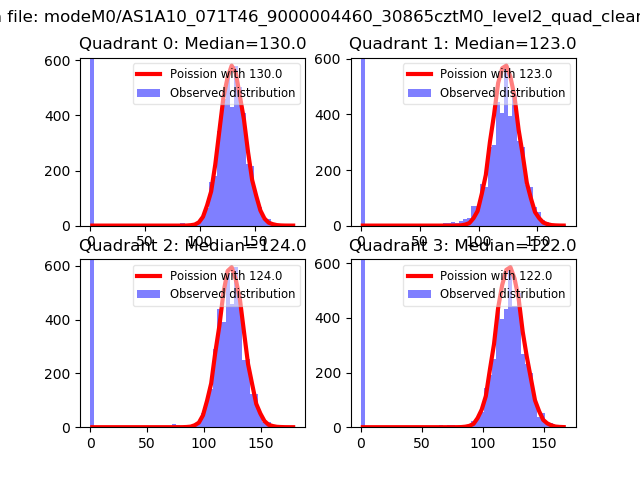 |
 |
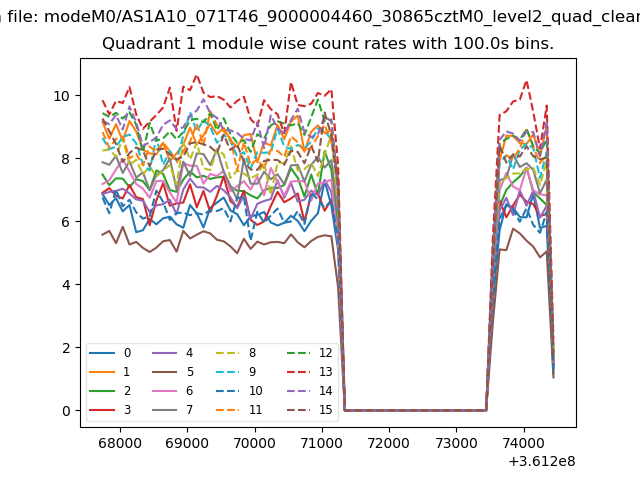
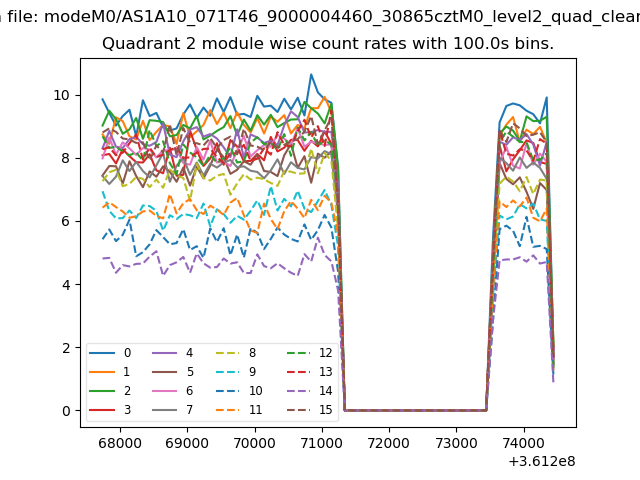
| Quadrant-wise count rates Data is divided into 100 sec bins |
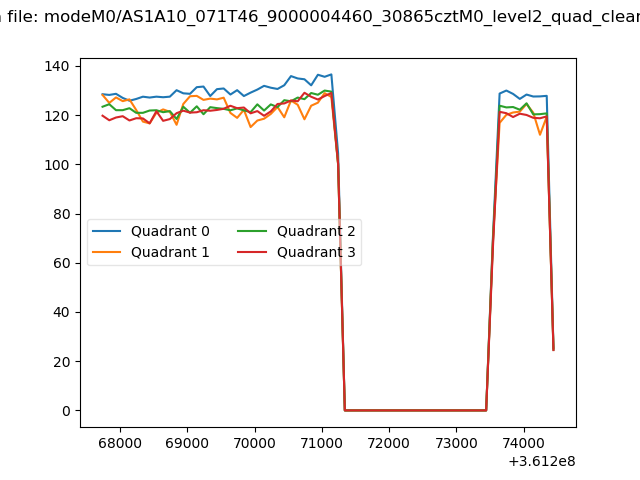 |
|
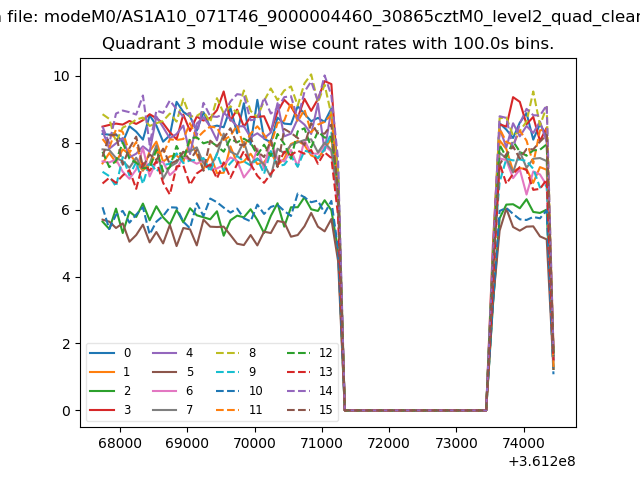
| Module-wise count rates for Quadrant A Data is divided into 100 sec bins |
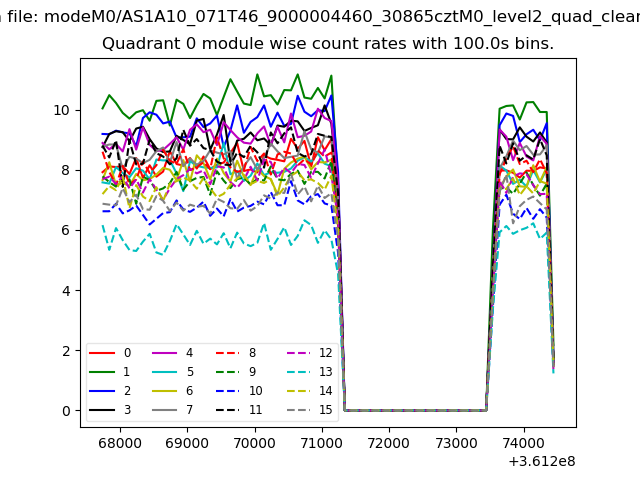 |
 |
| Module-wise count rates for Quadrant B Data is divided into 100 sec bins |
 |
 |
| Module-wise count rates for Quadrant C Data is divided into 100 sec bins |
 |
 |
| Module-wise count rates for Quadrant D Data is divided into 100 sec bins |
 |
 |
| Parameter | Plot |
|---|---|
| CZT HV Monitor | 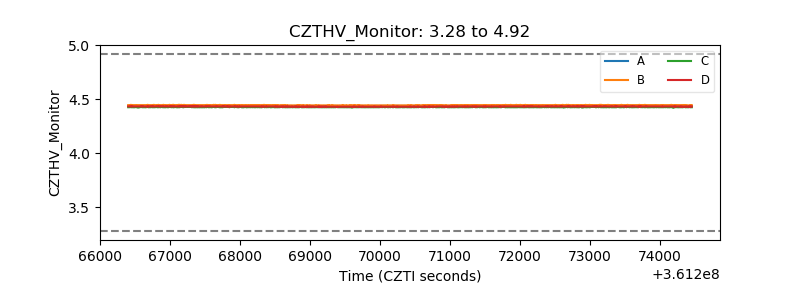 |
| D_VDD |  |
| Temperature 1 | 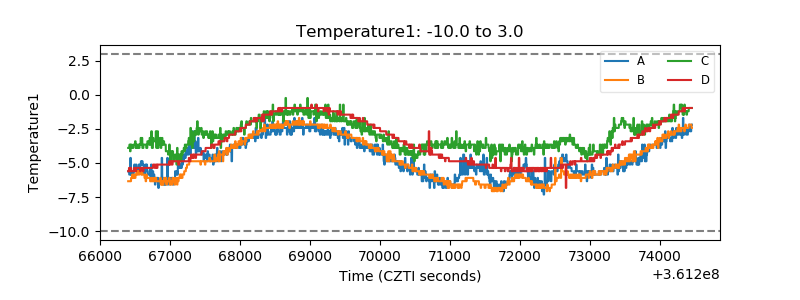 |
| Veto HV Monitor | 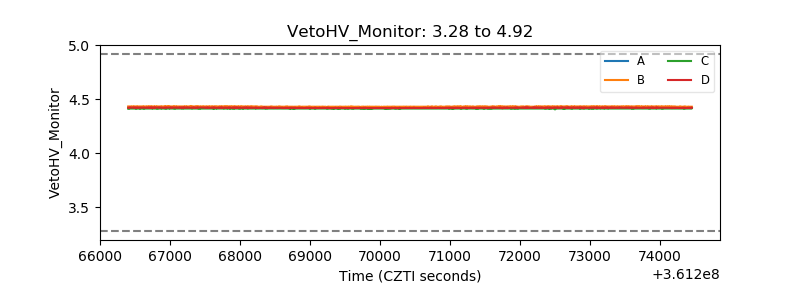 |
| Veto LLD | 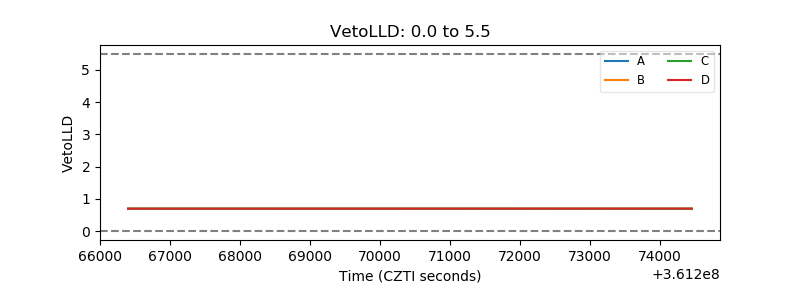 |
| Alpha Counter | 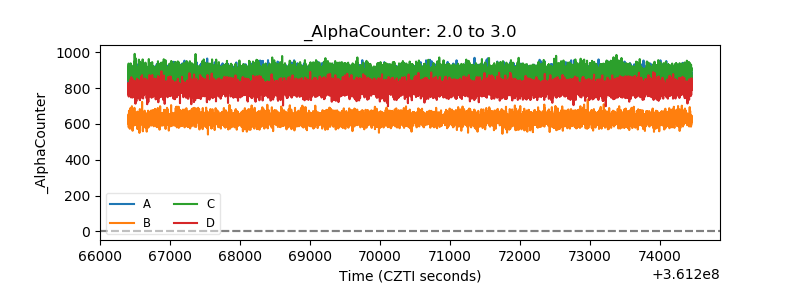 |
| _CPM_Rate | 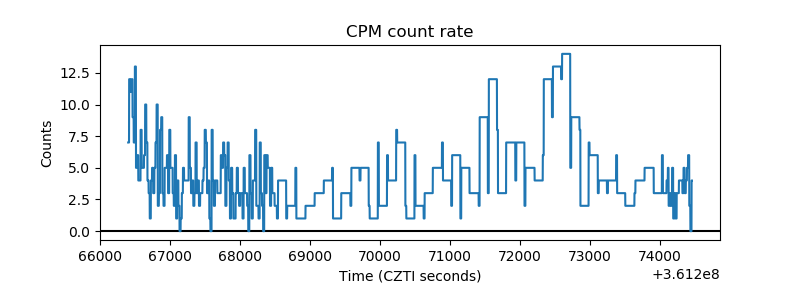 |
| CZT Counter | 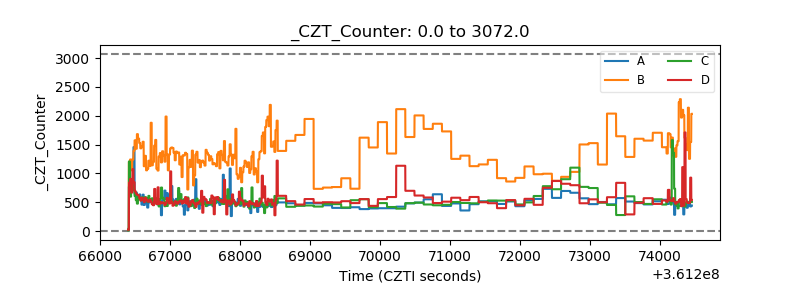 |
| +2.5 Volts monitor |  |
| +5 Volts monitor |  |
| _ROLL_ROT | 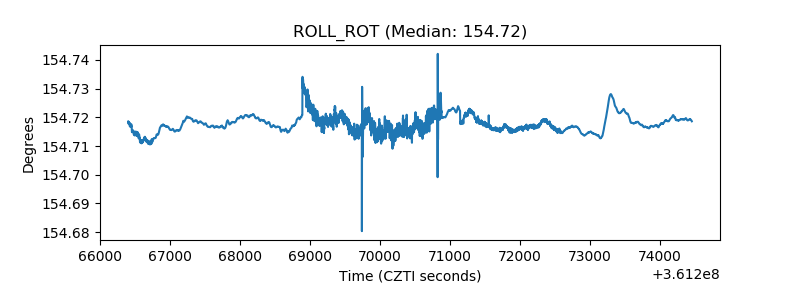 |
| _Roll_DEC | 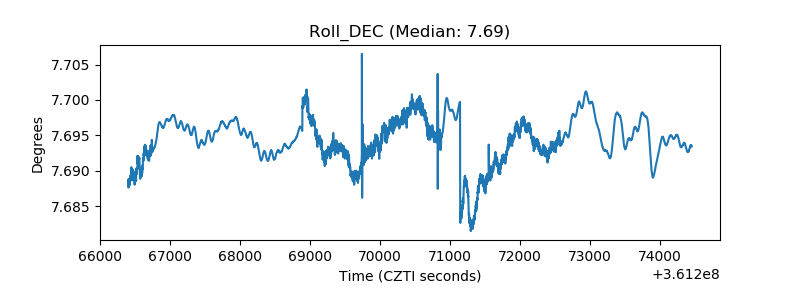 |
| _Roll_RA | 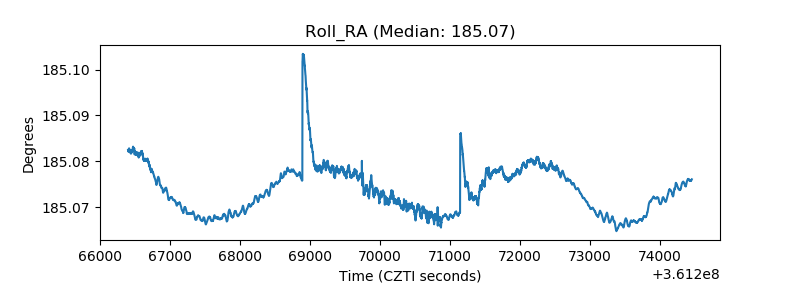 |
| Veto Counter | 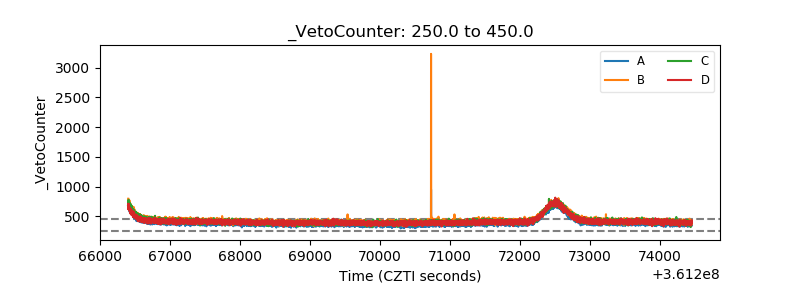 |